
 Login Sign Up


| |||||
 |  | ||||

| 12Stocks.com Market Intelligence |
Best Tech Stocks
| In a hurry? Tech Stocks Lists: Performance & Trends, Stock Charts, FANG Stocks
Sort Tech stocks: Daily, Weekly, Year-to-Date, Market Cap & Trends. Filter Tech stocks list by size:All Tech Large Mid-Range Small and MicroCap |
| 12Stocks.com Tech Stocks Performances & Trends Daily | |||||||||
|
|  The overall Smart Investing & Trading Score is 49 (0-bearish to 100-bullish) which puts Technology sector in short term neutral trend. The Smart Investing & Trading Score from previous trading session is 10 and hence an improvement of trend.
| ||||||||
Here are the Smart Investing & Trading Scores of the most requested Technology stocks at 12Stocks.com (click stock name for detailed review):
|


| 12Stocks.com: Investing in Technology sector with Stocks | |
|
The following table helps investors and traders sort through current performance and trends (as measured by Smart Investing & Trading Score) of various
stocks in the Tech sector. Quick View: Move mouse or cursor over stock symbol (ticker) to view short-term technical chart and over stock name to view long term chart. Click on  to add stock symbol to your watchlist and to add stock symbol to your watchlist and  to view watchlist. Click on any ticker or stock name for detailed market intelligence report for that stock. to view watchlist. Click on any ticker or stock name for detailed market intelligence report for that stock. |
12Stocks.com Performance of Stocks in Tech Sector
| Ticker | Stock Name | Watchlist | Category | Recent Price | Smart Investing & Trading Score | Change % | YTD Change% |
| APPN | Appian |   | Software | 31.98 | 7 | 3.06% | -15.08% |
| ZG | Zillow | | Internet | 40.07 | 7 | 2.25% | -29.35% |
| Z | Zillow | | Internet | 40.69 | 7 | 2.13% | -29.68% |
| CDW | CDW | | IT | 219.56 | 7 | 0.53% | -3.41% |
| FSLY | Fastly | | Software | 8.48 | 7 | -3.53% | -52.36% |
| IRM | Iron Mountain | | Software | 75.32 | 7 | -2.18% | 7.63% |
| BBAI | BigBear.ai | | IT | 1.50 | 7 | -13.33% | -29.81% |
| TENB | Tenable | | Software | 44.60 | 7 | -1.35% | -3.17% |
| YEXT | Yext | | Internet | 5.44 | 7 | -1.09% | -7.64% |
| ARQQ | Arqit Quantum | | Software - Infrastructure | 0.42 | 5 | -3.19% | -8.91% |
| DGII | Digi | | Communication | 25.73 | 0 | 0.90% | -1.04% |
| QRVO | Qorvo | | Semiconductor | 95.95 | 0 | 0.29% | -14.79% |
| FTNT | Fortinet | | Software | 58.88 | 0 | -9.69% | 0.60% |
| WEAV | Weave | | Software - | 8.62 | 0 | -9.17% | -25.82% |
| NVEC | NVE | | Semiconductor | 72.80 | 0 | -8.62% | -7.18% |
| TRMB | Trimble | | Instruments | 55.93 | 0 | -6.92% | 5.13% |
| VIAV | Viavi | | Communication | 7.56 | 0 | -5.74% | -24.93% |
| SPT | Sprout Social | | Software | 28.82 | 0 | -40.15% | -53.09% |
| TRVG | trivago N.V | | Internet | 2.41 | 0 | -3.60% | -1.23% |
| UIS | Unisys | | IT | 5.08 | 0 | -3.05% | -9.61% |
| FLYW | Flywire | | Software - Infrastructure | 19.57 | 0 | -3.02% | -16.47% |
| CYBR | CyberArk Software | | Software | 227.32 | 0 | -2.66% | 3.78% |
| COHU | Cohu | | Semiconductor | 29.60 | 0 | -2.44% | -16.36% |
| RMNI | Rimini Street | | Software | 2.55 | 0 | -2.30% | -22.02% |
| VNT | Vontier | | Instruments | 39.44 | 0 | -2.26% | 14.15% |
| For chart view version of above stock list: Chart View ➞ 0 - 25 , 25 - 50 , 50 - 75 , 75 - 100 , 100 - 125 , 125 - 150 , 150 - 175 , 175 - 200 , 200 - 225 , 225 - 250 , 250 - 275 , 275 - 300 , 300 - 325 , 325 - 350 , 350 - 375 , 375 - 400 , 400 - 425 , 425 - 450 , 450 - 475 , 475 - 500 , 500 - 525 , 525 - 550 , 550 - 575 , 575 - 600 , 600 - 625 , 625 - 650 | ||
 | Click To Change The Sort Order: By Market Cap or Company Size Performance: Year-to-date, Week and Day |  |
|
Get the most comprehensive stock market coverage daily at 12Stocks.com ➞ Best Stocks Today ➞ Best Stocks Weekly ➞ Best Stocks Year-to-Date ➞ Best Stocks Trends ➞  Best Stocks Today 12Stocks.com Best Nasdaq Stocks ➞ Best S&P 500 Stocks ➞ Best Tech Stocks ➞ Best Biotech Stocks ➞ |
| Detailed Overview of Tech Stocks |
| Tech Technical Overview, Leaders & Laggards, Top Tech ETF Funds & Detailed Tech Stocks List, Charts, Trends & More |
| Tech Sector: Technical Analysis, Trends & YTD Performance | |
| Technology sector is composed of stocks
from semiconductors, software, web, social media
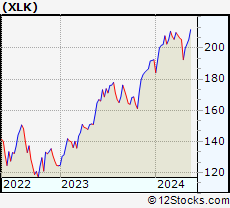
and services subsectors. Technology sector, as represented by XLK, an exchange-traded fund [ETF] that holds basket of tech stocks (e.g, Intel, Google) is up by 5.23% and is currently underperforming the overall market by -1.65% year-to-date. Below is a quick view of technical charts and trends: |
|
 XLK Weekly Chart |
|
| Long Term Trend: Not Good | |
| Medium Term Trend: Deteriorating | |
 XLK Daily Chart |
|
| Short Term Trend: Very Good | |
| Overall Trend Score: 49 | |
| YTD Performance: 5.23% | |
| **Trend Scores & Views Are Only For Educational Purposes And Not For Investing | |
| 12Stocks.com: Top Performing Technology Sector Stocks | ||||||||||||||||||||||||||||||||||||||||||||||||
 The top performing Technology sector stocks year to date are
Now, more recently, over last week, the top performing Technology sector stocks on the move are


|
||||||||||||||||||||||||||||||||||||||||||||||||
| 12Stocks.com: Investing in Tech Sector using Exchange Traded Funds | |
|
The following table shows list of key exchange traded funds (ETF) that
help investors track Tech Index. For detailed view, check out our ETF Funds section of our website. Quick View: Move mouse or cursor over ETF symbol (ticker) to view short-term technical chart and over ETF name to view long term chart. Click on ticker or stock name for detailed view. Click on to add stock symbol to your watchlist and to view watchlist. |
12Stocks.com List of ETFs that track Tech Index
| Ticker | ETF Name | Watchlist | Recent Price | Smart Investing & Trading Score | Change % | Week % | Year-to-date % |
| XLK | Technology | | 202.55 | 49 | 2.79 | 1.36 | 5.23% |
| QQQ | QQQ | | 435.48 | 57 | 2.01 | 1.04 | 6.34% |
| IYW | Technology | | 132.17 | 62 | 2.45 | 0.93 | 7.67% |
| VGT | Information Technology | | 509.46 | 49 | 2.70 | 1.1 | 5.26% |
| IXN | Global Tech | | 72.86 | 62 | 2.82 | 1.48 | 6.86% |
| IGV | Tech-Software | | 80.87 | 42 | 1.20 | -0.27 | -0.32% |
| XSD | Semiconductor | | 226.11 | 88 | 2.25 | 0.63 | 0.59% |
| TQQQ | QQQ | | 56.70 | 49 | 5.92 | 2.57 | 11.83% |
| SQQQ | Short QQQ | | 11.08 | 51 | -5.94 | -3.06 | -17.62% |
| SOXL | Semicondct Bull 3X | | 38.97 | 39 | 6.91 | -1.96 | 24.11% |
| SOXS | Semicondct Bear 3X | | 35.12 | 51 | -6.60 | 0.06 | 503.44% |
| SOXX | PHLX Semiconductor | | 216.17 | 52 | 2.25 | -0.34 | 12.57% |
| QTEC | First -100-Tech | | 182.75 | 42 | 1.45 | -0.67 | 4.15% |
| SMH | Semiconductor | | 217.73 | 65 | 2.69 | 0.04 | 24.51% |
| 12Stocks.com: Charts, Trends, Fundamental Data and Performances of Tech Stocks | |
|
We now take in-depth look at all Tech stocks including charts, multi-period performances and overall trends (as measured by Smart Investing & Trading Score). One can sort Tech stocks (click link to choose) by Daily, Weekly and by Year-to-Date performances. Also, one can sort by size of the company or by market capitalization. |
| Select Your Default Chart Type: | |||||
| |||||
| Click on stock symbol or name for detailed view. Click on to add stock symbol to your watchlist and to view watchlist. Quick View: Move mouse or cursor over "Daily" to quickly view daily technical stock chart and over "Weekly" to view weekly technical stock chart. | |||||


 | APPN Appian Corporation |
| Sector: Technology | |
| SubSector: Application Software | |
| MarketCap: 2737.92 Millions | |
| Recent Price: 31.98 Smart Investing & Trading Score: 7 | |
| Day Percent Change: 3.06% Day Change: 0.95 | |
| Week Change: -14.86% Year-to-date Change: -15.1% | |
| APPN Links: Profile News Message Board | |
| Charts:- Daily , Weekly | |
| Add APPN to Watchlist: View: Get Complete APPN Trend Analysis ➞ | |
 | ZG Zillow Group, Inc. |
| Sector: Technology | |
| SubSector: Internet Information Providers | |
| MarketCap: 6536.7 Millions | |
| Recent Price: 40.07 Smart Investing & Trading Score: 7 | |
| Day Percent Change: 2.25% Day Change: 0.88 | |
| Week Change: -7.09% Year-to-date Change: -29.4% | |
| ZG Links: Profile News Message Board | |
| Charts:- Daily , Weekly | |
| Add ZG to Watchlist: View: Get Complete ZG Trend Analysis ➞ | |
 | Z Zillow Group, Inc. |
| Sector: Technology | |
| SubSector: Internet Information Providers | |
| MarketCap: 3880.4 Millions | |
| Recent Price: 40.69 Smart Investing & Trading Score: 7 | |
| Day Percent Change: 2.13% Day Change: 0.85 | |
| Week Change: -6.82% Year-to-date Change: -29.7% | |
| Z Links: Profile News Message Board | |
| Charts:- Daily , Weekly | |
| Add Z to Watchlist: View: Get Complete Z Trend Analysis ➞ | |
 | CDW CDW Corporation |
| Sector: Technology | |
| SubSector: Information Technology Services | |
| MarketCap: 12775 Millions | |
| Recent Price: 219.56 Smart Investing & Trading Score: 7 | |
| Day Percent Change: 0.53% Day Change: 1.15 | |
| Week Change: -9.37% Year-to-date Change: -3.4% | |
| CDW Links: Profile News Message Board | |
| Charts:- Daily , Weekly | |
| Add CDW to Watchlist: View: Get Complete CDW Trend Analysis ➞ | |
 | FSLY Fastly, Inc. |
| Sector: Technology | |
| SubSector: Application Software | |
| MarketCap: 1973.72 Millions | |
| Recent Price: 8.48 Smart Investing & Trading Score: 7 | |
| Day Percent Change: -3.53% Day Change: -0.31 | |
| Week Change: -34.52% Year-to-date Change: -52.4% | |
| FSLY Links: Profile News Message Board | |
| Charts:- Daily , Weekly | |
| Add FSLY to Watchlist: View: Get Complete FSLY Trend Analysis ➞ | |
 | IRM Iron Mountain Incorporated |
| Sector: Technology | |
| SubSector: Business Software & Services | |
| MarketCap: 7339.18 Millions | |
| Recent Price: 75.32 Smart Investing & Trading Score: 7 | |
| Day Percent Change: -2.18% Day Change: -1.68 | |
| Week Change: -2.84% Year-to-date Change: 7.6% | |
| IRM Links: Profile News Message Board | |
| Charts:- Daily , Weekly | |
| Add IRM to Watchlist: View: Get Complete IRM Trend Analysis ➞ | |
 | BBAI BigBear.ai Holdings, Inc. |
| Sector: Technology | |
| SubSector: Information Technology Services | |
| MarketCap: 339 Millions | |
| Recent Price: 1.50 Smart Investing & Trading Score: 7 | |
| Day Percent Change: -13.33% Day Change: -0.23 | |
| Week Change: -16.94% Year-to-date Change: -29.8% | |
| BBAI Links: Profile News Message Board | |
| Charts:- Daily , Weekly | |
| Add BBAI to Watchlist: View: Get Complete BBAI Trend Analysis ➞ | |
 | TENB Tenable Holdings, Inc. |
| Sector: Technology | |
| SubSector: Business Software & Services | |
| MarketCap: 1986.68 Millions | |
| Recent Price: 44.60 Smart Investing & Trading Score: 7 | |
| Day Percent Change: -1.35% Day Change: -0.61 | |
| Week Change: -3.02% Year-to-date Change: -3.2% | |
| TENB Links: Profile News Message Board | |
| Charts:- Daily , Weekly | |
| Add TENB to Watchlist: View: Get Complete TENB Trend Analysis ➞ | |
 | YEXT Yext, Inc. |
| Sector: Technology | |
| SubSector: Internet Software & Services | |
| MarketCap: 1414.91 Millions | |
| Recent Price: 5.44 Smart Investing & Trading Score: 7 | |
| Day Percent Change: -1.09% Day Change: -0.06 | |
| Week Change: -1.81% Year-to-date Change: -7.6% | |
| YEXT Links: Profile News Message Board | |
| Charts:- Daily , Weekly | |
| Add YEXT to Watchlist: View: Get Complete YEXT Trend Analysis ➞ | |
 | ARQQ Arqit Quantum Inc. |
| Sector: Technology | |
| SubSector: Software - Infrastructure | |
| MarketCap: 165 Millions | |
| Recent Price: 0.42 Smart Investing & Trading Score: 5 | |
| Day Percent Change: -3.19% Day Change: -0.01 | |
| Week Change: -14.64% Year-to-date Change: -8.9% | |
| ARQQ Links: Profile News Message Board | |
| Charts:- Daily , Weekly | |
| Add ARQQ to Watchlist: View: Get Complete ARQQ Trend Analysis ➞ | |
 | DGII Digi International Inc. |
| Sector: Technology | |
| SubSector: Communication Equipment | |
| MarketCap: 257.339 Millions | |
| Recent Price: 25.73 Smart Investing & Trading Score: 0 | |
| Day Percent Change: 0.90% Day Change: 0.23 | |
| Week Change: -16.87% Year-to-date Change: -1.0% | |
| DGII Links: Profile News Message Board | |
| Charts:- Daily , Weekly | |
| Add DGII to Watchlist: View: Get Complete DGII Trend Analysis ➞ | |
 | QRVO Qorvo, Inc. |
| Sector: Technology | |
| SubSector: Semiconductor - Broad Line | |
| MarketCap: 9524.32 Millions | |
| Recent Price: 95.95 Smart Investing & Trading Score: 0 | |
| Day Percent Change: 0.29% Day Change: 0.28 | |
| Week Change: -17.82% Year-to-date Change: -14.8% | |
| QRVO Links: Profile News Message Board | |
| Charts:- Daily , Weekly | |
| Add QRVO to Watchlist: View: Get Complete QRVO Trend Analysis ➞ | |
 | FTNT Fortinet, Inc. |
| Sector: Technology | |
| SubSector: Application Software | |
| MarketCap: 16993.8 Millions | |
| Recent Price: 58.88 Smart Investing & Trading Score: 0 | |
| Day Percent Change: -9.69% Day Change: -6.32 | |
| Week Change: -8.26% Year-to-date Change: 0.6% | |
| FTNT Links: Profile News Message Board | |
| Charts:- Daily , Weekly | |
| Add FTNT to Watchlist: View: Get Complete FTNT Trend Analysis ➞ | |
 | WEAV Weave Communications, Inc. |
| Sector: Technology | |
| SubSector: Software - Application | |
| MarketCap: 740 Millions | |
| Recent Price: 8.62 Smart Investing & Trading Score: 0 | |
| Day Percent Change: -9.17% Day Change: -0.87 | |
| Week Change: -23.92% Year-to-date Change: -25.8% | |
| WEAV Links: Profile News Message Board | |
| Charts:- Daily , Weekly | |
| Add WEAV to Watchlist: View: Get Complete WEAV Trend Analysis ➞ | |
 | NVEC NVE Corporation |
| Sector: Technology | |
| SubSector: Semiconductor - Specialized | |
| MarketCap: 231.26 Millions | |
| Recent Price: 72.80 Smart Investing & Trading Score: 0 | |
| Day Percent Change: -8.62% Day Change: -6.87 | |
| Week Change: -9.44% Year-to-date Change: -7.2% | |
| NVEC Links: Profile News Message Board | |
| Charts:- Daily , Weekly | |
| Add NVEC to Watchlist: View: Get Complete NVEC Trend Analysis ➞ | |
 | TRMB Trimble Inc. |
| Sector: Technology | |
| SubSector: Scientific & Technical Instruments | |
| MarketCap: 7990.33 Millions | |
| Recent Price: 55.93 Smart Investing & Trading Score: 0 | |
| Day Percent Change: -6.92% Day Change: -4.16 | |
| Week Change: -7.02% Year-to-date Change: 5.1% | |
| TRMB Links: Profile News Message Board | |
| Charts:- Daily , Weekly | |
| Add TRMB to Watchlist: View: Get Complete TRMB Trend Analysis ➞ | |
 | VIAV Viavi Solutions Inc. |
| Sector: Technology | |
| SubSector: Communication Equipment | |
| MarketCap: 2653.29 Millions | |
| Recent Price: 7.56 Smart Investing & Trading Score: 0 | |
| Day Percent Change: -5.74% Day Change: -0.46 | |
| Week Change: -5.62% Year-to-date Change: -24.9% | |
| VIAV Links: Profile News Message Board | |
| Charts:- Daily , Weekly | |
| Add VIAV to Watchlist: View: Get Complete VIAV Trend Analysis ➞ | |
 | SPT Sprout Social, Inc. |
| Sector: Technology | |
| SubSector: Software Application | |
| MarketCap: 25087 Millions | |
| Recent Price: 28.82 Smart Investing & Trading Score: 0 | |
| Day Percent Change: -40.15% Day Change: -19.33 | |
| Week Change: -43.92% Year-to-date Change: -53.1% | |
| SPT Links: Profile News Message Board | |
| Charts:- Daily , Weekly | |
| Add SPT to Watchlist: View: Get Complete SPT Trend Analysis ➞ | |
 | TRVG trivago N.V. |
| Sector: Technology | |
| SubSector: Internet Information Providers | |
| MarketCap: 587.88 Millions | |
| Recent Price: 2.41 Smart Investing & Trading Score: 0 | |
| Day Percent Change: -3.60% Day Change: -0.09 | |
| Week Change: -5.49% Year-to-date Change: -1.2% | |
| TRVG Links: Profile News Message Board | |
| Charts:- Daily , Weekly | |
| Add TRVG to Watchlist: View: Get Complete TRVG Trend Analysis ➞ | |
 | UIS Unisys Corporation |
| Sector: Technology | |
| SubSector: Information Technology Services | |
| MarketCap: 803.868 Millions | |
| Recent Price: 5.08 Smart Investing & Trading Score: 0 | |
| Day Percent Change: -3.05% Day Change: -0.16 | |
| Week Change: -6.96% Year-to-date Change: -9.6% | |
| UIS Links: Profile News Message Board | |
| Charts:- Daily , Weekly | |
| Add UIS to Watchlist: View: Get Complete UIS Trend Analysis ➞ | |
 | FLYW Flywire Corporation |
| Sector: Technology | |
| SubSector: Software - Infrastructure | |
| MarketCap: 3390 Millions | |
| Recent Price: 19.57 Smart Investing & Trading Score: 0 | |
| Day Percent Change: -3.02% Day Change: -0.61 | |
| Week Change: -5.87% Year-to-date Change: -16.5% | |
| FLYW Links: Profile News Message Board | |
| Charts:- Daily , Weekly | |
| Add FLYW to Watchlist: View: Get Complete FLYW Trend Analysis ➞ | |
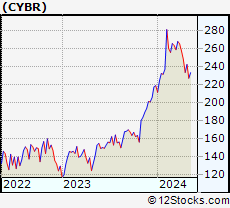 | CYBR CyberArk Software Ltd. |
| Sector: Technology | |
| SubSector: Business Software & Services | |
| MarketCap: 3223.58 Millions | |
| Recent Price: 227.32 Smart Investing & Trading Score: 0 | |
| Day Percent Change: -2.66% Day Change: -6.22 | |
| Week Change: -6.3% Year-to-date Change: 3.8% | |
| CYBR Links: Profile News Message Board | |
| Charts:- Daily , Weekly | |
| Add CYBR to Watchlist: View: Get Complete CYBR Trend Analysis ➞ | |
 | COHU Cohu, Inc. |
| Sector: Technology | |
| SubSector: Semiconductor Equipment & Materials | |
| MarketCap: 519.518 Millions | |
| Recent Price: 29.60 Smart Investing & Trading Score: 0 | |
| Day Percent Change: -2.44% Day Change: -0.74 | |
| Week Change: -4.76% Year-to-date Change: -16.4% | |
| COHU Links: Profile News Message Board | |
| Charts:- Daily , Weekly | |
| Add COHU to Watchlist: View: Get Complete COHU Trend Analysis ➞ | |
 | RMNI Rimini Street, Inc. |
| Sector: Technology | |
| SubSector: Application Software | |
| MarketCap: 288.762 Millions | |
| Recent Price: 2.55 Smart Investing & Trading Score: 0 | |
| Day Percent Change: -2.30% Day Change: -0.06 | |
| Week Change: -8.93% Year-to-date Change: -22.0% | |
| RMNI Links: Profile News Message Board | |
| Charts:- Daily , Weekly | |
| Add RMNI to Watchlist: View: Get Complete RMNI Trend Analysis ➞ | |
 | VNT Vontier Corporation |
| Sector: Technology | |
| SubSector: Scientific & Technical Instruments | |
| MarketCap: 53787 Millions | |
| Recent Price: 39.44 Smart Investing & Trading Score: 0 | |
| Day Percent Change: -2.26% Day Change: -0.91 | |
| Week Change: -4.32% Year-to-date Change: 14.2% | |
| VNT Links: Profile News Message Board | |
| Charts:- Daily , Weekly | |
| Add VNT to Watchlist: View: Get Complete VNT Trend Analysis ➞ | |
| For tabular summary view of above stock list: Summary View ➞ 0 - 25 , 25 - 50 , 50 - 75 , 75 - 100 , 100 - 125 , 125 - 150 , 150 - 175 , 175 - 200 , 200 - 225 , 225 - 250 , 250 - 275 , 275 - 300 , 300 - 325 , 325 - 350 , 350 - 375 , 375 - 400 , 400 - 425 , 425 - 450 , 450 - 475 , 475 - 500 , 500 - 525 , 525 - 550 , 550 - 575 , 575 - 600 , 600 - 625 , 625 - 650 | ||
| Click To Change The Sort Order: By Market Cap or Company Size Performance: Year-to-date, Week and Day | |
| Select Chart Type: | ||
|
Best Stocks Today 12Stocks.com |
© 2024 12Stocks.com Terms & Conditions Privacy Contact Us
All Information Provided Only For Education And Not To Be Used For Investing or Trading. See Terms & Conditions


One More Thing ... Get Best Stocks Delivered Daily!
Never Ever Miss A Move With Our Top Ten Stocks Lists
Find Best Stocks In Any Market - Bull or Bear Market
Take A Peek At Our Top Ten Stocks Lists: Daily, Weekly, Year-to-Date & Top Trends
Find Best Stocks In Any Market - Bull or Bear Market
Take A Peek At Our Top Ten Stocks Lists: Daily, Weekly, Year-to-Date & Top Trends
Technology Stocks With Best Up Trends [0-bearish to 100-bullish]: WideOpenWest [100], FTC Solar[100], Clearfield [100], OneSpan [100], Itron [100], Cardlytics [100], First Solar[100], Apple [100], Cricut [100], Motorola [100], Conduent [100]
Best Technology Stocks Year-to-Date:
MicroCloud Hologram[553.24%], MediaCo Holding[400%], Bakkt [199.55%], Uxin [188.16%], Smith Micro[183.29%], Super Micro[175.35%], CXApp [157.92%], CuriosityStream [109.22%], SoundHound AI[103.27%], NextNav [100.67%], MediaAlpha [99.64%] Best Technology Stocks This Week:
Bakkt [1571.25%], Luna Innovations[53.77%], SYLA [48.97%], 2U [41.49%], WideOpenWest [40.06%], FTC Solar[32.15%], Mitcham Industries[31.57%], Koninklijke Philips[27.29%], Conduent [26.47%], Cogint [25.08%], AXT [23.23%] Best Technology Stocks Daily:
Luna Innovations[36.00%], WideOpenWest [28.23%], Upland Software[28.22%], 2U [26.63%], FTC Solar[25.09%], Arteris [21.36%], AXT [20.79%], Aurora Innovation[18.09%], Clearfield [13.22%], OneSpan [13.15%], Paylocity Holding[12.05%]