
 Login Sign Up


| |||||
 |  | ||||

| 12Stocks.com Market Intelligence |
Best Tech Stocks
| In a hurry? Tech Stocks Lists: Performance & Trends, Stock Charts, FANG Stocks
Sort Tech stocks: Daily, Weekly, Year-to-Date, Market Cap & Trends. Filter Tech stocks list by size:All Tech Large Mid-Range Small and MicroCap |
| 12Stocks.com Tech Stocks Performances & Trends Daily | |||||||||
|
|  The overall Smart Investing & Trading Score is 21 (0-bearish to 100-bullish) which puts Technology sector in short term bearish to neutral trend. The Smart Investing & Trading Score from previous trading session is 68 and hence a deterioration of trend.
| ||||||||
Here are the Smart Investing & Trading Scores of the most requested Technology stocks at 12Stocks.com (click stock name for detailed review):
|


| 12Stocks.com: Investing in Technology sector with Stocks | |
|
The following table helps investors and traders sort through current performance and trends (as measured by Smart Investing & Trading Score) of various
stocks in the Tech sector. Quick View: Move mouse or cursor over stock symbol (ticker) to view short-term technical chart and over stock name to view long term chart. Click on  to add stock symbol to your watchlist and to add stock symbol to your watchlist and  to view watchlist. Click on any ticker or stock name for detailed market intelligence report for that stock. to view watchlist. Click on any ticker or stock name for detailed market intelligence report for that stock. |
12Stocks.com Performance of Stocks in Tech Sector
| Ticker | Stock Name | Watchlist | Category | Recent Price | Smart Investing & Trading Score | Change % | YTD Change% |
| FN | Fabrinet |   | Electronic | 173.07 | 42 | -1.66% | -9.07% |
| HIMX | Himax | | Semiconductor | 5.05 | 42 | -0.59% | -16.80% |
| AIP | Arteris | | Semiconductors | 6.63 | 41 | 0.00% | 12.56% |
| LYFT | Lyft | | Software | 15.64 | 41 | -4.05% | 4.34% |
| FRSH | Freshworks | | Software - | 17.85 | 41 | -3.07% | -24.01% |
| FROG | JFrog | | Software | 39.88 | 41 | -2.57% | 15.19% |
| ICAD | iCAD | | Software | 1.43 | 41 | -2.05% | -19.21% |
| DAO | Youdao | | Internet | 3.50 | 41 | -1.96% | -11.17% |
| NTNX | Nutanix | | Software | 60.70 | 41 | -2.52% | 27.28% |
| SAP | SAP SE | | Software | 181.21 | 41 | -1.39% | 17.22% |
| UI | Ubiquiti | | Communication | 107.58 | 40 | -1.27% | -22.91% |
| ZI | ZoomInfo | | Software | 15.86 | 40 | -3.47% | -14.22% |
| KE | Kimball Electronics | | Electronics | 20.93 | 40 | -2.97% | -22.34% |
| SKM | SK Telecom | | Wireless | 20.43 | 40 | -1.21% | -4.53% |
| PANW | Palo Alto | | Networking | 290.89 | 40 | -0.86% | -1.35% |
| USM | United States | | Wireless | 36.36 | 40 | -0.66% | -12.47% |
| AVGO | Broadcom | | Semiconductor | 1300.27 | 39 | -2.86% | 16.49% |
| TTD | Trade Desk | | Software | 82.85 | 39 | -1.95% | 15.13% |
| HQY | HealthEquity | | Healthcare Information | 78.91 | 39 | -1.73% | 19.02% |
| PSTG | Pure Storage | | Data Storage | 50.40 | 38 | -3.87% | 41.33% |
| OLO | Olo | | Software - | 4.80 | 38 | -2.83% | -16.08% |
| GDDY | GoDaddy | | Internet | 122.38 | 38 | -2.10% | 15.28% |
| STER | Sterling Check | | Software - Infrastructure | 15.14 | 38 | -1.94% | 8.69% |
| BCE | BCE | | Telecom | 32.85 | 38 | 0.31% | -16.58% |
| SNPS | Synopsys | | Semiconductor | 530.59 | 38 | -2.60% | 3.05% |
| For chart view version of above stock list: Chart View ➞ 0 - 25 , 25 - 50 , 50 - 75 , 75 - 100 , 100 - 125 , 125 - 150 , 150 - 175 , 175 - 200 , 200 - 225 , 225 - 250 , 250 - 275 , 275 - 300 , 300 - 325 , 325 - 350 , 350 - 375 , 375 - 400 , 400 - 425 , 425 - 450 , 450 - 475 , 475 - 500 , 500 - 525 , 525 - 550 , 550 - 575 , 575 - 600 , 600 - 625 , 625 - 650 | ||
 | Click To Change The Sort Order: By Market Cap or Company Size Performance: Year-to-date, Week and Day |  |
|
Get the most comprehensive stock market coverage daily at 12Stocks.com ➞ Best Stocks Today ➞ Best Stocks Weekly ➞ Best Stocks Year-to-Date ➞ Best Stocks Trends ➞  Best Stocks Today 12Stocks.com Best Nasdaq Stocks ➞ Best S&P 500 Stocks ➞ Best Tech Stocks ➞ Best Biotech Stocks ➞ |
| Detailed Overview of Tech Stocks |
| Tech Technical Overview, Leaders & Laggards, Top Tech ETF Funds & Detailed Tech Stocks List, Charts, Trends & More |
| Tech Sector: Technical Analysis, Trends & YTD Performance | |
| Technology sector is composed of stocks
from semiconductors, software, web, social media
and services subsectors. Technology sector, as represented by XLK, an exchange-traded fund [ETF] that holds basket of tech stocks (e.g, Intel, Google) is up by 1.94% and is currently underperforming the overall market by -2.86% year-to-date. Below is a quick view of technical charts and trends: |
|
 XLK Weekly Chart |
|
| Long Term Trend: Not Good | |
| Medium Term Trend: Not Good | |
 XLK Daily Chart |
|
| Short Term Trend: Not Good | |
| Overall Trend Score: 21 | |
| YTD Performance: 1.94% | |
| **Trend Scores & Views Are Only For Educational Purposes And Not For Investing | |
| 12Stocks.com: Top Performing Technology Sector Stocks | ||||||||||||||||||||||||||||||||||||||||||||||||
 The top performing Technology sector stocks year to date are
Now, more recently, over last week, the top performing Technology sector stocks on the move are


|
||||||||||||||||||||||||||||||||||||||||||||||||
| 12Stocks.com: Investing in Tech Sector using Exchange Traded Funds | |
|
The following table shows list of key exchange traded funds (ETF) that
help investors track Tech Index. For detailed view, check out our ETF Funds section of our website. Quick View: Move mouse or cursor over ETF symbol (ticker) to view short-term technical chart and over ETF name to view long term chart. Click on ticker or stock name for detailed view. Click on to add stock symbol to your watchlist and to view watchlist. |
12Stocks.com List of ETFs that track Tech Index
| Ticker | ETF Name | Watchlist | Recent Price | Smart Investing & Trading Score | Change % | Week % | Year-to-date % |
| XLK | Technology | | 196.22 | 21 | -2.23 | -1.81 | 1.94% |
| QQQ | QQQ | | 424.59 | 41 | -1.90 | -1.49 | 3.68% |
| IYW | Technology | | 128.17 | 34 | -2.19 | -2.12 | 4.42% |
| VGT | Information Technology | | 494.73 | 28 | -2.22 | -1.83 | 2.22% |
| IXN | Global Tech | | 70.48 | 34 | -2.18 | -1.84 | 3.37% |
| IGV | Tech-Software | | 78.92 | 0 | -2.51 | -2.67 | -2.72% |
| XSD | Semiconductor | | 224.50 | 93 | -1.81 | -0.08 | -0.13% |
| TQQQ | QQQ | | 52.73 | 28 | -5.73 | -4.6 | 4.01% |
| SQQQ | Short QQQ | | 11.95 | 55 | 5.66 | 4.55 | -11.15% |
| SOXL | Semicondct Bull 3X | | 38.18 | 58 | -5.98 | -3.95 | 21.59% |
| SOXS | Semicondct Bear 3X | | 36.57 | 58 | 6.34 | 4.19 | 528.35% |
| SOXX | PHLX Semiconductor | | 213.99 | 56 | -2.07 | -1.34 | 11.43% |
| QTEC | First -100-Tech | | 180.06 | 28 | -2.02 | -2.14 | 2.62% |
| SMH | Semiconductor | | 214.09 | 63 | -1.96 | -1.63 | 22.43% |
| 12Stocks.com: Charts, Trends, Fundamental Data and Performances of Tech Stocks | |
|
We now take in-depth look at all Tech stocks including charts, multi-period performances and overall trends (as measured by Smart Investing & Trading Score). One can sort Tech stocks (click link to choose) by Daily, Weekly and by Year-to-Date performances. Also, one can sort by size of the company or by market capitalization. |
| Select Your Default Chart Type: | |||||
| |||||
| Click on stock symbol or name for detailed view. Click on to add stock symbol to your watchlist and to view watchlist. Quick View: Move mouse or cursor over "Daily" to quickly view daily technical stock chart and over "Weekly" to view weekly technical stock chart. | |||||


 | FN Fabrinet |
| Sector: Technology | |
| SubSector: Electronic Equipment | |
| MarketCap: 1876 Millions | |
| Recent Price: 173.07 Smart Investing & Trading Score: 42 | |
| Day Percent Change: -1.66% Day Change: -2.93 | |
| Week Change: -1.36% Year-to-date Change: -9.1% | |
| FN Links: Profile News Message Board | |
| Charts:- Daily , Weekly | |
| Add FN to Watchlist: View: Get Complete FN Trend Analysis ➞ | |
 | HIMX Himax Technologies, Inc. |
| Sector: Technology | |
| SubSector: Semiconductor - Specialized | |
| MarketCap: 496.16 Millions | |
| Recent Price: 5.05 Smart Investing & Trading Score: 42 | |
| Day Percent Change: -0.59% Day Change: -0.03 | |
| Week Change: 0.2% Year-to-date Change: -16.8% | |
| HIMX Links: Profile News Message Board | |
| Charts:- Daily , Weekly | |
| Add HIMX to Watchlist: View: Get Complete HIMX Trend Analysis ➞ | |
 | AIP Arteris, Inc. |
| Sector: Technology | |
| SubSector: Semiconductors | |
| MarketCap: 234 Millions | |
| Recent Price: 6.63 Smart Investing & Trading Score: 41 | |
| Day Percent Change: 0.00% Day Change: 0.00 | |
| Week Change: -1.04% Year-to-date Change: 12.6% | |
| AIP Links: Profile News Message Board | |
| Charts:- Daily , Weekly | |
| Add AIP to Watchlist: View: Get Complete AIP Trend Analysis ➞ | |
 | LYFT Lyft, Inc. |
| Sector: Technology | |
| SubSector: Application Software | |
| MarketCap: 7923.22 Millions | |
| Recent Price: 15.64 Smart Investing & Trading Score: 41 | |
| Day Percent Change: -4.05% Day Change: -0.66 | |
| Week Change: -4.46% Year-to-date Change: 4.3% | |
| LYFT Links: Profile News Message Board | |
| Charts:- Daily , Weekly | |
| Add LYFT to Watchlist: View: Get Complete LYFT Trend Analysis ➞ | |
 | FRSH Freshworks Inc. |
| Sector: Technology | |
| SubSector: Software - Application | |
| MarketCap: 5000 Millions | |
| Recent Price: 17.85 Smart Investing & Trading Score: 41 | |
| Day Percent Change: -3.07% Day Change: -0.56 | |
| Week Change: -3.2% Year-to-date Change: -24.0% | |
| FRSH Links: Profile News Message Board | |
| Charts:- Daily , Weekly | |
| Add FRSH to Watchlist: View: Get Complete FRSH Trend Analysis ➞ | |
 | FROG JFrog Ltd. |
| Sector: Technology | |
| SubSector: Software Application | |
| MarketCap: 62287 Millions | |
| Recent Price: 39.88 Smart Investing & Trading Score: 41 | |
| Day Percent Change: -2.57% Day Change: -1.05 | |
| Week Change: -5.03% Year-to-date Change: 15.2% | |
| FROG Links: Profile News Message Board | |
| Charts:- Daily , Weekly | |
| Add FROG to Watchlist: View: Get Complete FROG Trend Analysis ➞ | |
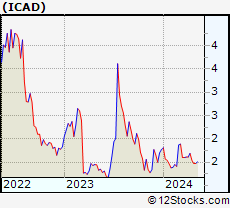 | ICAD iCAD, Inc. |
| Sector: Technology | |
| SubSector: Technical & System Software | |
| MarketCap: 174.8 Millions | |
| Recent Price: 1.43 Smart Investing & Trading Score: 41 | |
| Day Percent Change: -2.05% Day Change: -0.03 | |
| Week Change: -2.72% Year-to-date Change: -19.2% | |
| ICAD Links: Profile News Message Board | |
| Charts:- Daily , Weekly | |
| Add ICAD to Watchlist: View: Get Complete ICAD Trend Analysis ➞ | |
 | DAO Youdao, Inc. |
| Sector: Technology | |
| SubSector: Internet Information Providers | |
| MarketCap: 2073.2 Millions | |
| Recent Price: 3.50 Smart Investing & Trading Score: 41 | |
| Day Percent Change: -1.96% Day Change: -0.07 | |
| Week Change: -0.57% Year-to-date Change: -11.2% | |
| DAO Links: Profile News Message Board | |
| Charts:- Daily , Weekly | |
| Add DAO to Watchlist: View: Get Complete DAO Trend Analysis ➞ | |
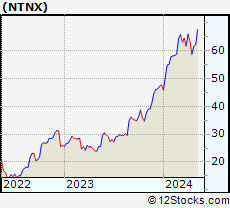 | NTNX Nutanix, Inc. |
| Sector: Technology | |
| SubSector: Technical & System Software | |
| MarketCap: 3376.6 Millions | |
| Recent Price: 60.70 Smart Investing & Trading Score: 41 | |
| Day Percent Change: -2.52% Day Change: -1.57 | |
| Week Change: -1.56% Year-to-date Change: 27.3% | |
| NTNX Links: Profile News Message Board | |
| Charts:- Daily , Weekly | |
| Add NTNX to Watchlist: View: Get Complete NTNX Trend Analysis ➞ | |
 | SAP SAP SE |
| Sector: Technology | |
| SubSector: Application Software | |
| MarketCap: 129635 Millions | |
| Recent Price: 181.21 Smart Investing & Trading Score: 41 | |
| Day Percent Change: -1.39% Day Change: -2.56 | |
| Week Change: -2.67% Year-to-date Change: 17.2% | |
| SAP Links: Profile News Message Board | |
| Charts:- Daily , Weekly | |
| Add SAP to Watchlist: View: Get Complete SAP Trend Analysis ➞ | |
 | UI Ubiquiti Inc. |
| Sector: Technology | |
| SubSector: Communication Equipment | |
| MarketCap: 9526.89 Millions | |
| Recent Price: 107.58 Smart Investing & Trading Score: 40 | |
| Day Percent Change: -1.27% Day Change: -1.38 | |
| Week Change: -0.66% Year-to-date Change: -22.9% | |
| UI Links: Profile News Message Board | |
| Charts:- Daily , Weekly | |
| Add UI to Watchlist: View: Get Complete UI Trend Analysis ➞ | |
 | ZI ZoomInfo Technologies Inc. |
| Sector: Technology | |
| SubSector: Software Application | |
| MarketCap: 15937 Millions | |
| Recent Price: 15.86 Smart Investing & Trading Score: 40 | |
| Day Percent Change: -3.47% Day Change: -0.57 | |
| Week Change: -3.12% Year-to-date Change: -14.2% | |
| ZI Links: Profile News Message Board | |
| Charts:- Daily , Weekly | |
| Add ZI to Watchlist: View: Get Complete ZI Trend Analysis ➞ | |
 | KE Kimball Electronics, Inc. |
| Sector: Technology | |
| SubSector: Diversified Electronics | |
| MarketCap: 308.896 Millions | |
| Recent Price: 20.93 Smart Investing & Trading Score: 40 | |
| Day Percent Change: -2.97% Day Change: -0.64 | |
| Week Change: 0.53% Year-to-date Change: -22.3% | |
| KE Links: Profile News Message Board | |
| Charts:- Daily , Weekly | |
| Add KE to Watchlist: View: Get Complete KE Trend Analysis ➞ | |
 | SKM SK Telecom Co.,Ltd |
| Sector: Technology | |
| SubSector: Wireless Communications | |
| MarketCap: 12332.1 Millions | |
| Recent Price: 20.43 Smart Investing & Trading Score: 40 | |
| Day Percent Change: -1.21% Day Change: -0.25 | |
| Week Change: -0.87% Year-to-date Change: -4.5% | |
| SKM Links: Profile News Message Board | |
| Charts:- Daily , Weekly | |
| Add SKM to Watchlist: View: Get Complete SKM Trend Analysis ➞ | |
 | PANW Palo Alto Networks, Inc. |
| Sector: Technology | |
| SubSector: Networking & Communication Devices | |
| MarketCap: 16039.4 Millions | |
| Recent Price: 290.89 Smart Investing & Trading Score: 40 | |
| Day Percent Change: -0.86% Day Change: -2.52 | |
| Week Change: -0.18% Year-to-date Change: -1.4% | |
| PANW Links: Profile News Message Board | |
| Charts:- Daily , Weekly | |
| Add PANW to Watchlist: View: Get Complete PANW Trend Analysis ➞ | |
 | USM United States Cellular Corporation |
| Sector: Technology | |
| SubSector: Wireless Communications | |
| MarketCap: 2587.67 Millions | |
| Recent Price: 36.36 Smart Investing & Trading Score: 40 | |
| Day Percent Change: -0.66% Day Change: -0.24 | |
| Week Change: -1.14% Year-to-date Change: -12.5% | |
| USM Links: Profile News Message Board | |
| Charts:- Daily , Weekly | |
| Add USM to Watchlist: View: Get Complete USM Trend Analysis ➞ | |
 | AVGO Broadcom Inc. |
| Sector: Technology | |
| SubSector: Semiconductor - Broad Line | |
| MarketCap: 86329.1 Millions | |
| Recent Price: 1300.27 Smart Investing & Trading Score: 39 | |
| Day Percent Change: -2.86% Day Change: -38.35 | |
| Week Change: -3.26% Year-to-date Change: 16.5% | |
| AVGO Links: Profile News Message Board | |
| Charts:- Daily , Weekly | |
| Add AVGO to Watchlist: View: Get Complete AVGO Trend Analysis ➞ | |
 | TTD The Trade Desk, Inc. |
| Sector: Technology | |
| SubSector: Application Software | |
| MarketCap: 9006.92 Millions | |
| Recent Price: 82.85 Smart Investing & Trading Score: 39 | |
| Day Percent Change: -1.95% Day Change: -1.65 | |
| Week Change: -2.22% Year-to-date Change: 15.1% | |
| TTD Links: Profile News Message Board | |
| Charts:- Daily , Weekly | |
| Add TTD to Watchlist: View: Get Complete TTD Trend Analysis ➞ | |
 | HQY HealthEquity, Inc. |
| Sector: Technology | |
| SubSector: Healthcare Information Services | |
| MarketCap: 3369.75 Millions | |
| Recent Price: 78.91 Smart Investing & Trading Score: 39 | |
| Day Percent Change: -1.73% Day Change: -1.39 | |
| Week Change: -1.68% Year-to-date Change: 19.0% | |
| HQY Links: Profile News Message Board | |
| Charts:- Daily , Weekly | |
| Add HQY to Watchlist: View: Get Complete HQY Trend Analysis ➞ | |
 | PSTG Pure Storage, Inc. |
| Sector: Technology | |
| SubSector: Data Storage Devices | |
| MarketCap: 2993.99 Millions | |
| Recent Price: 50.40 Smart Investing & Trading Score: 38 | |
| Day Percent Change: -3.87% Day Change: -2.03 | |
| Week Change: -4.82% Year-to-date Change: 41.3% | |
| PSTG Links: Profile News Message Board | |
| Charts:- Daily , Weekly | |
| Add PSTG to Watchlist: View: Get Complete PSTG Trend Analysis ➞ | |
 | OLO Olo Inc. |
| Sector: Technology | |
| SubSector: Software - Application | |
| MarketCap: 1030 Millions | |
| Recent Price: 4.80 Smart Investing & Trading Score: 38 | |
| Day Percent Change: -2.83% Day Change: -0.14 | |
| Week Change: -4% Year-to-date Change: -16.1% | |
| OLO Links: Profile News Message Board | |
| Charts:- Daily , Weekly | |
| Add OLO to Watchlist: View: Get Complete OLO Trend Analysis ➞ | |
 | GDDY GoDaddy Inc. |
| Sector: Technology | |
| SubSector: Internet Software & Services | |
| MarketCap: 9570.51 Millions | |
| Recent Price: 122.38 Smart Investing & Trading Score: 38 | |
| Day Percent Change: -2.10% Day Change: -2.63 | |
| Week Change: -2.1% Year-to-date Change: 15.3% | |
| GDDY Links: Profile News Message Board | |
| Charts:- Daily , Weekly | |
| Add GDDY to Watchlist: View: Get Complete GDDY Trend Analysis ➞ | |
 | STER Sterling Check Corp. |
| Sector: Technology | |
| SubSector: Software - Infrastructure | |
| MarketCap: 1180 Millions | |
| Recent Price: 15.14 Smart Investing & Trading Score: 38 | |
| Day Percent Change: -1.94% Day Change: -0.30 | |
| Week Change: -1.11% Year-to-date Change: 8.7% | |
| STER Links: Profile News Message Board | |
| Charts:- Daily , Weekly | |
| Add STER to Watchlist: View: Get Complete STER Trend Analysis ➞ | |
 | BCE BCE Inc. |
| Sector: Technology | |
| SubSector: Telecom Services - Domestic | |
| MarketCap: 37288.3 Millions | |
| Recent Price: 32.85 Smart Investing & Trading Score: 38 | |
| Day Percent Change: 0.31% Day Change: 0.10 | |
| Week Change: 0.71% Year-to-date Change: -16.6% | |
| BCE Links: Profile News Message Board | |
| Charts:- Daily , Weekly | |
| Add BCE to Watchlist: View: Get Complete BCE Trend Analysis ➞ | |
 | SNPS Synopsys, Inc. |
| Sector: Technology | |
| SubSector: Semiconductor Equipment & Materials | |
| MarketCap: 18273.8 Millions | |
| Recent Price: 530.59 Smart Investing & Trading Score: 38 | |
| Day Percent Change: -2.60% Day Change: -14.17 | |
| Week Change: -2.4% Year-to-date Change: 3.1% | |
| SNPS Links: Profile News Message Board | |
| Charts:- Daily , Weekly | |
| Add SNPS to Watchlist: View: Get Complete SNPS Trend Analysis ➞ | |
| For tabular summary view of above stock list: Summary View ➞ 0 - 25 , 25 - 50 , 50 - 75 , 75 - 100 , 100 - 125 , 125 - 150 , 150 - 175 , 175 - 200 , 200 - 225 , 225 - 250 , 250 - 275 , 275 - 300 , 300 - 325 , 325 - 350 , 350 - 375 , 375 - 400 , 400 - 425 , 425 - 450 , 450 - 475 , 475 - 500 , 500 - 525 , 525 - 550 , 550 - 575 , 575 - 600 , 600 - 625 , 625 - 650 | ||
| Click To Change The Sort Order: By Market Cap or Company Size Performance: Year-to-date, Week and Day | |
| Select Chart Type: | ||
|
Best Stocks Today 12Stocks.com |
© 2024 12Stocks.com Terms & Conditions Privacy Contact Us
All Information Provided Only For Education And Not To Be Used For Investing or Trading. See Terms & Conditions


One More Thing ... Get Best Stocks Delivered Daily!
Never Ever Miss A Move With Our Top Ten Stocks Lists
Find Best Stocks In Any Market - Bull or Bear Market
Take A Peek At Our Top Ten Stocks Lists: Daily, Weekly, Year-to-Date & Top Trends
Find Best Stocks In Any Market - Bull or Bear Market
Take A Peek At Our Top Ten Stocks Lists: Daily, Weekly, Year-to-Date & Top Trends
Technology Stocks With Best Up Trends [0-bearish to 100-bullish]: Mitcham Industries[100], Universal Electronics[100], Sensata [100], Leidos [100], Corning [100], Zebra [100], NXP Semiconductors[100], Commvault Systems[100], ACI Worldwide[100], Arlo [100], Rumble [100]
Best Technology Stocks Year-to-Date:
MediaCo Holding[313.15%], Super Micro[202.12%], Bakkt [200.9%], Smith Micro[179.66%], Uxin [163.91%], CXApp [159.46%], NextNav [104.72%], SoundHound AI[98.36%], CuriosityStream [96.26%], MediaAlpha [82.1%], AppLovin [77.26%] Best Technology Stocks This Week:
Bakkt [1578.76%], Mitcham Industries[27.89%], Koninklijke Philips[26.01%], Phoenix New[22.29%], Harmonic [16.74%], Viomi [16.39%], Quantum [13.45%], Universal Electronics[10.36%], Velo3D [10.3%], Perficient [9.93%], Sensata [9.52%] Best Technology Stocks Daily:
Mitcham Industries[25.22%], Harmonic [14.26%], Blend Labs[8.89%], Perficient [8.74%], Brightcove [8.54%], Universal Electronics[7.83%], MediaAlpha [7.77%], Sensata [7.13%], Leidos [6.53%], QuinStreet [5.52%], OneConnect Financial[5.18%]