
 Login Sign Up


| |||||
 |  | ||||

| 12Stocks.com Market Intelligence |
Best Tech Stocks
| In a hurry? Tech Stocks Lists: Performance & Trends, Stock Charts, FANG Stocks
Sort Tech stocks: Daily, Weekly, Year-to-Date, Market Cap & Trends. Filter Tech stocks list by size:All Tech Large Mid-Range Small and MicroCap |
| 12Stocks.com Tech Stocks Performances & Trends Daily | |||||||||
|
|  The overall Smart Investing & Trading Score is 49 (0-bearish to 100-bullish) which puts Technology sector in short term neutral trend. The Smart Investing & Trading Score from previous trading session is 10 and hence an improvement of trend.
| ||||||||
Here are the Smart Investing & Trading Scores of the most requested Technology stocks at 12Stocks.com (click stock name for detailed review):
|


| 12Stocks.com: Investing in Technology sector with Stocks | |
|
The following table helps investors and traders sort through current performance and trends (as measured by Smart Investing & Trading Score) of various
stocks in the Tech sector. Quick View: Move mouse or cursor over stock symbol (ticker) to view short-term technical chart and over stock name to view long term chart. Click on  to add stock symbol to your watchlist and to add stock symbol to your watchlist and  to view watchlist. Click on any ticker or stock name for detailed market intelligence report for that stock. to view watchlist. Click on any ticker or stock name for detailed market intelligence report for that stock. |
12Stocks.com Performance of Stocks in Tech Sector
| Ticker | Stock Name | Watchlist | Category | Recent Price | Smart Investing & Trading Score | Change % | YTD Change% |
| TUYA | Tuya |   | Software - Infrastructure | 1.82 | 69 | 1.96% | -20.70% |
| EVCM | EverCommerce | | Software - Infrastructure | 9.49 | 69 | 1.93% | -14.70% |
| VRNT | Verint Systems | | Software | 31.25 | 69 | 1.53% | 15.61% |
| ALGM | Allegro MicroSystems | | Semiconductors | 30.00 | 69 | 1.33% | -0.97% |
| XPER | Xperi | | Semiconductor | 10.77 | 69 | 1.13% | -2.27% |
| MOMO | Momo | | Internet | 6.19 | 69 | 0.98% | -10.94% |
| VPG | Vishay Precision | | Instruments | 34.06 | 69 | 0.77% | -0.03% |
| HSTM | HealthStream | | Healthcare Information | 27.03 | 69 | 0.07% | 0.00% |
| TU | TELUS | | Wireless | 16.38 | 69 | 0.06% | -7.93% |
| TCX | Tucows | | Internet | 18.33 | 69 | -2.34% | -32.11% |
| MPWR | Monolithic Power | | Semiconductor | 707.22 | 69 | -0.80% | 12.12% |
| UPWK | Upwork | | Internet | 12.89 | 69 | -0.77% | -13.32% |
| SNPO | Snap One | | Electronics & Computer Distribution | 10.59 | 69 | -0.09% | 13.99% |
| KARO | Karooooo | | Software - | 28.87 | 68 | 1.19% | 16.65% |
| MDIA | MediaCo Holding | | Broadcasting | 2.13 | 68 | 0.95% | 400.00% |
| UCL | uCloudlink | | Telecom | 1.52 | 68 | 0.00% | -17.57% |
| IRDM | Iridium | | Communication | 30.32 | 68 | -2.13% | -26.34% |
| SIMO | Silicon Motion | | Electronics | 73.95 | 68 | 0.76% | 20.70% |
| TGAN | Transphorm | | Semiconductor | 4.87 | 68 | 0.10% | 32.74% |
| VOD | Vodafone | | Wireless | 8.62 | 67 | 1.17% | -0.92% |
| TIGR | UP Fintech | | Software | 3.92 | 67 | -2.49% | -11.31% |
| CCI | Crown Castle | | Communication | 97.39 | 67 | 0.99% | -15.45% |
| CRSR | Corsair Gaming | | Computer Hardware | 11.62 | 67 | 0.30% | -17.68% |
| G | Genpact | | IT | 31.34 | 67 | 0.10% | -9.71% |
| HIVE | Aerohive Networks | | Communication | 2.44 | 66 | -2.01% | -46.14% |
| For chart view version of above stock list: Chart View ➞ 0 - 25 , 25 - 50 , 50 - 75 , 75 - 100 , 100 - 125 , 125 - 150 , 150 - 175 , 175 - 200 , 200 - 225 , 225 - 250 , 250 - 275 , 275 - 300 , 300 - 325 , 325 - 350 , 350 - 375 , 375 - 400 , 400 - 425 , 425 - 450 , 450 - 475 , 475 - 500 , 500 - 525 , 525 - 550 , 550 - 575 , 575 - 600 , 600 - 625 , 625 - 650 | ||
 | Click To Change The Sort Order: By Market Cap or Company Size Performance: Year-to-date, Week and Day |  |
|
Get the most comprehensive stock market coverage daily at 12Stocks.com ➞ Best Stocks Today ➞ Best Stocks Weekly ➞ Best Stocks Year-to-Date ➞ Best Stocks Trends ➞  Best Stocks Today 12Stocks.com Best Nasdaq Stocks ➞ Best S&P 500 Stocks ➞ Best Tech Stocks ➞ Best Biotech Stocks ➞ |
| Detailed Overview of Tech Stocks |
| Tech Technical Overview, Leaders & Laggards, Top Tech ETF Funds & Detailed Tech Stocks List, Charts, Trends & More |
| Tech Sector: Technical Analysis, Trends & YTD Performance | |
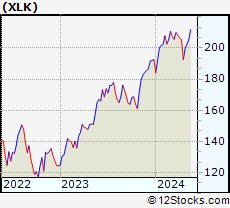
| Technology sector is composed of stocks
from semiconductors, software, web, social media
and services subsectors. Technology sector, as represented by XLK, an exchange-traded fund [ETF] that holds basket of tech stocks (e.g, Intel, Google) is up by 5.23% and is currently underperforming the overall market by -1.65% year-to-date. Below is a quick view of technical charts and trends: |
|
 XLK Weekly Chart |
|
| Long Term Trend: Not Good | |
| Medium Term Trend: Deteriorating | |
 XLK Daily Chart |
|
| Short Term Trend: Very Good | |
| Overall Trend Score: 49 | |
| YTD Performance: 5.23% | |
| **Trend Scores & Views Are Only For Educational Purposes And Not For Investing | |
| 12Stocks.com: Top Performing Technology Sector Stocks | ||||||||||||||||||||||||||||||||||||||||||||||||
 The top performing Technology sector stocks year to date are
Now, more recently, over last week, the top performing Technology sector stocks on the move are


|
||||||||||||||||||||||||||||||||||||||||||||||||
| 12Stocks.com: Investing in Tech Sector using Exchange Traded Funds | |
|
The following table shows list of key exchange traded funds (ETF) that
help investors track Tech Index. For detailed view, check out our ETF Funds section of our website. Quick View: Move mouse or cursor over ETF symbol (ticker) to view short-term technical chart and over ETF name to view long term chart. Click on ticker or stock name for detailed view. Click on to add stock symbol to your watchlist and to view watchlist. |
12Stocks.com List of ETFs that track Tech Index
| Ticker | ETF Name | Watchlist | Recent Price | Smart Investing & Trading Score | Change % | Week % | Year-to-date % |
| XLK | Technology | | 202.55 | 49 | 2.79 | 1.36 | 5.23% |
| QQQ | QQQ | | 435.48 | 57 | 2.01 | 1.04 | 6.34% |
| IYW | Technology | | 132.17 | 62 | 2.45 | 0.93 | 7.67% |
| VGT | Information Technology | | 509.46 | 49 | 2.70 | 1.1 | 5.26% |
| IXN | Global Tech | | 72.86 | 62 | 2.82 | 1.48 | 6.86% |
| IGV | Tech-Software | | 80.87 | 42 | 1.20 | -0.27 | -0.32% |
| XSD | Semiconductor | | 226.11 | 88 | 2.25 | 0.63 | 0.59% |
| TQQQ | QQQ | | 56.70 | 49 | 5.92 | 2.57 | 11.83% |
| SQQQ | Short QQQ | | 11.08 | 51 | -5.94 | -3.06 | -17.62% |
| SOXL | Semicondct Bull 3X | | 38.97 | 39 | 6.91 | -1.96 | 24.11% |
| SOXS | Semicondct Bear 3X | | 35.12 | 51 | -6.60 | 0.06 | 503.44% |
| SOXX | PHLX Semiconductor | | 216.17 | 52 | 2.25 | -0.34 | 12.57% |
| QTEC | First -100-Tech | | 182.75 | 42 | 1.45 | -0.67 | 4.15% |
| SMH | Semiconductor | | 217.73 | 65 | 2.69 | 0.04 | 24.51% |
| 12Stocks.com: Charts, Trends, Fundamental Data and Performances of Tech Stocks | |
|
We now take in-depth look at all Tech stocks including charts, multi-period performances and overall trends (as measured by Smart Investing & Trading Score). One can sort Tech stocks (click link to choose) by Daily, Weekly and by Year-to-Date performances. Also, one can sort by size of the company or by market capitalization. |
| Select Your Default Chart Type: | |||||
| |||||
| Click on stock symbol or name for detailed view. Click on to add stock symbol to your watchlist and to view watchlist. Quick View: Move mouse or cursor over "Daily" to quickly view daily technical stock chart and over "Weekly" to view weekly technical stock chart. | |||||


 | TUYA Tuya Inc. |
| Sector: Technology | |
| SubSector: Software - Infrastructure | |
| MarketCap: 1050 Millions | |
| Recent Price: 1.82 Smart Investing & Trading Score: 69 | |
| Day Percent Change: 1.96% Day Change: 0.04 | |
| Week Change: 4.6% Year-to-date Change: -20.7% | |
| TUYA Links: Profile News Message Board | |
| Charts:- Daily , Weekly | |
| Add TUYA to Watchlist: View: Get Complete TUYA Trend Analysis ➞ | |
 | EVCM EverCommerce Inc. |
| Sector: Technology | |
| SubSector: Software - Infrastructure | |
| MarketCap: 2210 Millions | |
| Recent Price: 9.49 Smart Investing & Trading Score: 69 | |
| Day Percent Change: 1.93% Day Change: 0.18 | |
| Week Change: 3.26% Year-to-date Change: -14.7% | |
| EVCM Links: Profile News Message Board | |
| Charts:- Daily , Weekly | |
| Add EVCM to Watchlist: View: Get Complete EVCM Trend Analysis ➞ | |
 | VRNT Verint Systems Inc. |
| Sector: Technology | |
| SubSector: Business Software & Services | |
| MarketCap: 2902.18 Millions | |
| Recent Price: 31.25 Smart Investing & Trading Score: 69 | |
| Day Percent Change: 1.53% Day Change: 0.47 | |
| Week Change: 1.03% Year-to-date Change: 15.6% | |
| VRNT Links: Profile News Message Board | |
| Charts:- Daily , Weekly | |
| Add VRNT to Watchlist: View: Get Complete VRNT Trend Analysis ➞ | |
 | ALGM Allegro MicroSystems, Inc. |
| Sector: Technology | |
| SubSector: Semiconductors | |
| MarketCap: 50287 Millions | |
| Recent Price: 30.00 Smart Investing & Trading Score: 69 | |
| Day Percent Change: 1.33% Day Change: 0.39 | |
| Week Change: -0.35% Year-to-date Change: -1.0% | |
| ALGM Links: Profile News Message Board | |
| Charts:- Daily , Weekly | |
| Add ALGM to Watchlist: View: Get Complete ALGM Trend Analysis ➞ | |
 | XPER Xperi Corporation |
| Sector: Technology | |
| SubSector: Semiconductor Equipment & Materials | |
| MarketCap: 631.618 Millions | |
| Recent Price: 10.77 Smart Investing & Trading Score: 69 | |
| Day Percent Change: 1.13% Day Change: 0.12 | |
| Week Change: 8.24% Year-to-date Change: -2.3% | |
| XPER Links: Profile News Message Board | |
| Charts:- Daily , Weekly | |
| Add XPER to Watchlist: View: Get Complete XPER Trend Analysis ➞ | |
 | MOMO Momo Inc. |
| Sector: Technology | |
| SubSector: Internet Software & Services | |
| MarketCap: 4796.71 Millions | |
| Recent Price: 6.19 Smart Investing & Trading Score: 69 | |
| Day Percent Change: 0.98% Day Change: 0.06 | |
| Week Change: 6.17% Year-to-date Change: -10.9% | |
| MOMO Links: Profile News Message Board | |
| Charts:- Daily , Weekly | |
| Add MOMO to Watchlist: View: Get Complete MOMO Trend Analysis ➞ | |
 | VPG Vishay Precision Group, Inc. |
| Sector: Technology | |
| SubSector: Scientific & Technical Instruments | |
| MarketCap: 261.553 Millions | |
| Recent Price: 34.06 Smart Investing & Trading Score: 69 | |
| Day Percent Change: 0.77% Day Change: 0.26 | |
| Week Change: 1.95% Year-to-date Change: 0.0% | |
| VPG Links: Profile News Message Board | |
| Charts:- Daily , Weekly | |
| Add VPG to Watchlist: View: Get Complete VPG Trend Analysis ➞ | |
 | HSTM HealthStream, Inc. |
| Sector: Technology | |
| SubSector: Healthcare Information Services | |
| MarketCap: 770.255 Millions | |
| Recent Price: 27.03 Smart Investing & Trading Score: 69 | |
| Day Percent Change: 0.07% Day Change: 0.02 | |
| Week Change: 5.54% Year-to-date Change: 0.0% | |
| HSTM Links: Profile News Message Board | |
| Charts:- Daily , Weekly | |
| Add HSTM to Watchlist: View: Get Complete HSTM Trend Analysis ➞ | |
 | TU TELUS Corporation |
| Sector: Technology | |
| SubSector: Wireless Communications | |
| MarketCap: 10864.7 Millions | |
| Recent Price: 16.38 Smart Investing & Trading Score: 69 | |
| Day Percent Change: 0.06% Day Change: 0.01 | |
| Week Change: 1.93% Year-to-date Change: -7.9% | |
| TU Links: Profile News Message Board | |
| Charts:- Daily , Weekly | |
| Add TU to Watchlist: View: Get Complete TU Trend Analysis ➞ | |
 | TCX Tucows Inc. |
| Sector: Technology | |
| SubSector: Internet Information Providers | |
| MarketCap: 557.78 Millions | |
| Recent Price: 18.33 Smart Investing & Trading Score: 69 | |
| Day Percent Change: -2.34% Day Change: -0.44 | |
| Week Change: 2.12% Year-to-date Change: -32.1% | |
| TCX Links: Profile News Message Board | |
| Charts:- Daily , Weekly | |
| Add TCX to Watchlist: View: Get Complete TCX Trend Analysis ➞ | |
 | MPWR Monolithic Power Systems, Inc. |
| Sector: Technology | |
| SubSector: Semiconductor - Specialized | |
| MarketCap: 6436.4 Millions | |
| Recent Price: 707.22 Smart Investing & Trading Score: 69 | |
| Day Percent Change: -0.80% Day Change: -5.67 | |
| Week Change: 4.43% Year-to-date Change: 12.1% | |
| MPWR Links: Profile News Message Board | |
| Charts:- Daily , Weekly | |
| Add MPWR to Watchlist: View: Get Complete MPWR Trend Analysis ➞ | |
 | UPWK Upwork Inc. |
| Sector: Technology | |
| SubSector: Internet Information Providers | |
| MarketCap: 815.98 Millions | |
| Recent Price: 12.89 Smart Investing & Trading Score: 69 | |
| Day Percent Change: -0.77% Day Change: -0.10 | |
| Week Change: 11.51% Year-to-date Change: -13.3% | |
| UPWK Links: Profile News Message Board | |
| Charts:- Daily , Weekly | |
| Add UPWK to Watchlist: View: Get Complete UPWK Trend Analysis ➞ | |
 | SNPO Snap One Holdings Corp. |
| Sector: Technology | |
| SubSector: Electronics & Computer Distribution | |
| MarketCap: 807 Millions | |
| Recent Price: 10.59 Smart Investing & Trading Score: 69 | |
| Day Percent Change: -0.09% Day Change: -0.01 | |
| Week Change: 0.09% Year-to-date Change: 14.0% | |
| SNPO Links: Profile News Message Board | |
| Charts:- Daily , Weekly | |
| Add SNPO to Watchlist: View: Get Complete SNPO Trend Analysis ➞ | |
 | KARO Karooooo Ltd. |
| Sector: Technology | |
| SubSector: Software - Application | |
| MarketCap: 728 Millions | |
| Recent Price: 28.87 Smart Investing & Trading Score: 68 | |
| Day Percent Change: 1.19% Day Change: 0.34 | |
| Week Change: -3.77% Year-to-date Change: 16.7% | |
| KARO Links: Profile News Message Board | |
| Charts:- Daily , Weekly | |
| Add KARO to Watchlist: View: Get Complete KARO Trend Analysis ➞ | |
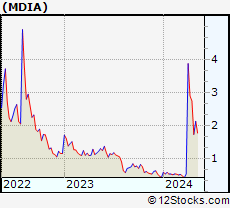 | MDIA MediaCo Holding Inc. |
| Sector: Technology | |
| SubSector: Broadcasting | |
| MarketCap: 16837 Millions | |
| Recent Price: 2.13 Smart Investing & Trading Score: 68 | |
| Day Percent Change: 0.95% Day Change: 0.02 | |
| Week Change: 23.12% Year-to-date Change: 400.0% | |
| MDIA Links: Profile News Message Board | |
| Charts:- Daily , Weekly | |
| Add MDIA to Watchlist: View: Get Complete MDIA Trend Analysis ➞ | |
 | UCL uCloudlink Group Inc. |
| Sector: Technology | |
| SubSector: Telecom Services | |
| MarketCap: 35837 Millions | |
| Recent Price: 1.52 Smart Investing & Trading Score: 68 | |
| Day Percent Change: 0.00% Day Change: 0.00 | |
| Week Change: 11.31% Year-to-date Change: -17.6% | |
| UCL Links: Profile News Message Board | |
| Charts:- Daily , Weekly | |
| Add UCL to Watchlist: View: Get Complete UCL Trend Analysis ➞ | |
 | IRDM Iridium Communications Inc. |
| Sector: Technology | |
| SubSector: Diversified Communication Services | |
| MarketCap: 2711.24 Millions | |
| Recent Price: 30.32 Smart Investing & Trading Score: 68 | |
| Day Percent Change: -2.13% Day Change: -0.66 | |
| Week Change: -3.35% Year-to-date Change: -26.3% | |
| IRDM Links: Profile News Message Board | |
| Charts:- Daily , Weekly | |
| Add IRDM to Watchlist: View: Get Complete IRDM Trend Analysis ➞ | |
 | SIMO Silicon Motion Technology Corporation |
| Sector: Technology | |
| SubSector: Diversified Electronics | |
| MarketCap: 1186.66 Millions | |
| Recent Price: 73.95 Smart Investing & Trading Score: 68 | |
| Day Percent Change: 0.76% Day Change: 0.55 | |
| Week Change: 0.82% Year-to-date Change: 20.7% | |
| SIMO Links: Profile News Message Board | |
| Charts:- Daily , Weekly | |
| Add SIMO to Watchlist: View: Get Complete SIMO Trend Analysis ➞ | |
 | TGAN Transphorm, Inc. |
| Sector: Technology | |
| SubSector: Semiconductor Equipment & Materials | |
| MarketCap: 194 Millions | |
| Recent Price: 4.87 Smart Investing & Trading Score: 68 | |
| Day Percent Change: 0.10% Day Change: 0.00 | |
| Week Change: 0.1% Year-to-date Change: 32.7% | |
| TGAN Links: Profile News Message Board | |
| Charts:- Daily , Weekly | |
| Add TGAN to Watchlist: View: Get Complete TGAN Trend Analysis ➞ | |
 | VOD Vodafone Group Plc |
| Sector: Technology | |
| SubSector: Wireless Communications | |
| MarketCap: 38154.7 Millions | |
| Recent Price: 8.62 Smart Investing & Trading Score: 67 | |
| Day Percent Change: 1.17% Day Change: 0.10 | |
| Week Change: 0% Year-to-date Change: -0.9% | |
| VOD Links: Profile News Message Board | |
| Charts:- Daily , Weekly | |
| Add VOD to Watchlist: View: Get Complete VOD Trend Analysis ➞ | |
 | TIGR UP Fintech Holding Limited |
| Sector: Technology | |
| SubSector: Application Software | |
| MarketCap: 385.062 Millions | |
| Recent Price: 3.92 Smart Investing & Trading Score: 67 | |
| Day Percent Change: -2.49% Day Change: -0.10 | |
| Week Change: 10.42% Year-to-date Change: -11.3% | |
| TIGR Links: Profile News Message Board | |
| Charts:- Daily , Weekly | |
| Add TIGR to Watchlist: View: Get Complete TIGR Trend Analysis ➞ | |
 | CCI Crown Castle International Corp. (REIT) |
| Sector: Technology | |
| SubSector: Diversified Communication Services | |
| MarketCap: 57615.4 Millions | |
| Recent Price: 97.39 Smart Investing & Trading Score: 67 | |
| Day Percent Change: 0.99% Day Change: 0.95 | |
| Week Change: 4.07% Year-to-date Change: -15.5% | |
| CCI Links: Profile News Message Board | |
| Charts:- Daily , Weekly | |
| Add CCI to Watchlist: View: Get Complete CCI Trend Analysis ➞ | |
 | CRSR Corsair Gaming, Inc. |
| Sector: Technology | |
| SubSector: Computer Hardware | |
| MarketCap: 32187 Millions | |
| Recent Price: 11.62 Smart Investing & Trading Score: 67 | |
| Day Percent Change: 0.30% Day Change: 0.04 | |
| Week Change: 2.79% Year-to-date Change: -17.7% | |
| CRSR Links: Profile News Message Board | |
| Charts:- Daily , Weekly | |
| Add CRSR to Watchlist: View: Get Complete CRSR Trend Analysis ➞ | |
 | G Genpact Limited |
| Sector: Technology | |
| SubSector: Information Technology Services | |
| MarketCap: 5485.78 Millions | |
| Recent Price: 31.34 Smart Investing & Trading Score: 67 | |
| Day Percent Change: 0.10% Day Change: 0.03 | |
| Week Change: 1.42% Year-to-date Change: -9.7% | |
| G Links: Profile News Message Board | |
| Charts:- Daily , Weekly | |
| Add G to Watchlist: View: Get Complete G Trend Analysis ➞ | |
 | HIVE Aerohive Networks, Inc. |
| Sector: Technology | |
| SubSector: Communication Equipment | |
| MarketCap: 225.85 Millions | |
| Recent Price: 2.44 Smart Investing & Trading Score: 66 | |
| Day Percent Change: -2.01% Day Change: -0.05 | |
| Week Change: -20% Year-to-date Change: -46.1% | |
| HIVE Links: Profile News Message Board | |
| Charts:- Daily , Weekly | |
| Add HIVE to Watchlist: View: Get Complete HIVE Trend Analysis ➞ | |
| For tabular summary view of above stock list: Summary View ➞ 0 - 25 , 25 - 50 , 50 - 75 , 75 - 100 , 100 - 125 , 125 - 150 , 150 - 175 , 175 - 200 , 200 - 225 , 225 - 250 , 250 - 275 , 275 - 300 , 300 - 325 , 325 - 350 , 350 - 375 , 375 - 400 , 400 - 425 , 425 - 450 , 450 - 475 , 475 - 500 , 500 - 525 , 525 - 550 , 550 - 575 , 575 - 600 , 600 - 625 , 625 - 650 | ||
| Click To Change The Sort Order: By Market Cap or Company Size Performance: Year-to-date, Week and Day | |
| Select Chart Type: | ||
|
Best Stocks Today 12Stocks.com |
© 2024 12Stocks.com Terms & Conditions Privacy Contact Us
All Information Provided Only For Education And Not To Be Used For Investing or Trading. See Terms & Conditions


One More Thing ... Get Best Stocks Delivered Daily!
Never Ever Miss A Move With Our Top Ten Stocks Lists
Find Best Stocks In Any Market - Bull or Bear Market
Take A Peek At Our Top Ten Stocks Lists: Daily, Weekly, Year-to-Date & Top Trends
Find Best Stocks In Any Market - Bull or Bear Market
Take A Peek At Our Top Ten Stocks Lists: Daily, Weekly, Year-to-Date & Top Trends
Technology Stocks With Best Up Trends [0-bearish to 100-bullish]: WideOpenWest [100], FTC Solar[100], Clearfield [100], OneSpan [100], Itron [100], Cardlytics [100], First Solar[100], Apple [100], Cricut [100], Motorola [100], Conduent [100]
Best Technology Stocks Year-to-Date:
MicroCloud Hologram[553.24%], MediaCo Holding[400%], Bakkt [199.55%], Uxin [188.16%], Smith Micro[183.29%], Super Micro[175.35%], CXApp [157.92%], CuriosityStream [109.22%], SoundHound AI[103.27%], NextNav [100.67%], MediaAlpha [99.64%] Best Technology Stocks This Week:
Bakkt [1571.25%], Luna Innovations[53.77%], SYLA [48.97%], 2U [41.49%], WideOpenWest [40.06%], FTC Solar[32.15%], Mitcham Industries[31.57%], Koninklijke Philips[27.29%], Conduent [26.47%], Cogint [25.08%], AXT [23.23%] Best Technology Stocks Daily:
Luna Innovations[36.00%], WideOpenWest [28.23%], Upland Software[28.22%], 2U [26.63%], FTC Solar[25.09%], Arteris [21.36%], AXT [20.79%], Aurora Innovation[18.09%], Clearfield [13.22%], OneSpan [13.15%], Paylocity Holding[12.05%]