
 Login Sign Up


| |||||
 |  | ||||

| 12Stocks.com Market Intelligence |
Best Tech Stocks
| In a hurry? Tech Stocks Lists: Performance & Trends, Stock Charts, FANG Stocks
Sort Tech stocks: Daily, Weekly, Year-to-Date, Market Cap & Trends. Filter Tech stocks list by size:All Tech Large Mid-Range Small and MicroCap |
| 12Stocks.com Tech Stocks Performances & Trends Daily | |||||||||
|
|  The overall Smart Investing & Trading Score is 49 (0-bearish to 100-bullish) which puts Technology sector in short term neutral trend. The Smart Investing & Trading Score from previous trading session is 10 and hence an improvement of trend.
| ||||||||
Here are the Smart Investing & Trading Scores of the most requested Technology stocks at 12Stocks.com (click stock name for detailed review):
|


| 12Stocks.com: Investing in Technology sector with Stocks | |
|
The following table helps investors and traders sort through current performance and trends (as measured by Smart Investing & Trading Score) of various
stocks in the Tech sector. Quick View: Move mouse or cursor over stock symbol (ticker) to view short-term technical chart and over stock name to view long term chart. Click on  to add stock symbol to your watchlist and to add stock symbol to your watchlist and  to view watchlist. Click on any ticker or stock name for detailed market intelligence report for that stock. to view watchlist. Click on any ticker or stock name for detailed market intelligence report for that stock. |
12Stocks.com Performance of Stocks in Tech Sector
| Ticker | Stock Name | Watchlist | Category | Recent Price | Smart Investing & Trading Score | Change % | YTD Change% |
| HURC | Hurco |   | Instruments | 18.17 | 35 | 2.08% | -15.61% |
| TLK | Perusahaan Perseroan | | Communication | 19.44 | 35 | 0.47% | -24.53% |
| FORTY | Formula Systems | | IT | 75.00 | 35 | 0.00% | 14.84% |
| SOUN | SoundHound AI | | Software - | 4.35 | 35 | -4.71% | 103.27% |
| CGNT | Cognyte Software | | Software - Infrastructure | 7.28 | 34 | 4.00% | 13.22% |
| CLBT | Cellebrite DI | | Software - Infrastructure | 10.80 | 34 | 0.65% | 25.58% |
| IMMR | Immersion | | Software | 7.23 | 34 | -0.41% | 2.41% |
| ALTR | Altair Engineering | | Semiconductor | 81.40 | 33 | -0.43% | -3.27% |
| SQNS | Sequans | | Semiconductor | 0.55 | 32 | 7.16% | -80.69% |
| ASML | ASML Holding | | Semiconductor | 901.01 | 32 | 3.53% | 19.04% |
| RMBS | Rambus | | Semiconductor- | 56.10 | 32 | 3.41% | -17.80% |
| NOW | ServiceNow | | IT | 716.65 | 32 | 3.01% | 1.44% |
| ATNI | ATN | | Telecom | 21.64 | 32 | 2.90% | -44.47% |
| ADSK | Autodesk | | Software | 215.20 | 32 | 2.50% | -11.61% |
| META | Meta Platforms | | Internet Content & Information | 452.20 | 32 | 2.34% | 27.74% |
| IT | Gartner | | IT | 428.64 | 32 | 2.29% | -4.98% |
| MSFT | Microsoft | | Software | 406.75 | 32 | 2.24% | 8.17% |
| CDNS | Cadence Design | | Software | 281.65 | 32 | 1.89% | 3.41% |
| HUBB | Hubbell | | Electronics | 379.89 | 32 | 1.86% | 15.49% |
| TEL | TE Connectivity | | Electronics | 142.00 | 32 | 1.42% | 1.07% |
| SNCR | Synchronoss | | Software | 6.54 | 32 | 1.40% | 5.31% |
| SLAB | Silicon | | Semiconductor | 122.50 | 32 | 1.22% | -7.39% |
| INTC | Intel | | Semiconductor | 30.89 | 32 | 1.20% | -38.54% |
| CHKP | Check Point | | Security Software | 151.09 | 32 | 1.08% | -1.11% |
| MORN | Morningstar | | IT | 293.99 | 32 | 1.03% | 2.71% |
| For chart view version of above stock list: Chart View ➞ 0 - 25 , 25 - 50 , 50 - 75 , 75 - 100 , 100 - 125 , 125 - 150 , 150 - 175 , 175 - 200 , 200 - 225 , 225 - 250 , 250 - 275 , 275 - 300 , 300 - 325 , 325 - 350 , 350 - 375 , 375 - 400 , 400 - 425 , 425 - 450 , 450 - 475 , 475 - 500 , 500 - 525 , 525 - 550 , 550 - 575 , 575 - 600 , 600 - 625 , 625 - 650 | ||
 | Click To Change The Sort Order: By Market Cap or Company Size Performance: Year-to-date, Week and Day |  |
|
Get the most comprehensive stock market coverage daily at 12Stocks.com ➞ Best Stocks Today ➞ Best Stocks Weekly ➞ Best Stocks Year-to-Date ➞ Best Stocks Trends ➞  Best Stocks Today 12Stocks.com Best Nasdaq Stocks ➞ Best S&P 500 Stocks ➞ Best Tech Stocks ➞ Best Biotech Stocks ➞ |
| Detailed Overview of Tech Stocks |
| Tech Technical Overview, Leaders & Laggards, Top Tech ETF Funds & Detailed Tech Stocks List, Charts, Trends & More |
| Tech Sector: Technical Analysis, Trends & YTD Performance | |
| Technology sector is composed of stocks
from semiconductors, software, web, social media
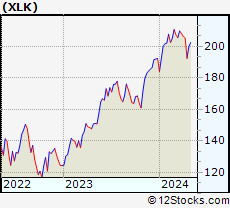
and services subsectors. Technology sector, as represented by XLK, an exchange-traded fund [ETF] that holds basket of tech stocks (e.g, Intel, Google) is up by 5.23% and is currently underperforming the overall market by -1.65% year-to-date. Below is a quick view of technical charts and trends: |
|
 XLK Weekly Chart |
|
| Long Term Trend: Not Good | |
| Medium Term Trend: Deteriorating | |
 XLK Daily Chart |
|
| Short Term Trend: Very Good | |
| Overall Trend Score: 49 | |
| YTD Performance: 5.23% | |
| **Trend Scores & Views Are Only For Educational Purposes And Not For Investing | |
| 12Stocks.com: Top Performing Technology Sector Stocks | ||||||||||||||||||||||||||||||||||||||||||||||||
 The top performing Technology sector stocks year to date are
Now, more recently, over last week, the top performing Technology sector stocks on the move are


|
||||||||||||||||||||||||||||||||||||||||||||||||
| 12Stocks.com: Investing in Tech Sector using Exchange Traded Funds | |
|
The following table shows list of key exchange traded funds (ETF) that
help investors track Tech Index. For detailed view, check out our ETF Funds section of our website. Quick View: Move mouse or cursor over ETF symbol (ticker) to view short-term technical chart and over ETF name to view long term chart. Click on ticker or stock name for detailed view. Click on to add stock symbol to your watchlist and to view watchlist. |
12Stocks.com List of ETFs that track Tech Index
| Ticker | ETF Name | Watchlist | Recent Price | Smart Investing & Trading Score | Change % | Week % | Year-to-date % |
| XLK | Technology | | 202.55 | 49 | 2.79 | 1.36 | 5.23% |
| QQQ | QQQ | | 435.41 | 57 | 1.99 | 1.02 | 6.32% |
| IYW | Technology | | 132.17 | 24 | 2.45 | 0.93 | 7.67% |
| VGT | Information Technology | | 509.46 | 24 | 2.70 | 1.1 | 5.26% |
| IXN | Global Tech | | 72.86 | 24 | 2.82 | 1.48 | 6.86% |
| IGV | Tech-Software | | 80.87 | 17 | 1.20 | -0.27 | -0.32% |
| XSD | Semiconductor | | 226.11 | 55 | 2.25 | 0.63 | 0.59% |
| TQQQ | QQQ | | 56.71 | 49 | 5.94 | 2.59 | 11.85% |
| SQQQ | Short QQQ | | 11.07 | 38 | -5.98 | -3.11 | -17.66% |
| SOXL | Semicondct Bull 3X | | 38.97 | 39 | 6.91 | -1.96 | 24.11% |
| SOXS | Semicondct Bear 3X | | 35.12 | 51 | -6.60 | 0.06 | 503.44% |
| SOXX | PHLX Semiconductor | | 216.20 | 19 | 2.27 | -0.32 | 12.58% |
| QTEC | First -100-Tech | | 182.59 | 17 | 1.36 | -0.76 | 4.06% |
| SMH | Semiconductor | | 217.70 | 65 | 2.67 | 0.03 | 24.49% |
| 12Stocks.com: Charts, Trends, Fundamental Data and Performances of Tech Stocks | |
|
We now take in-depth look at all Tech stocks including charts, multi-period performances and overall trends (as measured by Smart Investing & Trading Score). One can sort Tech stocks (click link to choose) by Daily, Weekly and by Year-to-Date performances. Also, one can sort by size of the company or by market capitalization. |
| Select Your Default Chart Type: | |||||
| |||||
| Click on stock symbol or name for detailed view. Click on to add stock symbol to your watchlist and to view watchlist. Quick View: Move mouse or cursor over "Daily" to quickly view daily technical stock chart and over "Weekly" to view weekly technical stock chart. | |||||


 | HURC Hurco Companies, Inc. |
| Sector: Technology | |
| SubSector: Scientific & Technical Instruments | |
| MarketCap: 169.253 Millions | |
| Recent Price: 18.17 Smart Investing & Trading Score: 35 | |
| Day Percent Change: 2.08% Day Change: 0.37 | |
| Week Change: -1.62% Year-to-date Change: -15.6% | |
| HURC Links: Profile News Message Board | |
| Charts:- Daily , Weekly | |
| Add HURC to Watchlist: View: Get Complete HURC Trend Analysis ➞ | |
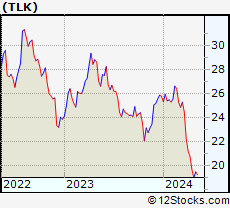 | TLK Perusahaan Perseroan (Persero) PT Telekomunikasi Indonesia Tbk |
| Sector: Technology | |
| SubSector: Diversified Communication Services | |
| MarketCap: 18988.4 Millions | |
| Recent Price: 19.44 Smart Investing & Trading Score: 35 | |
| Day Percent Change: 0.47% Day Change: 0.09 | |
| Week Change: 2.37% Year-to-date Change: -24.5% | |
| TLK Links: Profile News Message Board | |
| Charts:- Daily , Weekly | |
| Add TLK to Watchlist: View: Get Complete TLK Trend Analysis ➞ | |
 | FORTY Formula Systems (1985) Ltd. |
| Sector: Technology | |
| SubSector: Information Technology Services | |
| MarketCap: 735.768 Millions | |
| Recent Price: 75.00 Smart Investing & Trading Score: 35 | |
| Day Percent Change: 0.00% Day Change: 0.00 | |
| Week Change: 0.27% Year-to-date Change: 14.8% | |
| FORTY Links: Profile News Message Board | |
| Charts:- Daily , Weekly | |
| Add FORTY to Watchlist: View: Get Complete FORTY Trend Analysis ➞ | |
 | SOUN SoundHound AI, Inc. |
| Sector: Technology | |
| SubSector: Software - Application | |
| MarketCap: 1040 Millions | |
| Recent Price: 4.35 Smart Investing & Trading Score: 35 | |
| Day Percent Change: -4.71% Day Change: -0.22 | |
| Week Change: -1.25% Year-to-date Change: 103.3% | |
| SOUN Links: Profile News Message Board | |
| Charts:- Daily , Weekly | |
| Add SOUN to Watchlist: View: Get Complete SOUN Trend Analysis ➞ | |
 | CGNT Cognyte Software Ltd. |
| Sector: Technology | |
| SubSector: Software - Infrastructure | |
| MarketCap: 397 Millions | |
| Recent Price: 7.28 Smart Investing & Trading Score: 34 | |
| Day Percent Change: 4.00% Day Change: 0.28 | |
| Week Change: 5.51% Year-to-date Change: 13.2% | |
| CGNT Links: Profile News Message Board | |
| Charts:- Daily , Weekly | |
| Add CGNT to Watchlist: View: Get Complete CGNT Trend Analysis ➞ | |
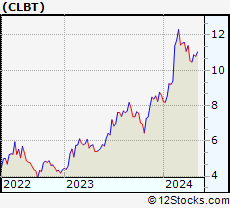 | CLBT Cellebrite DI Ltd. |
| Sector: Technology | |
| SubSector: Software - Infrastructure | |
| MarketCap: 1370 Millions | |
| Recent Price: 10.80 Smart Investing & Trading Score: 34 | |
| Day Percent Change: 0.65% Day Change: 0.07 | |
| Week Change: -0.74% Year-to-date Change: 25.6% | |
| CLBT Links: Profile News Message Board | |
| Charts:- Daily , Weekly | |
| Add CLBT to Watchlist: View: Get Complete CLBT Trend Analysis ➞ | |
 | IMMR Immersion Corporation |
| Sector: Technology | |
| SubSector: Application Software | |
| MarketCap: 173.462 Millions | |
| Recent Price: 7.23 Smart Investing & Trading Score: 34 | |
| Day Percent Change: -0.41% Day Change: -0.03 | |
| Week Change: 0.56% Year-to-date Change: 2.4% | |
| IMMR Links: Profile News Message Board | |
| Charts:- Daily , Weekly | |
| Add IMMR to Watchlist: View: Get Complete IMMR Trend Analysis ➞ | |
 | ALTR Altair Engineering Inc. |
| Sector: Technology | |
| SubSector: Semiconductor - Specialized | |
| MarketCap: 2072.2 Millions | |
| Recent Price: 81.40 Smart Investing & Trading Score: 33 | |
| Day Percent Change: -0.43% Day Change: -0.35 | |
| Week Change: -2.61% Year-to-date Change: -3.3% | |
| ALTR Links: Profile News Message Board | |
| Charts:- Daily , Weekly | |
| Add ALTR to Watchlist: View: Get Complete ALTR Trend Analysis ➞ | |
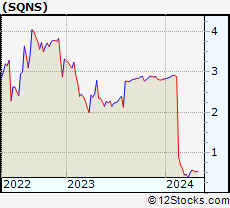 | SQNS Sequans Communications S.A. |
| Sector: Technology | |
| SubSector: Semiconductor - Integrated Circuits | |
| MarketCap: 113.61 Millions | |
| Recent Price: 0.55 Smart Investing & Trading Score: 32 | |
| Day Percent Change: 7.16% Day Change: 0.04 | |
| Week Change: 4.06% Year-to-date Change: -80.7% | |
| SQNS Links: Profile News Message Board | |
| Charts:- Daily , Weekly | |
| Add SQNS to Watchlist: View: Get Complete SQNS Trend Analysis ➞ | |
 | ASML ASML Holding N.V. |
| Sector: Technology | |
| SubSector: Semiconductor Equipment & Materials | |
| MarketCap: 102565 Millions | |
| Recent Price: 901.01 Smart Investing & Trading Score: 32 | |
| Day Percent Change: 3.53% Day Change: 30.73 | |
| Week Change: -1.95% Year-to-date Change: 19.0% | |
| ASML Links: Profile News Message Board | |
| Charts:- Daily , Weekly | |
| Add ASML to Watchlist: View: Get Complete ASML Trend Analysis ➞ | |
 | RMBS Rambus Inc. |
| Sector: Technology | |
| SubSector: Semiconductor- Memory Chips | |
| MarketCap: 1296 Millions | |
| Recent Price: 56.10 Smart Investing & Trading Score: 32 | |
| Day Percent Change: 3.41% Day Change: 1.85 | |
| Week Change: -5.28% Year-to-date Change: -17.8% | |
| RMBS Links: Profile News Message Board | |
| Charts:- Daily , Weekly | |
| Add RMBS to Watchlist: View: Get Complete RMBS Trend Analysis ➞ | |
 | NOW ServiceNow, Inc. |
| Sector: Technology | |
| SubSector: Information Technology Services | |
| MarketCap: 53599.1 Millions | |
| Recent Price: 716.65 Smart Investing & Trading Score: 32 | |
| Day Percent Change: 3.01% Day Change: 20.93 | |
| Week Change: -0.95% Year-to-date Change: 1.4% | |
| NOW Links: Profile News Message Board | |
| Charts:- Daily , Weekly | |
| Add NOW to Watchlist: View: Get Complete NOW Trend Analysis ➞ | |
 | ATNI ATN International, Inc. |
| Sector: Technology | |
| SubSector: Telecom Services - Domestic | |
| MarketCap: 1014.77 Millions | |
| Recent Price: 21.64 Smart Investing & Trading Score: 32 | |
| Day Percent Change: 2.90% Day Change: 0.61 | |
| Week Change: 10.86% Year-to-date Change: -44.5% | |
| ATNI Links: Profile News Message Board | |
| Charts:- Daily , Weekly | |
| Add ATNI to Watchlist: View: Get Complete ATNI Trend Analysis ➞ | |
 | ADSK Autodesk, Inc. |
| Sector: Technology | |
| SubSector: Technical & System Software | |
| MarketCap: 36975.8 Millions | |
| Recent Price: 215.20 Smart Investing & Trading Score: 32 | |
| Day Percent Change: 2.50% Day Change: 5.25 | |
| Week Change: -1.25% Year-to-date Change: -11.6% | |
| ADSK Links: Profile News Message Board | |
| Charts:- Daily , Weekly | |
| Add ADSK to Watchlist: View: Get Complete ADSK Trend Analysis ➞ | |
 | META Meta Platforms, Inc. |
| Sector: Technology | |
| SubSector: Internet Content & Information | |
| MarketCap: 732990 Millions | |
| Recent Price: 452.20 Smart Investing & Trading Score: 32 | |
| Day Percent Change: 2.34% Day Change: 10.35 | |
| Week Change: 2.01% Year-to-date Change: 27.7% | |
| META Links: Profile News Message Board | |
| Charts:- Daily , Weekly | |
| Add META to Watchlist: View: Get Complete META Trend Analysis ➞ | |
 | IT Gartner, Inc. |
| Sector: Technology | |
| SubSector: Information Technology Services | |
| MarketCap: 7767.98 Millions | |
| Recent Price: 428.64 Smart Investing & Trading Score: 32 | |
| Day Percent Change: 2.29% Day Change: 9.60 | |
| Week Change: -4.49% Year-to-date Change: -5.0% | |
| IT Links: Profile News Message Board | |
| Charts:- Daily , Weekly | |
| Add IT to Watchlist: View: Get Complete IT Trend Analysis ➞ | |
 | MSFT Microsoft Corporation |
| Sector: Technology | |
| SubSector: Business Software & Services | |
| MarketCap: 1154150 Millions | |
| Recent Price: 406.75 Smart Investing & Trading Score: 32 | |
| Day Percent Change: 2.24% Day Change: 8.91 | |
| Week Change: 0.11% Year-to-date Change: 8.2% | |
| MSFT Links: Profile News Message Board | |
| Charts:- Daily , Weekly | |
| Add MSFT to Watchlist: View: Get Complete MSFT Trend Analysis ➞ | |
 | CDNS Cadence Design Systems, Inc. |
| Sector: Technology | |
| SubSector: Application Software | |
| MarketCap: 16865.8 Millions | |
| Recent Price: 281.65 Smart Investing & Trading Score: 32 | |
| Day Percent Change: 1.89% Day Change: 5.21 | |
| Week Change: -0.27% Year-to-date Change: 3.4% | |
| CDNS Links: Profile News Message Board | |
| Charts:- Daily , Weekly | |
| Add CDNS to Watchlist: View: Get Complete CDNS Trend Analysis ➞ | |
 | HUBB Hubbell Incorporated |
| Sector: Technology | |
| SubSector: Diversified Electronics | |
| MarketCap: 6002.46 Millions | |
| Recent Price: 379.89 Smart Investing & Trading Score: 32 | |
| Day Percent Change: 1.86% Day Change: 6.95 | |
| Week Change: -6.78% Year-to-date Change: 15.5% | |
| HUBB Links: Profile News Message Board | |
| Charts:- Daily , Weekly | |
| Add HUBB to Watchlist: View: Get Complete HUBB Trend Analysis ➞ | |
 | TEL TE Connectivity Ltd. |
| Sector: Technology | |
| SubSector: Diversified Electronics | |
| MarketCap: 20044.9 Millions | |
| Recent Price: 142.00 Smart Investing & Trading Score: 32 | |
| Day Percent Change: 1.42% Day Change: 1.99 | |
| Week Change: 1.28% Year-to-date Change: 1.1% | |
| TEL Links: Profile News Message Board | |
| Charts:- Daily , Weekly | |
| Add TEL to Watchlist: View: Get Complete TEL Trend Analysis ➞ | |
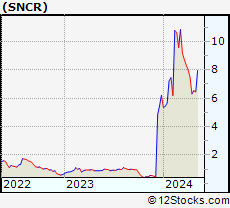 | SNCR Synchronoss Technologies, Inc. |
| Sector: Technology | |
| SubSector: Application Software | |
| MarketCap: 232.262 Millions | |
| Recent Price: 6.54 Smart Investing & Trading Score: 32 | |
| Day Percent Change: 1.40% Day Change: 0.09 | |
| Week Change: 0% Year-to-date Change: 5.3% | |
| SNCR Links: Profile News Message Board | |
| Charts:- Daily , Weekly | |
| Add SNCR to Watchlist: View: Get Complete SNCR Trend Analysis ➞ | |
 | SLAB Silicon Laboratories Inc. |
| Sector: Technology | |
| SubSector: Semiconductor - Integrated Circuits | |
| MarketCap: 3710.2 Millions | |
| Recent Price: 122.50 Smart Investing & Trading Score: 32 | |
| Day Percent Change: 1.22% Day Change: 1.48 | |
| Week Change: 0.3% Year-to-date Change: -7.4% | |
| SLAB Links: Profile News Message Board | |
| Charts:- Daily , Weekly | |
| Add SLAB to Watchlist: View: Get Complete SLAB Trend Analysis ➞ | |
 | INTC Intel Corporation |
| Sector: Technology | |
| SubSector: Semiconductor - Broad Line | |
| MarketCap: 222357 Millions | |
| Recent Price: 30.89 Smart Investing & Trading Score: 32 | |
| Day Percent Change: 1.20% Day Change: 0.37 | |
| Week Change: -3.12% Year-to-date Change: -38.5% | |
| INTC Links: Profile News Message Board | |
| Charts:- Daily , Weekly | |
| Add INTC to Watchlist: View: Get Complete INTC Trend Analysis ➞ | |
 | CHKP Check Point Software Technologies Ltd. |
| Sector: Technology | |
| SubSector: Security Software & Services | |
| MarketCap: 15112.2 Millions | |
| Recent Price: 151.09 Smart Investing & Trading Score: 32 | |
| Day Percent Change: 1.08% Day Change: 1.62 | |
| Week Change: -0.07% Year-to-date Change: -1.1% | |
| CHKP Links: Profile News Message Board | |
| Charts:- Daily , Weekly | |
| Add CHKP to Watchlist: View: Get Complete CHKP Trend Analysis ➞ | |
 | MORN Morningstar, Inc. |
| Sector: Technology | |
| SubSector: Information & Delivery Services | |
| MarketCap: 4997.87 Millions | |
| Recent Price: 293.99 Smart Investing & Trading Score: 32 | |
| Day Percent Change: 1.03% Day Change: 3.01 | |
| Week Change: 2.69% Year-to-date Change: 2.7% | |
| MORN Links: Profile News Message Board | |
| Charts:- Daily , Weekly | |
| Add MORN to Watchlist: View: Get Complete MORN Trend Analysis ➞ | |
| For tabular summary view of above stock list: Summary View ➞ 0 - 25 , 25 - 50 , 50 - 75 , 75 - 100 , 100 - 125 , 125 - 150 , 150 - 175 , 175 - 200 , 200 - 225 , 225 - 250 , 250 - 275 , 275 - 300 , 300 - 325 , 325 - 350 , 350 - 375 , 375 - 400 , 400 - 425 , 425 - 450 , 450 - 475 , 475 - 500 , 500 - 525 , 525 - 550 , 550 - 575 , 575 - 600 , 600 - 625 , 625 - 650 | ||
| Click To Change The Sort Order: By Market Cap or Company Size Performance: Year-to-date, Week and Day | |
| Select Chart Type: | ||
|
Best Stocks Today 12Stocks.com |
© 2024 12Stocks.com Terms & Conditions Privacy Contact Us
All Information Provided Only For Education And Not To Be Used For Investing or Trading. See Terms & Conditions


One More Thing ... Get Best Stocks Delivered Daily!
Never Ever Miss A Move With Our Top Ten Stocks Lists
Find Best Stocks In Any Market - Bull or Bear Market
Take A Peek At Our Top Ten Stocks Lists: Daily, Weekly, Year-to-Date & Top Trends
Find Best Stocks In Any Market - Bull or Bear Market
Take A Peek At Our Top Ten Stocks Lists: Daily, Weekly, Year-to-Date & Top Trends
Technology Stocks With Best Up Trends [0-bearish to 100-bullish]: WideOpenWest [100], FTC Solar[100], Clearfield [100], OneSpan [100], Paylocity Holding[100], Itron [100], First Solar[100], Apple [100], Cricut [100], Conduent [100], FormFactor [100]
Best Technology Stocks Year-to-Date:
MicroCloud Hologram[553.24%], MediaCo Holding[400%], Bakkt [199.55%], Uxin [190.3%], Smith Micro[183.29%], Super Micro[175.33%], CXApp [157.92%], CuriosityStream [109.22%], SoundHound AI[103.27%], NextNav [100.67%], MediaAlpha [99.64%] Best Technology Stocks This Week:
Bakkt [1571.25%], Luna Innovations[53.27%], SYLA [48.97%], 2U [41.07%], WideOpenWest [40.06%], FTC Solar[32.15%], Mitcham Industries[29.65%], Koninklijke Philips[27.29%], Conduent [26.31%], Cogint [24.92%], MediaCo Holding[23.12%] Best Technology Stocks Daily:
Luna Innovations[35.56%], WideOpenWest [28.23%], Upland Software[26.98%], 2U [26.26%], FTC Solar[25.09%], Arteris [21.36%], AXT [20.63%], Aurora Innovation[18.09%], Clearfield [13.10%], OneSpan [13.06%], OneConnect Financial[12.04%]