
 Login Sign Up


| |||||
 |  | ||||

| 12Stocks.com Market Intelligence |
Best Tech Stocks
| In a hurry? Tech Stocks Lists: Performance & Trends, Stock Charts, FANG Stocks
Sort Tech stocks: Daily, Weekly, Year-to-Date, Market Cap & Trends. Filter Tech stocks list by size:All Tech Large Mid-Range Small and MicroCap |
| 12Stocks.com Tech Stocks Performances & Trends Daily | |||||||||
|
|  The overall Smart Investing & Trading Score is 49 (0-bearish to 100-bullish) which puts Technology sector in short term neutral trend. The Smart Investing & Trading Score from previous trading session is 10 and hence an improvement of trend.
| ||||||||
Here are the Smart Investing & Trading Scores of the most requested Technology stocks at 12Stocks.com (click stock name for detailed review):
|


| 12Stocks.com: Investing in Technology sector with Stocks | |
|
The following table helps investors and traders sort through current performance and trends (as measured by Smart Investing & Trading Score) of various
stocks in the Tech sector. Quick View: Move mouse or cursor over stock symbol (ticker) to view short-term technical chart and over stock name to view long term chart. Click on  to add stock symbol to your watchlist and to add stock symbol to your watchlist and  to view watchlist. Click on any ticker or stock name for detailed market intelligence report for that stock. to view watchlist. Click on any ticker or stock name for detailed market intelligence report for that stock. |
12Stocks.com Performance of Stocks in Tech Sector
| Ticker | Stock Name | Watchlist | Category | Recent Price | Smart Investing & Trading Score | Change % | YTD Change% |
| CHTR | Charter |   | CATV | 265.93 | 64 | 1.50% | -31.58% |
| STX | Seagate | | Data Storage | 87.50 | 64 | 1.40% | 2.50% |
| CXM | Sprinklr | | Software - | 11.97 | 64 | 1.36% | -0.99% |
| SAIC | Science Applications | | IT | 131.55 | 64 | 1.32% | 5.82% |
| APPF | AppFolio | | Software | 239.11 | 64 | 1.30% | 38.02% |
| LBRDA | Liberty Broadband | | CATV | 52.27 | 64 | 1.24% | -35.18% |
| SWI | SolarWinds | | Software | 11.70 | 64 | 1.04% | -6.33% |
| SCSC | ScanSource | | Software | 42.87 | 64 | 1.01% | 8.23% |
| EA | Electronic Arts | | Software | 129.56 | 64 | 0.82% | -5.30% |
| KT | KT | | Telecom | 12.84 | 64 | 0.78% | -4.46% |
| IDCC | InterDigital | | Wireless | 103.64 | 64 | 0.76% | -4.51% |
| SKM | SK Telecom | | Wireless | 20.80 | 64 | 0.73% | -2.80% |
| ASAN | Asana | | Software | 15.72 | 64 | 0.58% | -17.31% |
| CIEN | Ciena | | Communication | 47.77 | 64 | 0.55% | 6.13% |
| SMRT | SmartRent | | Software - | 2.45 | 64 | 0.41% | -23.20% |
| GWRE | Guidewire Software | | Software | 113.32 | 64 | 0.03% | 3.93% |
| BAND | Bandwidth | | Software | 19.26 | 64 | -2.13% | 33.10% |
| HLIT | Harmonic | | Communication | 10.96 | 64 | -1.26% | -15.95% |
| MRCY | Mercury Systems | | Computer | 29.04 | 64 | -1.02% | -20.59% |
| HCAT | Health Catalyst | | Healthcare Information | 6.48 | 64 | -0.92% | -30.02% |
| EB | Eventbrite | | Software | 5.51 | 64 | -0.72% | -34.09% |
| VEON | VEON | | Telecom | 24.80 | 64 | -0.08% | 25.89% |
| RDWR | Radware | | IT | 16.85 | 64 | -0.06% | 1.02% |
| MSTR | MicroStrategy | | Software | 1223.01 | 63 | 8.29% | 93.63% |
| CURI | CuriosityStream | | Entertainment | 1.13 | 63 | 2.73% | 109.22% |
| For chart view version of above stock list: Chart View ➞ 0 - 25 , 25 - 50 , 50 - 75 , 75 - 100 , 100 - 125 , 125 - 150 , 150 - 175 , 175 - 200 , 200 - 225 , 225 - 250 , 250 - 275 , 275 - 300 , 300 - 325 , 325 - 350 , 350 - 375 , 375 - 400 , 400 - 425 , 425 - 450 , 450 - 475 , 475 - 500 , 500 - 525 , 525 - 550 , 550 - 575 , 575 - 600 , 600 - 625 , 625 - 650 | ||
 | Click To Change The Sort Order: By Market Cap or Company Size Performance: Year-to-date, Week and Day |  |
|
Get the most comprehensive stock market coverage daily at 12Stocks.com ➞ Best Stocks Today ➞ Best Stocks Weekly ➞ Best Stocks Year-to-Date ➞ Best Stocks Trends ➞  Best Stocks Today 12Stocks.com Best Nasdaq Stocks ➞ Best S&P 500 Stocks ➞ Best Tech Stocks ➞ Best Biotech Stocks ➞ |
| Detailed Overview of Tech Stocks |
| Tech Technical Overview, Leaders & Laggards, Top Tech ETF Funds & Detailed Tech Stocks List, Charts, Trends & More |
| Tech Sector: Technical Analysis, Trends & YTD Performance | |
| Technology sector is composed of stocks
from semiconductors, software, web, social media
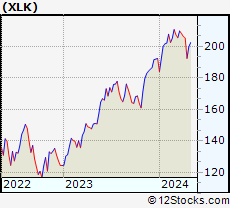
and services subsectors. Technology sector, as represented by XLK, an exchange-traded fund [ETF] that holds basket of tech stocks (e.g, Intel, Google) is up by 5.23% and is currently underperforming the overall market by -1.65% year-to-date. Below is a quick view of technical charts and trends: |
|
 XLK Weekly Chart |
|
| Long Term Trend: Not Good | |
| Medium Term Trend: Deteriorating | |
 XLK Daily Chart |
|
| Short Term Trend: Very Good | |
| Overall Trend Score: 49 | |
| YTD Performance: 5.23% | |
| **Trend Scores & Views Are Only For Educational Purposes And Not For Investing | |
| 12Stocks.com: Top Performing Technology Sector Stocks | ||||||||||||||||||||||||||||||||||||||||||||||||
 The top performing Technology sector stocks year to date are
Now, more recently, over last week, the top performing Technology sector stocks on the move are


|
||||||||||||||||||||||||||||||||||||||||||||||||
| 12Stocks.com: Investing in Tech Sector using Exchange Traded Funds | |
|
The following table shows list of key exchange traded funds (ETF) that
help investors track Tech Index. For detailed view, check out our ETF Funds section of our website. Quick View: Move mouse or cursor over ETF symbol (ticker) to view short-term technical chart and over ETF name to view long term chart. Click on ticker or stock name for detailed view. Click on to add stock symbol to your watchlist and to view watchlist. |
12Stocks.com List of ETFs that track Tech Index
| Ticker | ETF Name | Watchlist | Recent Price | Smart Investing & Trading Score | Change % | Week % | Year-to-date % |
| XLK | Technology | | 202.55 | 49 | 2.79 | 1.36 | 5.23% |
| QQQ | QQQ | | 435.48 | 57 | 2.01 | 1.04 | 6.34% |
| IYW | Technology | | 132.17 | 62 | 2.45 | 0.93 | 7.67% |
| VGT | Information Technology | | 509.46 | 49 | 2.70 | 1.1 | 5.26% |
| IXN | Global Tech | | 72.86 | 62 | 2.82 | 1.48 | 6.86% |
| IGV | Tech-Software | | 80.87 | 42 | 1.20 | -0.27 | -0.32% |
| XSD | Semiconductor | | 226.11 | 88 | 2.25 | 0.63 | 0.59% |
| TQQQ | QQQ | | 56.70 | 49 | 5.92 | 2.57 | 11.83% |
| SQQQ | Short QQQ | | 11.08 | 51 | -5.94 | -3.06 | -17.62% |
| SOXL | Semicondct Bull 3X | | 38.97 | 39 | 6.91 | -1.96 | 24.11% |
| SOXS | Semicondct Bear 3X | | 35.12 | 51 | -6.60 | 0.06 | 503.44% |
| SOXX | PHLX Semiconductor | | 216.17 | 52 | 2.25 | -0.34 | 12.57% |
| QTEC | First -100-Tech | | 182.75 | 42 | 1.45 | -0.67 | 4.15% |
| SMH | Semiconductor | | 217.73 | 65 | 2.69 | 0.04 | 24.51% |
| 12Stocks.com: Charts, Trends, Fundamental Data and Performances of Tech Stocks | |
|
We now take in-depth look at all Tech stocks including charts, multi-period performances and overall trends (as measured by Smart Investing & Trading Score). One can sort Tech stocks (click link to choose) by Daily, Weekly and by Year-to-Date performances. Also, one can sort by size of the company or by market capitalization. |
| Select Your Default Chart Type: | |||||
| |||||
| Click on stock symbol or name for detailed view. Click on to add stock symbol to your watchlist and to view watchlist. Quick View: Move mouse or cursor over "Daily" to quickly view daily technical stock chart and over "Weekly" to view weekly technical stock chart. | |||||


 | CHTR Charter Communications, Inc. |
| Sector: Technology | |
| SubSector: CATV Systems | |
| MarketCap: 82268.3 Millions | |
| Recent Price: 265.93 Smart Investing & Trading Score: 64 | |
| Day Percent Change: 1.50% Day Change: 3.93 | |
| Week Change: 4.45% Year-to-date Change: -31.6% | |
| CHTR Links: Profile News Message Board | |
| Charts:- Daily , Weekly | |
| Add CHTR to Watchlist: View: Get Complete CHTR Trend Analysis ➞ | |
 | STX Seagate Technology plc |
| Sector: Technology | |
| SubSector: Data Storage Devices | |
| MarketCap: 10814.7 Millions | |
| Recent Price: 87.50 Smart Investing & Trading Score: 64 | |
| Day Percent Change: 1.40% Day Change: 1.21 | |
| Week Change: 1.7% Year-to-date Change: 2.5% | |
| STX Links: Profile News Message Board | |
| Charts:- Daily , Weekly | |
| Add STX to Watchlist: View: Get Complete STX Trend Analysis ➞ | |
 | CXM Sprinklr, Inc. |
| Sector: Technology | |
| SubSector: Software - Application | |
| MarketCap: 3700 Millions | |
| Recent Price: 11.97 Smart Investing & Trading Score: 64 | |
| Day Percent Change: 1.36% Day Change: 0.16 | |
| Week Change: 0.29% Year-to-date Change: -1.0% | |
| CXM Links: Profile News Message Board | |
| Charts:- Daily , Weekly | |
| Add CXM to Watchlist: View: Get Complete CXM Trend Analysis ➞ | |
 | SAIC Science Applications International Corporation |
| Sector: Technology | |
| SubSector: Information Technology Services | |
| MarketCap: 3388.78 Millions | |
| Recent Price: 131.55 Smart Investing & Trading Score: 64 | |
| Day Percent Change: 1.32% Day Change: 1.71 | |
| Week Change: 1.61% Year-to-date Change: 5.8% | |
| SAIC Links: Profile News Message Board | |
| Charts:- Daily , Weekly | |
| Add SAIC to Watchlist: View: Get Complete SAIC Trend Analysis ➞ | |
 | APPF AppFolio, Inc. |
| Sector: Technology | |
| SubSector: Application Software | |
| MarketCap: 3412.02 Millions | |
| Recent Price: 239.11 Smart Investing & Trading Score: 64 | |
| Day Percent Change: 1.30% Day Change: 3.06 | |
| Week Change: -1.5% Year-to-date Change: 38.0% | |
| APPF Links: Profile News Message Board | |
| Charts:- Daily , Weekly | |
| Add APPF to Watchlist: View: Get Complete APPF Trend Analysis ➞ | |
 | LBRDA Liberty Broadband Corporation |
| Sector: Technology | |
| SubSector: CATV Systems | |
| MarketCap: 17001.5 Millions | |
| Recent Price: 52.27 Smart Investing & Trading Score: 64 | |
| Day Percent Change: 1.24% Day Change: 0.64 | |
| Week Change: 5.47% Year-to-date Change: -35.2% | |
| LBRDA Links: Profile News Message Board | |
| Charts:- Daily , Weekly | |
| Add LBRDA to Watchlist: View: Get Complete LBRDA Trend Analysis ➞ | |
 | SWI SolarWinds Corporation |
| Sector: Technology | |
| SubSector: Application Software | |
| MarketCap: 4524.62 Millions | |
| Recent Price: 11.70 Smart Investing & Trading Score: 64 | |
| Day Percent Change: 1.04% Day Change: 0.12 | |
| Week Change: 5.22% Year-to-date Change: -6.3% | |
| SWI Links: Profile News Message Board | |
| Charts:- Daily , Weekly | |
| Add SWI to Watchlist: View: Get Complete SWI Trend Analysis ➞ | |
 | SCSC ScanSource, Inc. |
| Sector: Technology | |
| SubSector: Technical & System Software | |
| MarketCap: 541 Millions | |
| Recent Price: 42.87 Smart Investing & Trading Score: 64 | |
| Day Percent Change: 1.01% Day Change: 0.43 | |
| Week Change: 2.14% Year-to-date Change: 8.2% | |
| SCSC Links: Profile News Message Board | |
| Charts:- Daily , Weekly | |
| Add SCSC to Watchlist: View: Get Complete SCSC Trend Analysis ➞ | |
 | EA Electronic Arts Inc. |
| Sector: Technology | |
| SubSector: Multimedia & Graphics Software | |
| MarketCap: 27296.5 Millions | |
| Recent Price: 129.56 Smart Investing & Trading Score: 64 | |
| Day Percent Change: 0.82% Day Change: 1.06 | |
| Week Change: 1.3% Year-to-date Change: -5.3% | |
| EA Links: Profile News Message Board | |
| Charts:- Daily , Weekly | |
| Add EA to Watchlist: View: Get Complete EA Trend Analysis ➞ | |
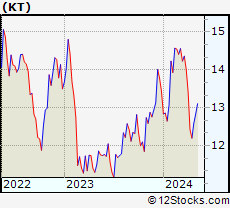 | KT KT Corporation |
| Sector: Technology | |
| SubSector: Telecom Services - Foreign | |
| MarketCap: 4216.89 Millions | |
| Recent Price: 12.84 Smart Investing & Trading Score: 64 | |
| Day Percent Change: 0.78% Day Change: 0.10 | |
| Week Change: 1.99% Year-to-date Change: -4.5% | |
| KT Links: Profile News Message Board | |
| Charts:- Daily , Weekly | |
| Add KT to Watchlist: View: Get Complete KT Trend Analysis ➞ | |
 | IDCC InterDigital, Inc. |
| Sector: Technology | |
| SubSector: Wireless Communications | |
| MarketCap: 1225.27 Millions | |
| Recent Price: 103.64 Smart Investing & Trading Score: 64 | |
| Day Percent Change: 0.76% Day Change: 0.78 | |
| Week Change: 2.91% Year-to-date Change: -4.5% | |
| IDCC Links: Profile News Message Board | |
| Charts:- Daily , Weekly | |
| Add IDCC to Watchlist: View: Get Complete IDCC Trend Analysis ➞ | |
 | SKM SK Telecom Co.,Ltd |
| Sector: Technology | |
| SubSector: Wireless Communications | |
| MarketCap: 12332.1 Millions | |
| Recent Price: 20.80 Smart Investing & Trading Score: 64 | |
| Day Percent Change: 0.73% Day Change: 0.15 | |
| Week Change: 0.92% Year-to-date Change: -2.8% | |
| SKM Links: Profile News Message Board | |
| Charts:- Daily , Weekly | |
| Add SKM to Watchlist: View: Get Complete SKM Trend Analysis ➞ | |
 | ASAN Asana, Inc. |
| Sector: Technology | |
| SubSector: Software Application | |
| MarketCap: 45087 Millions | |
| Recent Price: 15.72 Smart Investing & Trading Score: 64 | |
| Day Percent Change: 0.58% Day Change: 0.09 | |
| Week Change: 4.24% Year-to-date Change: -17.3% | |
| ASAN Links: Profile News Message Board | |
| Charts:- Daily , Weekly | |
| Add ASAN to Watchlist: View: Get Complete ASAN Trend Analysis ➞ | |
 | CIEN Ciena Corporation |
| Sector: Technology | |
| SubSector: Communication Equipment | |
| MarketCap: 6206.99 Millions | |
| Recent Price: 47.77 Smart Investing & Trading Score: 64 | |
| Day Percent Change: 0.55% Day Change: 0.26 | |
| Week Change: 2.49% Year-to-date Change: 6.1% | |
| CIEN Links: Profile News Message Board | |
| Charts:- Daily , Weekly | |
| Add CIEN to Watchlist: View: Get Complete CIEN Trend Analysis ➞ | |
 | SMRT SmartRent, Inc. |
| Sector: Technology | |
| SubSector: Software - Application | |
| MarketCap: 733 Millions | |
| Recent Price: 2.45 Smart Investing & Trading Score: 64 | |
| Day Percent Change: 0.41% Day Change: 0.01 | |
| Week Change: 3.81% Year-to-date Change: -23.2% | |
| SMRT Links: Profile News Message Board | |
| Charts:- Daily , Weekly | |
| Add SMRT to Watchlist: View: Get Complete SMRT Trend Analysis ➞ | |
 | GWRE Guidewire Software, Inc. |
| Sector: Technology | |
| SubSector: Business Software & Services | |
| MarketCap: 7073.18 Millions | |
| Recent Price: 113.32 Smart Investing & Trading Score: 64 | |
| Day Percent Change: 0.03% Day Change: 0.03 | |
| Week Change: -0.2% Year-to-date Change: 3.9% | |
| GWRE Links: Profile News Message Board | |
| Charts:- Daily , Weekly | |
| Add GWRE to Watchlist: View: Get Complete GWRE Trend Analysis ➞ | |
 | BAND Bandwidth Inc. |
| Sector: Technology | |
| SubSector: Business Software & Services | |
| MarketCap: 1549.38 Millions | |
| Recent Price: 19.26 Smart Investing & Trading Score: 64 | |
| Day Percent Change: -2.13% Day Change: -0.42 | |
| Week Change: 6.76% Year-to-date Change: 33.1% | |
| BAND Links: Profile News Message Board | |
| Charts:- Daily , Weekly | |
| Add BAND to Watchlist: View: Get Complete BAND Trend Analysis ➞ | |
 | HLIT Harmonic Inc. |
| Sector: Technology | |
| SubSector: Communication Equipment | |
| MarketCap: 533.539 Millions | |
| Recent Price: 10.96 Smart Investing & Trading Score: 64 | |
| Day Percent Change: -1.26% Day Change: -0.14 | |
| Week Change: 19.13% Year-to-date Change: -16.0% | |
| HLIT Links: Profile News Message Board | |
| Charts:- Daily , Weekly | |
| Add HLIT to Watchlist: View: Get Complete HLIT Trend Analysis ➞ | |
 | MRCY Mercury Systems, Inc. |
| Sector: Technology | |
| SubSector: Computer Peripherals | |
| MarketCap: 3797.09 Millions | |
| Recent Price: 29.04 Smart Investing & Trading Score: 64 | |
| Day Percent Change: -1.02% Day Change: -0.30 | |
| Week Change: -0.14% Year-to-date Change: -20.6% | |
| MRCY Links: Profile News Message Board | |
| Charts:- Daily , Weekly | |
| Add MRCY to Watchlist: View: Get Complete MRCY Trend Analysis ➞ | |
 | HCAT Health Catalyst, Inc. |
| Sector: Technology | |
| SubSector: Healthcare Information Services | |
| MarketCap: 983.955 Millions | |
| Recent Price: 6.48 Smart Investing & Trading Score: 64 | |
| Day Percent Change: -0.92% Day Change: -0.06 | |
| Week Change: 7.46% Year-to-date Change: -30.0% | |
| HCAT Links: Profile News Message Board | |
| Charts:- Daily , Weekly | |
| Add HCAT to Watchlist: View: Get Complete HCAT Trend Analysis ➞ | |
 | EB Eventbrite, Inc. |
| Sector: Technology | |
| SubSector: Application Software | |
| MarketCap: 805.262 Millions | |
| Recent Price: 5.51 Smart Investing & Trading Score: 64 | |
| Day Percent Change: -0.72% Day Change: -0.04 | |
| Week Change: 2.42% Year-to-date Change: -34.1% | |
| EB Links: Profile News Message Board | |
| Charts:- Daily , Weekly | |
| Add EB to Watchlist: View: Get Complete EB Trend Analysis ➞ | |
 | VEON VEON Ltd. |
| Sector: Technology | |
| SubSector: Telecom Services - Foreign | |
| MarketCap: 2497.89 Millions | |
| Recent Price: 24.80 Smart Investing & Trading Score: 64 | |
| Day Percent Change: -0.08% Day Change: -0.02 | |
| Week Change: 5.85% Year-to-date Change: 25.9% | |
| VEON Links: Profile News Message Board | |
| Charts:- Daily , Weekly | |
| Add VEON to Watchlist: View: Get Complete VEON Trend Analysis ➞ | |
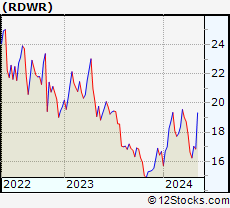 | RDWR Radware Ltd. |
| Sector: Technology | |
| SubSector: Information Technology Services | |
| MarketCap: 974.168 Millions | |
| Recent Price: 16.85 Smart Investing & Trading Score: 64 | |
| Day Percent Change: -0.06% Day Change: -0.01 | |
| Week Change: -1.06% Year-to-date Change: 1.0% | |
| RDWR Links: Profile News Message Board | |
| Charts:- Daily , Weekly | |
| Add RDWR to Watchlist: View: Get Complete RDWR Trend Analysis ➞ | |
 | MSTR MicroStrategy Incorporated |
| Sector: Technology | |
| SubSector: Application Software | |
| MarketCap: 1164.52 Millions | |
| Recent Price: 1223.01 Smart Investing & Trading Score: 63 | |
| Day Percent Change: 8.29% Day Change: 93.59 | |
| Week Change: -4.63% Year-to-date Change: 93.6% | |
| MSTR Links: Profile News Message Board | |
| Charts:- Daily , Weekly | |
| Add MSTR to Watchlist: View: Get Complete MSTR Trend Analysis ➞ | |
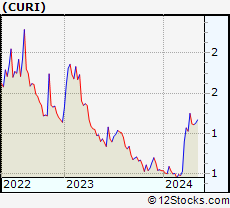 | CURI CuriosityStream Inc. |
| Sector: Technology | |
| SubSector: Entertainment | |
| MarketCap: 35837 Millions | |
| Recent Price: 1.13 Smart Investing & Trading Score: 63 | |
| Day Percent Change: 2.73% Day Change: 0.03 | |
| Week Change: 1.8% Year-to-date Change: 109.2% | |
| CURI Links: Profile News Message Board | |
| Charts:- Daily , Weekly | |
| Add CURI to Watchlist: View: Get Complete CURI Trend Analysis ➞ | |
| For tabular summary view of above stock list: Summary View ➞ 0 - 25 , 25 - 50 , 50 - 75 , 75 - 100 , 100 - 125 , 125 - 150 , 150 - 175 , 175 - 200 , 200 - 225 , 225 - 250 , 250 - 275 , 275 - 300 , 300 - 325 , 325 - 350 , 350 - 375 , 375 - 400 , 400 - 425 , 425 - 450 , 450 - 475 , 475 - 500 , 500 - 525 , 525 - 550 , 550 - 575 , 575 - 600 , 600 - 625 , 625 - 650 | ||
| Click To Change The Sort Order: By Market Cap or Company Size Performance: Year-to-date, Week and Day | |
| Select Chart Type: | ||
|
Best Stocks Today 12Stocks.com |
© 2024 12Stocks.com Terms & Conditions Privacy Contact Us
All Information Provided Only For Education And Not To Be Used For Investing or Trading. See Terms & Conditions


One More Thing ... Get Best Stocks Delivered Daily!
Never Ever Miss A Move With Our Top Ten Stocks Lists
Find Best Stocks In Any Market - Bull or Bear Market
Take A Peek At Our Top Ten Stocks Lists: Daily, Weekly, Year-to-Date & Top Trends
Find Best Stocks In Any Market - Bull or Bear Market
Take A Peek At Our Top Ten Stocks Lists: Daily, Weekly, Year-to-Date & Top Trends
Technology Stocks With Best Up Trends [0-bearish to 100-bullish]: WideOpenWest [100], FTC Solar[100], Clearfield [100], OneSpan [100], Itron [100], Cardlytics [100], First Solar[100], Apple [100], Cricut [100], Motorola [100], Conduent [100]
Best Technology Stocks Year-to-Date:
MicroCloud Hologram[553.24%], MediaCo Holding[400%], Bakkt [199.55%], Uxin [188.16%], Smith Micro[183.29%], Super Micro[175.35%], CXApp [157.92%], CuriosityStream [109.22%], SoundHound AI[103.27%], NextNav [100.67%], MediaAlpha [99.64%] Best Technology Stocks This Week:
Bakkt [1571.25%], Luna Innovations[53.77%], SYLA [48.97%], 2U [41.49%], WideOpenWest [40.06%], FTC Solar[32.15%], Mitcham Industries[31.57%], Koninklijke Philips[27.29%], Conduent [26.47%], Cogint [25.08%], AXT [23.23%] Best Technology Stocks Daily:
Luna Innovations[36.00%], WideOpenWest [28.23%], Upland Software[28.22%], 2U [26.63%], FTC Solar[25.09%], Arteris [21.36%], AXT [20.79%], Aurora Innovation[18.09%], Clearfield [13.22%], OneSpan [13.15%], Paylocity Holding[12.05%]