
 Login Sign Up


| |||||
 |  | ||||

| 12Stocks.com Market Intelligence |
Best Tech Stocks
| In a hurry? Tech Stocks Lists: Performance & Trends, Stock Charts, FANG Stocks
Sort Tech stocks: Daily, Weekly, Year-to-Date, Market Cap & Trends. Filter Tech stocks list by size:All Tech Large Mid-Range Small and MicroCap |
| 12Stocks.com Tech Stocks Performances & Trends Daily | |||||||||
|
|  The overall Smart Investing & Trading Score is 38 (0-bearish to 100-bullish) which puts Technology sector in short term bearish to neutral trend. The Smart Investing & Trading Score from previous trading session is 45 and hence a deterioration of trend.
| ||||||||
Here are the Smart Investing & Trading Scores of the most requested Technology stocks at 12Stocks.com (click stock name for detailed review):
|


| 12Stocks.com: Investing in Technology sector with Stocks | |
|
The following table helps investors and traders sort through current performance and trends (as measured by Smart Investing & Trading Score) of various
stocks in the Tech sector. Quick View: Move mouse or cursor over stock symbol (ticker) to view short-term technical chart and over stock name to view long term chart. Click on  to add stock symbol to your watchlist and to add stock symbol to your watchlist and  to view watchlist. Click on any ticker or stock name for detailed market intelligence report for that stock. to view watchlist. Click on any ticker or stock name for detailed market intelligence report for that stock. |
12Stocks.com Performance of Stocks in Tech Sector
| Ticker | Stock Name | Watchlist | Category | Recent Price | Smart Investing & Trading Score | Change % | YTD Change% |
| DOX | Amdocs |   | Software | 85.64 | 20 | -1.27 | -2.56% |
| VIV | Telefonica Brasil | | Wireless | 9.30 | 35 | -1.27 | -14.99% |
| WKME | WalkMe | | Software - | 7.77 | 23 | -1.27 | -23.33% |
| CCI | Crown Castle | | Communication | 94.21 | 10 | -1.29 | -18.21% |
| TRNS | Transcat | | Instruments | 109.84 | 88 | -1.29 | 0.47% |
| RGTI | Rigetti Computing | | Computer Hardware | 1.15 | 0 | -1.29 | 16.82% |
| MEI | Methode Electronics | | Electronics | 12.13 | 60 | -1.30 | -46.63% |
| IIIV | i3 Verticals | | Software | 23.16 | 88 | -1.30 | 9.38% |
| PLTR | Palantir | | Software Infrastructure | 21.31 | 51 | -1.32 | 24.08% |
| JAMF | Jamf Holding | | Software | 19.40 | 88 | -1.32 | 7.36% |
| WMG | Warner Music | | Entertainment | 31.52 | 0 | -1.33 | -11.95% |
| INST | Instructure | | Software - | 19.22 | 35 | -1.33 | -28.84% |
| LBRDA | Liberty Broadband | | CATV | 49.62 | 22 | -1.33 | -38.47% |
| GWRE | Guidewire Software | | Software | 111.98 | 68 | -1.35 | 2.70% |
| INSP | Inspire Medical | | Internet | 231.01 | 66 | -1.36 | 13.56% |
| APPN | Appian | | Software | 36.16 | 46 | -1.36 | -3.98% |
| T | AT&T | | Telecom | 16.58 | 44 | -1.37 | -1.19% |
| QLYS | Qualys | | Software | 169.74 | 57 | -1.38 | -13.52% |
| RPD | Rapid7 | | Software | 45.85 | 35 | -1.38 | -19.70% |
| XRX | Xerox | | IT | 14.18 | 0 | -1.39 | -22.64% |
| FSLR | First Solar | | Semiconductor | 175.02 | 44 | -1.39 | 1.59% |
| MSGE | Madison Square | | Entertainment | 38.90 | 68 | -1.42 | 22.29% |
| INTU | Intuit | | Software | 626.39 | 55 | -1.43 | 0.22% |
| OLO | Olo | | Software - | 4.84 | 31 | -1.43 | -15.38% |
| UIS | Unisys | | IT | 5.46 | 35 | -1.44 | -2.85% |
| For chart view version of above stock list: Chart View ➞ 0 - 25 , 25 - 50 , 50 - 75 , 75 - 100 , 100 - 125 , 125 - 150 , 150 - 175 , 175 - 200 , 200 - 225 , 225 - 250 , 250 - 275 , 275 - 300 , 300 - 325 , 325 - 350 , 350 - 375 , 375 - 400 , 400 - 425 , 425 - 450 , 450 - 475 , 475 - 500 , 500 - 525 , 525 - 550 , 550 - 575 , 575 - 600 , 600 - 625 , 625 - 650 | ||
 | Click To Change The Sort Order: By Market Cap or Company Size Performance: Year-to-date, Week and Day |  |
|
Get the most comprehensive stock market coverage daily at 12Stocks.com ➞ Best Stocks Today ➞ Best Stocks Weekly ➞ Best Stocks Year-to-Date ➞ Best Stocks Trends ➞  Best Stocks Today 12Stocks.com Best Nasdaq Stocks ➞ Best S&P 500 Stocks ➞ Best Tech Stocks ➞ Best Biotech Stocks ➞ |
| Detailed Overview of Tech Stocks |
| Tech Technical Overview, Leaders & Laggards, Top Tech ETF Funds & Detailed Tech Stocks List, Charts, Trends & More |
| Tech Sector: Technical Analysis, Trends & YTD Performance | |
| Technology sector is composed of stocks
from semiconductors, software, web, social media
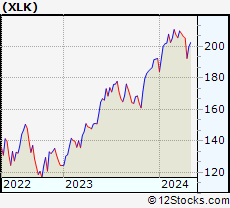
and services subsectors. Technology sector, as represented by XLK, an exchange-traded fund [ETF] that holds basket of tech stocks (e.g, Intel, Google) is up by 2.66% and is currently underperforming the overall market by -2.5% year-to-date. Below is a quick view of technical charts and trends: |
|
 XLK Weekly Chart |
|
| Long Term Trend: Not Good | |
| Medium Term Trend: Not Good | |
 XLK Daily Chart |
|
| Short Term Trend: Very Good | |
| Overall Trend Score: 38 | |
| YTD Performance: 2.66% | |
| **Trend Scores & Views Are Only For Educational Purposes And Not For Investing | |
| 12Stocks.com: Top Performing Technology Sector Stocks | ||||||||||||||||||||||||||||||||||||||||||||||||
 The top performing Technology sector stocks year to date are
Now, more recently, over last week, the top performing Technology sector stocks on the move are


|
||||||||||||||||||||||||||||||||||||||||||||||||
| 12Stocks.com: Investing in Tech Sector using Exchange Traded Funds | |
|
The following table shows list of key exchange traded funds (ETF) that
help investors track Tech Index. For detailed view, check out our ETF Funds section of our website. Quick View: Move mouse or cursor over ETF symbol (ticker) to view short-term technical chart and over ETF name to view long term chart. Click on ticker or stock name for detailed view. Click on to add stock symbol to your watchlist and to view watchlist. |
12Stocks.com List of ETFs that track Tech Index
| Ticker | ETF Name | Watchlist | Recent Price | Smart Investing & Trading Score | Change % | Week % | Year-to-date % |
| XLK | Technology | | 197.60 | 38 | -0.22 | 2.63 | 2.66% |
| QQQ | QQQ | | 424.45 | 51 | -0.48 | 2.36 | 3.65% |
| IYW | Technology | | 128.20 | 51 | -0.50 | 2.77 | 4.44% |
| VGT | Information Technology | | 495.44 | 38 | 0.04 | 3.24 | 2.36% |
| IXN | Global Tech | | 70.75 | 36 | -0.13 | 2.95 | 3.77% |
| IGV | Tech-Software | | 80.19 | 25 | -0.93 | 2.11 | -1.16% |
| XSD | Semiconductor | | 220.63 | 30 | 2.36 | 8.39 | -1.85% |
| TQQQ | QQQ | | 52.85 | 38 | -1.60 | 6.81 | 4.24% |
| SQQQ | Short QQQ | | 12.00 | 44 | 1.61 | -6.54 | -10.78% |
| SOXL | Semicondct Bull 3X | | 37.41 | 58 | 5.41 | 21.5 | 19.14% |
| SOXS | Semicondct Bear 3X | | 37.44 | 51 | -5.48 | -18.84 | 543.3% |
| SOXX | PHLX Semiconductor | | 212.41 | 51 | 1.86 | 7.07 | 10.61% |
| QTEC | First -100-Tech | | 181.18 | 51 | 0.02 | 4.16 | 3.25% |
| SMH | Semiconductor | | 212.20 | 63 | 2.00 | 6.52 | 21.35% |
| 12Stocks.com: Charts, Trends, Fundamental Data and Performances of Tech Stocks | |
|
We now take in-depth look at all Tech stocks including charts, multi-period performances and overall trends (as measured by Smart Investing & Trading Score). One can sort Tech stocks (click link to choose) by Daily, Weekly and by Year-to-Date performances. Also, one can sort by size of the company or by market capitalization. |
| Select Your Default Chart Type: | |||||
| |||||
| Click on stock symbol or name for detailed view. Click on to add stock symbol to your watchlist and to view watchlist. Quick View: Move mouse or cursor over "Daily" to quickly view daily technical stock chart and over "Weekly" to view weekly technical stock chart. | |||||


 | DOX Amdocs Limited |
| Sector: Technology | |
| SubSector: Business Software & Services | |
| MarketCap: 6895.48 Millions | |
| Recent Price: 85.64 Smart Investing & Trading Score: 20 | |
| Day Percent Change: -1.27% Day Change: -1.10 | |
| Week Change: -0.57% Year-to-date Change: -2.6% | |
| DOX Links: Profile News Message Board | |
| Charts:- Daily , Weekly | |
| Add DOX to Watchlist: View: Get Complete DOX Trend Analysis ➞ | |
 | VIV Telefonica Brasil S.A. |
| Sector: Technology | |
| SubSector: Wireless Communications | |
| MarketCap: 19611.1 Millions | |
| Recent Price: 9.30 Smart Investing & Trading Score: 35 | |
| Day Percent Change: -1.27% Day Change: -0.12 | |
| Week Change: -0.53% Year-to-date Change: -15.0% | |
| VIV Links: Profile News Message Board | |
| Charts:- Daily , Weekly | |
| Add VIV to Watchlist: View: Get Complete VIV Trend Analysis ➞ | |
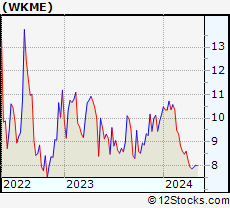 | WKME WalkMe Ltd. |
| Sector: Technology | |
| SubSector: Software - Application | |
| MarketCap: 833 Millions | |
| Recent Price: 7.77 Smart Investing & Trading Score: 23 | |
| Day Percent Change: -1.27% Day Change: -0.10 | |
| Week Change: -1.15% Year-to-date Change: -23.3% | |
| WKME Links: Profile News Message Board | |
| Charts:- Daily , Weekly | |
| Add WKME to Watchlist: View: Get Complete WKME Trend Analysis ➞ | |
 | CCI Crown Castle International Corp. (REIT) |
| Sector: Technology | |
| SubSector: Diversified Communication Services | |
| MarketCap: 57615.4 Millions | |
| Recent Price: 94.21 Smart Investing & Trading Score: 10 | |
| Day Percent Change: -1.29% Day Change: -1.23 | |
| Week Change: -1.04% Year-to-date Change: -18.2% | |
| CCI Links: Profile News Message Board | |
| Charts:- Daily , Weekly | |
| Add CCI to Watchlist: View: Get Complete CCI Trend Analysis ➞ | |
 | TRNS Transcat, Inc. |
| Sector: Technology | |
| SubSector: Scientific & Technical Instruments | |
| MarketCap: 216.653 Millions | |
| Recent Price: 109.84 Smart Investing & Trading Score: 88 | |
| Day Percent Change: -1.29% Day Change: -1.43 | |
| Week Change: 1.67% Year-to-date Change: 0.5% | |
| TRNS Links: Profile News Message Board | |
| Charts:- Daily , Weekly | |
| Add TRNS to Watchlist: View: Get Complete TRNS Trend Analysis ➞ | |
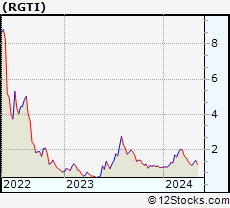 | RGTI Rigetti Computing, Inc. |
| Sector: Technology | |
| SubSector: Computer Hardware | |
| MarketCap: 163 Millions | |
| Recent Price: 1.15 Smart Investing & Trading Score: 0 | |
| Day Percent Change: -1.29% Day Change: -0.01 | |
| Week Change: 4.09% Year-to-date Change: 16.8% | |
| RGTI Links: Profile News Message Board | |
| Charts:- Daily , Weekly | |
| Add RGTI to Watchlist: View: Get Complete RGTI Trend Analysis ➞ | |
 | MEI Methode Electronics, Inc. |
| Sector: Technology | |
| SubSector: Diversified Electronics | |
| MarketCap: 941.896 Millions | |
| Recent Price: 12.13 Smart Investing & Trading Score: 60 | |
| Day Percent Change: -1.30% Day Change: -0.16 | |
| Week Change: 4.3% Year-to-date Change: -46.6% | |
| MEI Links: Profile News Message Board | |
| Charts:- Daily , Weekly | |
| Add MEI to Watchlist: View: Get Complete MEI Trend Analysis ➞ | |
 | IIIV i3 Verticals, Inc. |
| Sector: Technology | |
| SubSector: Business Software & Services | |
| MarketCap: 448.458 Millions | |
| Recent Price: 23.16 Smart Investing & Trading Score: 88 | |
| Day Percent Change: -1.30% Day Change: -0.30 | |
| Week Change: 3.74% Year-to-date Change: 9.4% | |
| IIIV Links: Profile News Message Board | |
| Charts:- Daily , Weekly | |
| Add IIIV to Watchlist: View: Get Complete IIIV Trend Analysis ➞ | |
 | PLTR Palantir Technologies Inc. |
| Sector: Technology | |
| SubSector: Software Infrastructure | |
| MarketCap: 47107 Millions | |
| Recent Price: 21.31 Smart Investing & Trading Score: 51 | |
| Day Percent Change: -1.32% Day Change: -0.29 | |
| Week Change: 1.99% Year-to-date Change: 24.1% | |
| PLTR Links: Profile News Message Board | |
| Charts:- Daily , Weekly | |
| Add PLTR to Watchlist: View: Get Complete PLTR Trend Analysis ➞ | |
 | JAMF Jamf Holding Corp. |
| Sector: Technology | |
| SubSector: Software Application | |
| MarketCap: 36987 Millions | |
| Recent Price: 19.40 Smart Investing & Trading Score: 88 | |
| Day Percent Change: -1.32% Day Change: -0.26 | |
| Week Change: 4.53% Year-to-date Change: 7.4% | |
| JAMF Links: Profile News Message Board | |
| Charts:- Daily , Weekly | |
| Add JAMF to Watchlist: View: Get Complete JAMF Trend Analysis ➞ | |
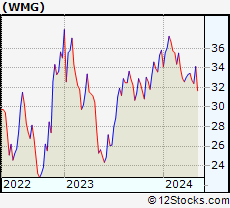 | WMG Warner Music Group Corp. |
| Sector: Technology | |
| SubSector: Entertainment | |
| MarketCap: 17237 Millions | |
| Recent Price: 31.52 Smart Investing & Trading Score: 0 | |
| Day Percent Change: -1.33% Day Change: -0.43 | |
| Week Change: -3.68% Year-to-date Change: -12.0% | |
| WMG Links: Profile News Message Board | |
| Charts:- Daily , Weekly | |
| Add WMG to Watchlist: View: Get Complete WMG Trend Analysis ➞ | |
 | INST Instructure Holdings, Inc. |
| Sector: Technology | |
| SubSector: Software - Application | |
| MarketCap: 3580 Millions | |
| Recent Price: 19.22 Smart Investing & Trading Score: 35 | |
| Day Percent Change: -1.33% Day Change: -0.26 | |
| Week Change: 0.79% Year-to-date Change: -28.8% | |
| INST Links: Profile News Message Board | |
| Charts:- Daily , Weekly | |
| Add INST to Watchlist: View: Get Complete INST Trend Analysis ➞ | |
 | LBRDA Liberty Broadband Corporation |
| Sector: Technology | |
| SubSector: CATV Systems | |
| MarketCap: 17001.5 Millions | |
| Recent Price: 49.62 Smart Investing & Trading Score: 22 | |
| Day Percent Change: -1.33% Day Change: -0.67 | |
| Week Change: -1% Year-to-date Change: -38.5% | |
| LBRDA Links: Profile News Message Board | |
| Charts:- Daily , Weekly | |
| Add LBRDA to Watchlist: View: Get Complete LBRDA Trend Analysis ➞ | |
 | GWRE Guidewire Software, Inc. |
| Sector: Technology | |
| SubSector: Business Software & Services | |
| MarketCap: 7073.18 Millions | |
| Recent Price: 111.98 Smart Investing & Trading Score: 68 | |
| Day Percent Change: -1.35% Day Change: -1.53 | |
| Week Change: 4.03% Year-to-date Change: 2.7% | |
| GWRE Links: Profile News Message Board | |
| Charts:- Daily , Weekly | |
| Add GWRE to Watchlist: View: Get Complete GWRE Trend Analysis ➞ | |
 | INSP Inspire Medical Systems, Inc. |
| Sector: Technology | |
| SubSector: Internet Information Providers | |
| MarketCap: 1239.8 Millions | |
| Recent Price: 231.01 Smart Investing & Trading Score: 66 | |
| Day Percent Change: -1.36% Day Change: -3.18 | |
| Week Change: 0.78% Year-to-date Change: 13.6% | |
| INSP Links: Profile News Message Board | |
| Charts:- Daily , Weekly | |
| Add INSP to Watchlist: View: Get Complete INSP Trend Analysis ➞ | |
 | APPN Appian Corporation |
| Sector: Technology | |
| SubSector: Application Software | |
| MarketCap: 2737.92 Millions | |
| Recent Price: 36.16 Smart Investing & Trading Score: 46 | |
| Day Percent Change: -1.36% Day Change: -0.50 | |
| Week Change: 4.54% Year-to-date Change: -4.0% | |
| APPN Links: Profile News Message Board | |
| Charts:- Daily , Weekly | |
| Add APPN to Watchlist: View: Get Complete APPN Trend Analysis ➞ | |
 | T AT&T Inc. |
| Sector: Technology | |
| SubSector: Telecom Services - Domestic | |
| MarketCap: 224847 Millions | |
| Recent Price: 16.58 Smart Investing & Trading Score: 44 | |
| Day Percent Change: -1.37% Day Change: -0.23 | |
| Week Change: 0.42% Year-to-date Change: -1.2% | |
| T Links: Profile News Message Board | |
| Charts:- Daily , Weekly | |
| Add T to Watchlist: View: Get Complete T Trend Analysis ➞ | |
 | QLYS Qualys, Inc. |
| Sector: Technology | |
| SubSector: Application Software | |
| MarketCap: 3475.02 Millions | |
| Recent Price: 169.74 Smart Investing & Trading Score: 57 | |
| Day Percent Change: -1.38% Day Change: -2.37 | |
| Week Change: 3.78% Year-to-date Change: -13.5% | |
| QLYS Links: Profile News Message Board | |
| Charts:- Daily , Weekly | |
| Add QLYS to Watchlist: View: Get Complete QLYS Trend Analysis ➞ | |
 | RPD Rapid7, Inc. |
| Sector: Technology | |
| SubSector: Application Software | |
| MarketCap: 1981.12 Millions | |
| Recent Price: 45.85 Smart Investing & Trading Score: 35 | |
| Day Percent Change: -1.38% Day Change: -0.64 | |
| Week Change: 3.48% Year-to-date Change: -19.7% | |
| RPD Links: Profile News Message Board | |
| Charts:- Daily , Weekly | |
| Add RPD to Watchlist: View: Get Complete RPD Trend Analysis ➞ | |
 | XRX Xerox Holdings Corporation |
| Sector: Technology | |
| SubSector: Information Technology Services | |
| MarketCap: 4077.48 Millions | |
| Recent Price: 14.18 Smart Investing & Trading Score: 0 | |
| Day Percent Change: -1.39% Day Change: -0.20 | |
| Week Change: -13.75% Year-to-date Change: -22.6% | |
| XRX Links: Profile News Message Board | |
| Charts:- Daily , Weekly | |
| Add XRX to Watchlist: View: Get Complete XRX Trend Analysis ➞ | |
 | FSLR First Solar, Inc. |
| Sector: Technology | |
| SubSector: Semiconductor - Specialized | |
| MarketCap: 3617.9 Millions | |
| Recent Price: 175.02 Smart Investing & Trading Score: 44 | |
| Day Percent Change: -1.39% Day Change: -2.46 | |
| Week Change: -0.01% Year-to-date Change: 1.6% | |
| FSLR Links: Profile News Message Board | |
| Charts:- Daily , Weekly | |
| Add FSLR to Watchlist: View: Get Complete FSLR Trend Analysis ➞ | |
 | MSGE Madison Square Garden Entertainment Corp. |
| Sector: Technology | |
| SubSector: Entertainment | |
| MarketCap: 18837 Millions | |
| Recent Price: 38.90 Smart Investing & Trading Score: 68 | |
| Day Percent Change: -1.42% Day Change: -0.56 | |
| Week Change: 2.91% Year-to-date Change: 22.3% | |
| MSGE Links: Profile News Message Board | |
| Charts:- Daily , Weekly | |
| Add MSGE to Watchlist: View: Get Complete MSGE Trend Analysis ➞ | |
 | INTU Intuit Inc. |
| Sector: Technology | |
| SubSector: Application Software | |
| MarketCap: 577035 Millions | |
| Recent Price: 626.39 Smart Investing & Trading Score: 55 | |
| Day Percent Change: -1.43% Day Change: -9.10 | |
| Week Change: 3.51% Year-to-date Change: 0.2% | |
| INTU Links: Profile News Message Board | |
| Charts:- Daily , Weekly | |
| Add INTU to Watchlist: View: Get Complete INTU Trend Analysis ➞ | |
 | OLO Olo Inc. |
| Sector: Technology | |
| SubSector: Software - Application | |
| MarketCap: 1030 Millions | |
| Recent Price: 4.84 Smart Investing & Trading Score: 31 | |
| Day Percent Change: -1.43% Day Change: -0.07 | |
| Week Change: 3.64% Year-to-date Change: -15.4% | |
| OLO Links: Profile News Message Board | |
| Charts:- Daily , Weekly | |
| Add OLO to Watchlist: View: Get Complete OLO Trend Analysis ➞ | |
 | UIS Unisys Corporation |
| Sector: Technology | |
| SubSector: Information Technology Services | |
| MarketCap: 803.868 Millions | |
| Recent Price: 5.46 Smart Investing & Trading Score: 35 | |
| Day Percent Change: -1.44% Day Change: -0.08 | |
| Week Change: -0.36% Year-to-date Change: -2.9% | |
| UIS Links: Profile News Message Board | |
| Charts:- Daily , Weekly | |
| Add UIS to Watchlist: View: Get Complete UIS Trend Analysis ➞ | |
| For tabular summary view of above stock list: Summary View ➞ 0 - 25 , 25 - 50 , 50 - 75 , 75 - 100 , 100 - 125 , 125 - 150 , 150 - 175 , 175 - 200 , 200 - 225 , 225 - 250 , 250 - 275 , 275 - 300 , 300 - 325 , 325 - 350 , 350 - 375 , 375 - 400 , 400 - 425 , 425 - 450 , 450 - 475 , 475 - 500 , 500 - 525 , 525 - 550 , 550 - 575 , 575 - 600 , 600 - 625 , 625 - 650 | ||
| Click To Change The Sort Order: By Market Cap or Company Size Performance: Year-to-date, Week and Day | |
| Select Chart Type: | ||
|
Best Stocks Today 12Stocks.com |
© 2024 12Stocks.com Terms & Conditions Privacy Contact Us
All Information Provided Only For Education And Not To Be Used For Investing or Trading. See Terms & Conditions


One More Thing ... Get Best Stocks Delivered Daily!
Never Ever Miss A Move With Our Top Ten Stocks Lists
Find Best Stocks In Any Market - Bull or Bear Market
Take A Peek At Our Top Ten Stocks Lists: Daily, Weekly, Year-to-Date & Top Trends
Find Best Stocks In Any Market - Bull or Bear Market
Take A Peek At Our Top Ten Stocks Lists: Daily, Weekly, Year-to-Date & Top Trends
Technology Stocks With Best Up Trends [0-bearish to 100-bullish]: HashiCorp [100], Teradyne [100], Karooooo [100], Cricut [100], Grab [100], Microchip [100], Sanmina [100], JD.com [100], EchoStar [100], Analog Devices[100], Allegro MicroSystems[100]
Best Technology Stocks Year-to-Date:
MediaCo Holding[390.61%], Super Micro[177%], Uxin [172.47%], Smith Micro[168.77%], CXApp [166.41%], CuriosityStream [103.67%], GigaCloud [97.54%], MicroStrategy [96.39%], SoundHound AI[94.39%], Cheetah Mobile[88.16%], NextNav [85.73%] Best Technology Stocks This Week:
Matterport [168.97%], Amesite [58.44%], HashiCorp [36.92%], Impinj [33.73%], WiMi Hologram[33.51%], Ribbon [25.58%], Cheetah Mobile[21.19%], on [20.61%], iQIYI [17.99%], SoundHound AI[17.18%], IonQ [15.37%] Best Technology Stocks Daily:
Impinj [28.65%], HashiCorp [10.69%], Tyler [9.32%], SiTime [8.84%], Cheetah Mobile[8.33%], on [8.21%], Teradyne [8.15%], Karooooo [7.84%], Viomi [7.13%], Comtech Tele[6.86%], CACI [5.93%]