
 Login Sign Up


| |||||
 |  | ||||

| 12Stocks.com Market Intelligence |
Best Tech Stocks
| In a hurry? Tech Stocks Lists: Performance & Trends, Stock Charts, FANG Stocks
Sort Tech stocks: Daily, Weekly, Year-to-Date, Market Cap & Trends. Filter Tech stocks list by size:All Tech Large Mid-Range Small and MicroCap |
| 12Stocks.com Tech Stocks Performances & Trends Daily | |||||||||
|
|  The overall Smart Investing & Trading Score is 0 (0-bearish to 100-bullish) which puts Technology sector in short term bearish trend. The Smart Investing & Trading Score from previous trading session is 13 and hence a deterioration of trend.
| ||||||||
Here are the Smart Investing & Trading Scores of the most requested Technology stocks at 12Stocks.com (click stock name for detailed review):
|


| 12Stocks.com: Investing in Technology sector with Stocks | |
|
The following table helps investors and traders sort through current performance and trends (as measured by Smart Investing & Trading Score) of various
stocks in the Tech sector. Quick View: Move mouse or cursor over stock symbol (ticker) to view short-term technical chart and over stock name to view long term chart. Click on  to add stock symbol to your watchlist and to add stock symbol to your watchlist and  to view watchlist. Click on any ticker or stock name for detailed market intelligence report for that stock. to view watchlist. Click on any ticker or stock name for detailed market intelligence report for that stock. |
12Stocks.com Performance of Stocks in Tech Sector
| Ticker | Stock Name | Watchlist | Category | Recent Price | Smart Investing & Trading Score | Change % | YTD Change% |
| ZETA | Zeta Global |   | Software - | 11.88 | 73 | 0.38 | 34.56% |
| CRSR | Corsair Gaming | | Computer Hardware | 10.79 | 17 | 0.37 | -23.53% |
| IBM | IBM | | IT | 182.12 | 10 | 0.36 | 11.35% |
| UPWK | Upwork | | Internet | 11.27 | 42 | 0.36 | -24.21% |
| BMI | Badger Meter | | Instruments | 179.10 | 100 | 0.35 | 16.02% |
| PAYC | Paycom Software | | Software | 185.51 | 10 | 0.35 | -10.26% |
| LILAK | Liberty Latin | | CATV | 7.22 | 76 | 0.35 | -1.57% |
| VZ | Verizon | | Telecom | 40.27 | 37 | 0.34 | 6.80% |
| AGYS | Agilysys | | Software | 82.03 | 28 | 0.34 | -3.29% |
| ATHM | Autohome | | Internet | 24.34 | 18 | 0.33 | -13.26% |
| TIXT | TELUS | | Software - Infrastructure | 7.93 | 17 | 0.32 | -7.25% |
| RDWR | Radware | | IT | 16.31 | 10 | 0.31 | -2.22% |
| CALX | Calix | | Communication | 29.53 | 28 | 0.31 | -32.41% |
| SANM | Sanmina | | Electronics | 58.40 | 35 | 0.30 | 13.68% |
| PTC | PTC | | Software | 176.23 | 10 | 0.30 | 0.73% |
| HCOM | Hawaiian Telcom | | Communication | 15.26 | 71 | 0.30 | 5.83% |
| AYI | Acuity Brands | | Electronics | 247.57 | 41 | 0.29 | 20.86% |
| SAIC | Science Applications | | IT | 123.54 | 18 | 0.29 | -0.63% |
| TEO | Telecom Argentina | | Communication | 7.04 | 10 | 0.28 | -1.54% |
| CDW | CDW | | IT | 236.35 | 36 | 0.28 | 3.97% |
| DAKT | Daktronics | | Computer Based | 9.24 | 58 | 0.27 | 9.02% |
| HCKT | Hackett | | IT | 22.53 | 18 | 0.27 | -1.05% |
| GDDY | GoDaddy | | Internet | 121.68 | 46 | 0.27 | 14.61% |
| TASK | TaskUs | | IT | 11.11 | 30 | 0.27 | -16.72% |
| PLXS | Plexus | | Circuit Boards | 93.42 | 20 | 0.26 | -13.60% |
| For chart view version of above stock list: Chart View ➞ 0 - 25 , 25 - 50 , 50 - 75 , 75 - 100 , 100 - 125 , 125 - 150 , 150 - 175 , 175 - 200 , 200 - 225 , 225 - 250 , 250 - 275 , 275 - 300 , 300 - 325 , 325 - 350 , 350 - 375 , 375 - 400 , 400 - 425 , 425 - 450 , 450 - 475 , 475 - 500 , 500 - 525 , 525 - 550 , 550 - 575 , 575 - 600 , 600 - 625 | ||
 | Click To Change The Sort Order: By Market Cap or Company Size Performance: Year-to-date, Week and Day |  |
|
Get the most comprehensive stock market coverage daily at 12Stocks.com ➞ Best Stocks Today ➞ Best Stocks Weekly ➞ Best Stocks Year-to-Date ➞ Best Stocks Trends ➞  Best Stocks Today 12Stocks.com Best Nasdaq Stocks ➞ Best S&P 500 Stocks ➞ Best Tech Stocks ➞ Best Biotech Stocks ➞ |
| Detailed Overview of Tech Stocks |
| Tech Technical Overview, Leaders & Laggards, Top Tech ETF Funds & Detailed Tech Stocks List, Charts, Trends & More |
| Tech Sector: Technical Analysis, Trends & YTD Performance | |
| Technology sector is composed of stocks
from semiconductors, software, web, social media
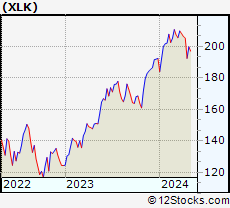
and services subsectors. Technology sector, as represented by XLK, an exchange-traded fund [ETF] that holds basket of tech stocks (e.g, Intel, Google) is up by 1.28% and is currently underperforming the overall market by -2.8% year-to-date. Below is a quick view of technical charts and trends: |
|
 XLK Weekly Chart |
|
| Long Term Trend: Not Good | |
| Medium Term Trend: Not Good | |
 XLK Daily Chart |
|
| Short Term Trend: Not Good | |
| Overall Trend Score: 0 | |
| YTD Performance: 1.28% | |
| **Trend Scores & Views Are Only For Educational Purposes And Not For Investing | |
| 12Stocks.com: Top Performing Technology Sector Stocks | ||||||||||||||||||||||||||||||||||||||||||||||||
 The top performing Technology sector stocks year to date are
Now, more recently, over last week, the top performing Technology sector stocks on the move are


|
||||||||||||||||||||||||||||||||||||||||||||||||
| 12Stocks.com: Investing in Tech Sector using Exchange Traded Funds | |
|
The following table shows list of key exchange traded funds (ETF) that
help investors track Tech Index. For detailed view, check out our ETF Funds section of our website. Quick View: Move mouse or cursor over ETF symbol (ticker) to view short-term technical chart and over ETF name to view long term chart. Click on ticker or stock name for detailed view. Click on to add stock symbol to your watchlist and to view watchlist. |
12Stocks.com List of ETFs that track Tech Index
| Ticker | ETF Name | Watchlist | Recent Price | Smart Investing & Trading Score | Change % | Week % | Year-to-date % |
| XLK | Technology | | 194.95 | 0 | -0.83 | -5.1 | 1.28% |
| TQQQ | QQQ | | 51.23 | 0 | -2.87 | -12.75 | 1.06% |
| SQQQ | Short QQQ | | 12.44 | 69 | 3.07 | 14.23 | -7.51% |
| SOXL | Semicondct Bull 3X | | 33.34 | 26 | -4.50 | -19.68 | 6.18% |
| SMH | Semiconductor | | 205.29 | 26 | -1.60 | -6.97 | 17.4% |
| 12Stocks.com: Charts, Trends, Fundamental Data and Performances of Tech Stocks | |
|
We now take in-depth look at all Tech stocks including charts, multi-period performances and overall trends (as measured by Smart Investing & Trading Score). One can sort Tech stocks (click link to choose) by Daily, Weekly and by Year-to-Date performances. Also, one can sort by size of the company or by market capitalization. |
| Select Your Default Chart Type: | |||||
| |||||
| Click on stock symbol or name for detailed view. Click on to add stock symbol to your watchlist and to view watchlist. Quick View: Move mouse or cursor over "Daily" to quickly view daily technical stock chart and over "Weekly" to view weekly technical stock chart. | |||||


 | ZETA Zeta Global Holdings Corp. |
| Sector: Technology | |
| SubSector: Software - Application | |
| MarketCap: 1780 Millions | |
| Recent Price: 11.88 Smart Investing & Trading Score: 73 | |
| Day Percent Change: 0.38% Day Change: 0.04 | |
| Week Change: -0.71% Year-to-date Change: 34.6% | |
| ZETA Links: Profile News Message Board | |
| Charts:- Daily , Weekly | |
| Add ZETA to Watchlist: View: Get Complete ZETA Trend Analysis ➞ | |
 | CRSR Corsair Gaming, Inc. |
| Sector: Technology | |
| SubSector: Computer Hardware | |
| MarketCap: 32187 Millions | |
| Recent Price: 10.79 Smart Investing & Trading Score: 17 | |
| Day Percent Change: 0.37% Day Change: 0.04 | |
| Week Change: -6.5% Year-to-date Change: -23.5% | |
| CRSR Links: Profile News Message Board | |
| Charts:- Daily , Weekly | |
| Add CRSR to Watchlist: View: Get Complete CRSR Trend Analysis ➞ | |
 | IBM International Business Machines Corporation |
| Sector: Technology | |
| SubSector: Information Technology Services | |
| MarketCap: 97241.6 Millions | |
| Recent Price: 182.12 Smart Investing & Trading Score: 10 | |
| Day Percent Change: 0.36% Day Change: 0.65 | |
| Week Change: -0.09% Year-to-date Change: 11.4% | |
| IBM Links: Profile News Message Board | |
| Charts:- Daily , Weekly | |
| Add IBM to Watchlist: View: Get Complete IBM Trend Analysis ➞ | |
 | UPWK Upwork Inc. |
| Sector: Technology | |
| SubSector: Internet Information Providers | |
| MarketCap: 815.98 Millions | |
| Recent Price: 11.27 Smart Investing & Trading Score: 42 | |
| Day Percent Change: 0.36% Day Change: 0.04 | |
| Week Change: -3.1% Year-to-date Change: -24.2% | |
| UPWK Links: Profile News Message Board | |
| Charts:- Daily , Weekly | |
| Add UPWK to Watchlist: View: Get Complete UPWK Trend Analysis ➞ | |
 | BMI Badger Meter, Inc. |
| Sector: Technology | |
| SubSector: Scientific & Technical Instruments | |
| MarketCap: 1530.53 Millions | |
| Recent Price: 179.10 Smart Investing & Trading Score: 100 | |
| Day Percent Change: 0.35% Day Change: 0.62 | |
| Week Change: 17.13% Year-to-date Change: 16.0% | |
| BMI Links: Profile News Message Board | |
| Charts:- Daily , Weekly | |
| Add BMI to Watchlist: View: Get Complete BMI Trend Analysis ➞ | |
 | PAYC Paycom Software, Inc. |
| Sector: Technology | |
| SubSector: Application Software | |
| MarketCap: 13041.6 Millions | |
| Recent Price: 185.51 Smart Investing & Trading Score: 10 | |
| Day Percent Change: 0.35% Day Change: 0.64 | |
| Week Change: -6.31% Year-to-date Change: -10.3% | |
| PAYC Links: Profile News Message Board | |
| Charts:- Daily , Weekly | |
| Add PAYC to Watchlist: View: Get Complete PAYC Trend Analysis ➞ | |
 | LILAK Liberty Latin America Ltd. |
| Sector: Technology | |
| SubSector: CATV Systems | |
| MarketCap: 1210.32 Millions | |
| Recent Price: 7.22 Smart Investing & Trading Score: 76 | |
| Day Percent Change: 0.35% Day Change: 0.02 | |
| Week Change: -0.21% Year-to-date Change: -1.6% | |
| LILAK Links: Profile News Message Board | |
| Charts:- Daily , Weekly | |
| Add LILAK to Watchlist: View: Get Complete LILAK Trend Analysis ➞ | |
 | VZ Verizon Communications Inc. |
| Sector: Technology | |
| SubSector: Telecom Services - Domestic | |
| MarketCap: 229427 Millions | |
| Recent Price: 40.27 Smart Investing & Trading Score: 37 | |
| Day Percent Change: 0.34% Day Change: 0.13 | |
| Week Change: 1.37% Year-to-date Change: 6.8% | |
| VZ Links: Profile News Message Board | |
| Charts:- Daily , Weekly | |
| Add VZ to Watchlist: View: Get Complete VZ Trend Analysis ➞ | |
 | AGYS Agilysys, Inc. |
| Sector: Technology | |
| SubSector: Application Software | |
| MarketCap: 391.862 Millions | |
| Recent Price: 82.03 Smart Investing & Trading Score: 28 | |
| Day Percent Change: 0.34% Day Change: 0.28 | |
| Week Change: -0.44% Year-to-date Change: -3.3% | |
| AGYS Links: Profile News Message Board | |
| Charts:- Daily , Weekly | |
| Add AGYS to Watchlist: View: Get Complete AGYS Trend Analysis ➞ | |
 | ATHM Autohome Inc. |
| Sector: Technology | |
| SubSector: Internet Information Providers | |
| MarketCap: 7984.2 Millions | |
| Recent Price: 24.34 Smart Investing & Trading Score: 18 | |
| Day Percent Change: 0.33% Day Change: 0.08 | |
| Week Change: -3.57% Year-to-date Change: -13.3% | |
| ATHM Links: Profile News Message Board | |
| Charts:- Daily , Weekly | |
| Add ATHM to Watchlist: View: Get Complete ATHM Trend Analysis ➞ | |
 | TIXT TELUS International (Cda) Inc. |
| Sector: Technology | |
| SubSector: Software - Infrastructure | |
| MarketCap: 1470 Millions | |
| Recent Price: 7.93 Smart Investing & Trading Score: 17 | |
| Day Percent Change: 0.32% Day Change: 0.02 | |
| Week Change: -7.47% Year-to-date Change: -7.3% | |
| TIXT Links: Profile News Message Board | |
| Charts:- Daily , Weekly | |
| Add TIXT to Watchlist: View: Get Complete TIXT Trend Analysis ➞ | |
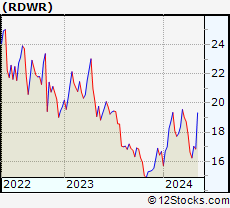 | RDWR Radware Ltd. |
| Sector: Technology | |
| SubSector: Information Technology Services | |
| MarketCap: 974.168 Millions | |
| Recent Price: 16.31 Smart Investing & Trading Score: 10 | |
| Day Percent Change: 0.31% Day Change: 0.05 | |
| Week Change: -1.92% Year-to-date Change: -2.2% | |
| RDWR Links: Profile News Message Board | |
| Charts:- Daily , Weekly | |
| Add RDWR to Watchlist: View: Get Complete RDWR Trend Analysis ➞ | |
 | CALX Calix, Inc. |
| Sector: Technology | |
| SubSector: Communication Equipment | |
| MarketCap: 390.039 Millions | |
| Recent Price: 29.53 Smart Investing & Trading Score: 28 | |
| Day Percent Change: 0.31% Day Change: 0.09 | |
| Week Change: -2.51% Year-to-date Change: -32.4% | |
| CALX Links: Profile News Message Board | |
| Charts:- Daily , Weekly | |
| Add CALX to Watchlist: View: Get Complete CALX Trend Analysis ➞ | |
 | SANM Sanmina Corporation |
| Sector: Technology | |
| SubSector: Diversified Electronics | |
| MarketCap: 1790.36 Millions | |
| Recent Price: 58.40 Smart Investing & Trading Score: 35 | |
| Day Percent Change: 0.30% Day Change: 0.18 | |
| Week Change: 0.37% Year-to-date Change: 13.7% | |
| SANM Links: Profile News Message Board | |
| Charts:- Daily , Weekly | |
| Add SANM to Watchlist: View: Get Complete SANM Trend Analysis ➞ | |
 | PTC PTC Inc. |
| Sector: Technology | |
| SubSector: Technical & System Software | |
| MarketCap: 6166.7 Millions | |
| Recent Price: 176.23 Smart Investing & Trading Score: 10 | |
| Day Percent Change: 0.30% Day Change: 0.53 | |
| Week Change: -2.13% Year-to-date Change: 0.7% | |
| PTC Links: Profile News Message Board | |
| Charts:- Daily , Weekly | |
| Add PTC to Watchlist: View: Get Complete PTC Trend Analysis ➞ | |
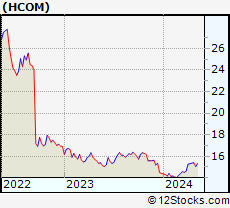 | HCOM Hawaiian Telcom Holdco, Inc. |
| Sector: Technology | |
| SubSector: Diversified Communication Services | |
| MarketCap: 272.82 Millions | |
| Recent Price: 15.26 Smart Investing & Trading Score: 71 | |
| Day Percent Change: 0.30% Day Change: 0.04 | |
| Week Change: -0.39% Year-to-date Change: 5.8% | |
| HCOM Links: Profile News Message Board | |
| Charts:- Daily , Weekly | |
| Add HCOM to Watchlist: View: Get Complete HCOM Trend Analysis ➞ | |
 | AYI Acuity Brands, Inc. |
| Sector: Technology | |
| SubSector: Diversified Electronics | |
| MarketCap: 3356.66 Millions | |
| Recent Price: 247.57 Smart Investing & Trading Score: 41 | |
| Day Percent Change: 0.29% Day Change: 0.70 | |
| Week Change: -3.89% Year-to-date Change: 20.9% | |
| AYI Links: Profile News Message Board | |
| Charts:- Daily , Weekly | |
| Add AYI to Watchlist: View: Get Complete AYI Trend Analysis ➞ | |
 | SAIC Science Applications International Corporation |
| Sector: Technology | |
| SubSector: Information Technology Services | |
| MarketCap: 3388.78 Millions | |
| Recent Price: 123.54 Smart Investing & Trading Score: 18 | |
| Day Percent Change: 0.29% Day Change: 0.36 | |
| Week Change: -0.03% Year-to-date Change: -0.6% | |
| SAIC Links: Profile News Message Board | |
| Charts:- Daily , Weekly | |
| Add SAIC to Watchlist: View: Get Complete SAIC Trend Analysis ➞ | |
 | TEO Telecom Argentina S.A. |
| Sector: Technology | |
| SubSector: Diversified Communication Services | |
| MarketCap: 1508.64 Millions | |
| Recent Price: 7.04 Smart Investing & Trading Score: 10 | |
| Day Percent Change: 0.28% Day Change: 0.02 | |
| Week Change: -6.63% Year-to-date Change: -1.5% | |
| TEO Links: Profile News Message Board | |
| Charts:- Daily , Weekly | |
| Add TEO to Watchlist: View: Get Complete TEO Trend Analysis ➞ | |
 | CDW CDW Corporation |
| Sector: Technology | |
| SubSector: Information Technology Services | |
| MarketCap: 12775 Millions | |
| Recent Price: 236.35 Smart Investing & Trading Score: 36 | |
| Day Percent Change: 0.28% Day Change: 0.66 | |
| Week Change: -2.7% Year-to-date Change: 4.0% | |
| CDW Links: Profile News Message Board | |
| Charts:- Daily , Weekly | |
| Add CDW to Watchlist: View: Get Complete CDW Trend Analysis ➞ | |
 | DAKT Daktronics, Inc. |
| Sector: Technology | |
| SubSector: Computer Based Systems | |
| MarketCap: 223.539 Millions | |
| Recent Price: 9.24 Smart Investing & Trading Score: 58 | |
| Day Percent Change: 0.27% Day Change: 0.02 | |
| Week Change: -2.48% Year-to-date Change: 9.0% | |
| DAKT Links: Profile News Message Board | |
| Charts:- Daily , Weekly | |
| Add DAKT to Watchlist: View: Get Complete DAKT Trend Analysis ➞ | |
 | HCKT The Hackett Group, Inc. |
| Sector: Technology | |
| SubSector: Information Technology Services | |
| MarketCap: 334.468 Millions | |
| Recent Price: 22.53 Smart Investing & Trading Score: 18 | |
| Day Percent Change: 0.27% Day Change: 0.06 | |
| Week Change: -0.79% Year-to-date Change: -1.1% | |
| HCKT Links: Profile News Message Board | |
| Charts:- Daily , Weekly | |
| Add HCKT to Watchlist: View: Get Complete HCKT Trend Analysis ➞ | |
 | GDDY GoDaddy Inc. |
| Sector: Technology | |
| SubSector: Internet Software & Services | |
| MarketCap: 9570.51 Millions | |
| Recent Price: 121.68 Smart Investing & Trading Score: 46 | |
| Day Percent Change: 0.27% Day Change: 0.33 | |
| Week Change: -1.32% Year-to-date Change: 14.6% | |
| GDDY Links: Profile News Message Board | |
| Charts:- Daily , Weekly | |
| Add GDDY to Watchlist: View: Get Complete GDDY Trend Analysis ➞ | |
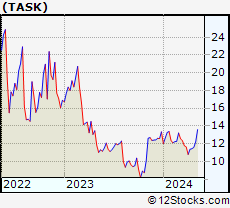 | TASK TaskUs, Inc. |
| Sector: Technology | |
| SubSector: Information Technology Services | |
| MarketCap: 1050 Millions | |
| Recent Price: 11.11 Smart Investing & Trading Score: 30 | |
| Day Percent Change: 0.27% Day Change: 0.03 | |
| Week Change: -2.29% Year-to-date Change: -16.7% | |
| TASK Links: Profile News Message Board | |
| Charts:- Daily , Weekly | |
| Add TASK to Watchlist: View: Get Complete TASK Trend Analysis ➞ | |
 | PLXS Plexus Corp. |
| Sector: Technology | |
| SubSector: Printed Circuit Boards | |
| MarketCap: 1457.15 Millions | |
| Recent Price: 93.42 Smart Investing & Trading Score: 20 | |
| Day Percent Change: 0.26% Day Change: 0.24 | |
| Week Change: -2.27% Year-to-date Change: -13.6% | |
| PLXS Links: Profile News Message Board | |
| Charts:- Daily , Weekly | |
| Add PLXS to Watchlist: View: Get Complete PLXS Trend Analysis ➞ | |
| For tabular summary view of above stock list: Summary View ➞ 0 - 25 , 25 - 50 , 50 - 75 , 75 - 100 , 100 - 125 , 125 - 150 , 150 - 175 , 175 - 200 , 200 - 225 , 225 - 250 , 250 - 275 , 275 - 300 , 300 - 325 , 325 - 350 , 350 - 375 , 375 - 400 , 400 - 425 , 425 - 450 , 450 - 475 , 475 - 500 , 500 - 525 , 525 - 550 , 550 - 575 , 575 - 600 , 600 - 625 | ||
| Click To Change The Sort Order: By Market Cap or Company Size Performance: Year-to-date, Week and Day | |
| Select Chart Type: | ||
|
Best Stocks Today 12Stocks.com |
© 2024 12Stocks.com Terms & Conditions Privacy Contact Us
All Information Provided Only For Education And Not To Be Used For Investing or Trading. See Terms & Conditions


One More Thing ... Get Best Stocks Delivered Daily!
Never Ever Miss A Move With Our Top Ten Stocks Lists
Find Best Stocks In Any Market - Bull or Bear Market
Take A Peek At Our Top Ten Stocks Lists: Daily, Weekly, Year-to-Date & Top Trends
Find Best Stocks In Any Market - Bull or Bear Market
Take A Peek At Our Top Ten Stocks Lists: Daily, Weekly, Year-to-Date & Top Trends
Technology Stocks With Best Up Trends [0-bearish to 100-bullish]: Karooooo [100], Payoneer Global[100], Badger Meter[100], EchoStar [100], Turkcell Iletisim[93], Grab [93], Full Truck[93], Zuora [93], GDS [88], GigaCloud [88], Snap One[88]
Best Technology Stocks Year-to-Date:
MediaCo Holding[544.37%], Super Micro[176.22%], CXApp [157.92%], Uxin [141.08%], CuriosityStream [107.37%], GigaCloud [95.49%], MicroStrategy [91.4%], D-Wave Quantum[89.2%], NextNav [78.76%], SoundHound AI[73.83%], AppLovin [69.92%] Best Technology Stocks This Week:
Snap One[29.79%], Badger Meter[17.13%], Mynaric AG[11.76%], SYLA [9.96%], Encore Wire[9.86%], Zuora [9.36%], Quhuo [8.87%], Iridium [8.72%], Applied Optoelectronics[8.28%], Bentley Systems[7.96%], Expensify [7.82%] Best Technology Stocks Daily:
CuriosityStream [10.89%], Tigo Energy[8.62%], Cheetah Mobile[7.12%], Markforged Holding[6.04%], CXApp [5.36%], Applied Optoelectronics[4.29%], MediaCo Holding[3.58%], Perficient [3.49%], Bitdeer [3.26%], QuinStreet [3.21%], Karooooo [3.20%]