
 Login Sign Up


| |||||
 |  | ||||

| 12Stocks.com Market Intelligence |
Best Tech Stocks
| In a hurry? Tech Stocks Lists: Performance & Trends, Stock Charts, FANG Stocks
Sort Tech stocks: Daily, Weekly, Year-to-Date, Market Cap & Trends. Filter Tech stocks list by size:All Tech Large Mid-Range Small and MicroCap |
| 12Stocks.com Tech Stocks Performances & Trends Daily | |||||||||
|
|  The overall Smart Investing & Trading Score is 10 (0-bearish to 100-bullish) which puts Technology sector in short term bearish trend. The Smart Investing & Trading Score from previous trading session is 0 and hence an improvement of trend.
| ||||||||
Here are the Smart Investing & Trading Scores of the most requested Technology stocks at 12Stocks.com (click stock name for detailed review):
|


| 12Stocks.com: Investing in Technology sector with Stocks | |
|
The following table helps investors and traders sort through current performance and trends (as measured by Smart Investing & Trading Score) of various
stocks in the Tech sector. Quick View: Move mouse or cursor over stock symbol (ticker) to view short-term technical chart and over stock name to view long term chart. Click on  to add stock symbol to your watchlist and to add stock symbol to your watchlist and  to view watchlist. Click on any ticker or stock name for detailed market intelligence report for that stock. to view watchlist. Click on any ticker or stock name for detailed market intelligence report for that stock. |
12Stocks.com Performance of Stocks in Tech Sector
| Ticker | Stock Name | Watchlist | Category | Recent Price | Smart Investing & Trading Score | Change % | YTD Change% |
| NXPI | NXP Semiconductors |   | Semiconductor | 218.66 | 36 | 1.65 | -4.80% |
| LILA | Liberty Latin | | CATV | 7.41 | 100 | 1.65 | 1.37% |
| LILAK | Liberty Latin | | CATV | 7.38 | 100 | 1.65 | 0.54% |
| SANM | Sanmina | | Electronics | 58.74 | 35 | 1.64 | 14.35% |
| AVGO | Broadcom | | Semiconductor | 1224.46 | 26 | 1.64 | 9.69% |
| MSI | Motorola | | Communication | 345.23 | 70 | 1.64 | 10.27% |
| DDOG | Datadog | | Software | 122.07 | 17 | 1.64 | 0.57% |
| KD | Kyndryl | | IT | 19.98 | 32 | 1.63 | -4.58% |
| QCOM | QUALCOMM | | Communication | 160.18 | 48 | 1.62 | 10.75% |
| AMKR | Amkor | | Semiconductor | 28.96 | 10 | 1.61 | -12.95% |
| ADI | Analog Devices | | Semiconductor | 186.31 | 17 | 1.61 | -6.17% |
| TSM | Taiwan Semiconductor | | Semiconductor | 129.75 | 31 | 1.61 | 24.76% |
| OLED | Universal Display | | Semiconductor | 152.22 | 35 | 1.61 | -20.41% |
| APP | AppLovin | | Software - | 67.87 | 36 | 1.60 | 70.55% |
| VRNS | Varonis Systems | | Software | 44.03 | 32 | 1.59 | -2.76% |
| GRVY | Gravity Co | | Software | 67.49 | 58 | 1.58 | -2.98% |
| WK | Workiva | | Software | 79.09 | 49 | 1.58 | -22.10% |
| PRGS | Progress Software | | Software | 51.19 | 57 | 1.55 | -5.73% |
| MPWR | Monolithic Power | | Semiconductor | 600.63 | 13 | 1.54 | -4.78% |
| APH | Amphenol | | Electronics | 111.86 | 56 | 1.53 | 12.84% |
| APPN | Appian | | Software | 35.12 | 53 | 1.53 | -6.74% |
| BHE | Benchmark Electronics | | Circuit Boards | 30.08 | 75 | 1.52 | 8.83% |
| DIOD | Diodes | | Semiconductor | 67.91 | 86 | 1.52 | -15.66% |
| ENTG | Entegris | | Semiconductor | 124.04 | 36 | 1.51 | 3.52% |
| WDC | Western Digital | | Data Storage | 67.05 | 31 | 1.51 | 28.03% |
| For chart view version of above stock list: Chart View ➞ 0 - 25 , 25 - 50 , 50 - 75 , 75 - 100 , 100 - 125 , 125 - 150 , 150 - 175 , 175 - 200 , 200 - 225 , 225 - 250 , 250 - 275 , 275 - 300 , 300 - 325 , 325 - 350 , 350 - 375 , 375 - 400 , 400 - 425 , 425 - 450 , 450 - 475 , 475 - 500 , 500 - 525 , 525 - 550 , 550 - 575 , 575 - 600 , 600 - 625 , 625 - 650 | ||
 | Click To Change The Sort Order: By Market Cap or Company Size Performance: Year-to-date, Week and Day |  |
|
Get the most comprehensive stock market coverage daily at 12Stocks.com ➞ Best Stocks Today ➞ Best Stocks Weekly ➞ Best Stocks Year-to-Date ➞ Best Stocks Trends ➞  Best Stocks Today 12Stocks.com Best Nasdaq Stocks ➞ Best S&P 500 Stocks ➞ Best Tech Stocks ➞ Best Biotech Stocks ➞ |
| Detailed Overview of Tech Stocks |
| Tech Technical Overview, Leaders & Laggards, Top Tech ETF Funds & Detailed Tech Stocks List, Charts, Trends & More |
| Tech Sector: Technical Analysis, Trends & YTD Performance | |
| Technology sector is composed of stocks
from semiconductors, software, web, social media
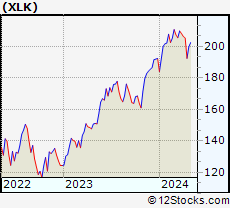
and services subsectors. Technology sector, as represented by XLK, an exchange-traded fund [ETF] that holds basket of tech stocks (e.g, Intel, Google) is up by 0.92% and is currently underperforming the overall market by -3.47% year-to-date. Below is a quick view of technical charts and trends: |
|
 XLK Weekly Chart |
|
| Long Term Trend: Not Good | |
| Medium Term Trend: Not Good | |
 XLK Daily Chart |
|
| Short Term Trend: Not Good | |
| Overall Trend Score: 10 | |
| YTD Performance: 0.92% | |
| **Trend Scores & Views Are Only For Educational Purposes And Not For Investing | |
| 12Stocks.com: Top Performing Technology Sector Stocks | ||||||||||||||||||||||||||||||||||||||||||||||||
 The top performing Technology sector stocks year to date are
Now, more recently, over last week, the top performing Technology sector stocks on the move are


|
||||||||||||||||||||||||||||||||||||||||||||||||
| 12Stocks.com: Investing in Tech Sector using Exchange Traded Funds | |
|
The following table shows list of key exchange traded funds (ETF) that
help investors track Tech Index. For detailed view, check out our ETF Funds section of our website. Quick View: Move mouse or cursor over ETF symbol (ticker) to view short-term technical chart and over ETF name to view long term chart. Click on ticker or stock name for detailed view. Click on to add stock symbol to your watchlist and to view watchlist. |
12Stocks.com List of ETFs that track Tech Index
| Ticker | ETF Name | Watchlist | Recent Price | Smart Investing & Trading Score | Change % | Week % | Year-to-date % |
| XLK | Technology | | 194.25 | 10 | 0.89 | 0.89 | 0.92% |
| QQQ | QQQ | | 414.32 | 13 | -0.08 | -0.08 | 1.17% |
| IYW | Technology | | 126.24 | 23 | 1.19 | 1.19 | 2.84% |
| VGT | Information Technology | | 486.46 | 10 | 1.37 | 1.37 | 0.51% |
| IXN | Global Tech | | 69.38 | 23 | 0.96 | 0.96 | 1.76% |
| IGV | Tech-Software | | 79.48 | 25 | 1.21 | 1.21 | -2.03% |
| XSD | Semiconductor | | 206.62 | 10 | 1.50 | 1.5 | -8.08% |
| TQQQ | QQQ | | 50.92 | 10 | 2.91 | 2.91 | 0.43% |
| SQQQ | Short QQQ | | 12.47 | 64 | -2.88 | -2.88 | -7.29% |
| SOXL | Semicondct Bull 3X | | 32.07 | 23 | 4.16 | 4.16 | 2.13% |
| SOXS | Semicondct Bear 3X | | 43.97 | 80 | -4.68 | -4.68 | 655.5% |
| SOXX | PHLX Semiconductor | | 201.66 | 36 | 1.65 | 1.65 | 5.01% |
| QTEC | First -100-Tech | | 176.36 | 10 | 1.39 | 1.39 | 0.51% |
| SMH | Semiconductor | | 203.02 | 36 | 1.91 | 1.91 | 16.1% |
| 12Stocks.com: Charts, Trends, Fundamental Data and Performances of Tech Stocks | |
|
We now take in-depth look at all Tech stocks including charts, multi-period performances and overall trends (as measured by Smart Investing & Trading Score). One can sort Tech stocks (click link to choose) by Daily, Weekly and by Year-to-Date performances. Also, one can sort by size of the company or by market capitalization. |
| Select Your Default Chart Type: | |||||
| |||||
| Click on stock symbol or name for detailed view. Click on to add stock symbol to your watchlist and to view watchlist. Quick View: Move mouse or cursor over "Daily" to quickly view daily technical stock chart and over "Weekly" to view weekly technical stock chart. | |||||


 | NXPI NXP Semiconductors N.V. |
| Sector: Technology | |
| SubSector: Semiconductor - Broad Line | |
| MarketCap: 22497.9 Millions | |
| Recent Price: 218.66 Smart Investing & Trading Score: 36 | |
| Day Percent Change: 1.65% Day Change: 3.54 | |
| Week Change: 1.65% Year-to-date Change: -4.8% | |
| NXPI Links: Profile News Message Board | |
| Charts:- Daily , Weekly | |
| Add NXPI to Watchlist: View: Get Complete NXPI Trend Analysis ➞ | |
 | LILA Liberty Latin America Ltd. |
| Sector: Technology | |
| SubSector: CATV Systems | |
| MarketCap: 2092.62 Millions | |
| Recent Price: 7.41 Smart Investing & Trading Score: 100 | |
| Day Percent Change: 1.65% Day Change: 0.12 | |
| Week Change: 1.65% Year-to-date Change: 1.4% | |
| LILA Links: Profile News Message Board | |
| Charts:- Daily , Weekly | |
| Add LILA to Watchlist: View: Get Complete LILA Trend Analysis ➞ | |
 | LILAK Liberty Latin America Ltd. |
| Sector: Technology | |
| SubSector: CATV Systems | |
| MarketCap: 1210.32 Millions | |
| Recent Price: 7.38 Smart Investing & Trading Score: 100 | |
| Day Percent Change: 1.65% Day Change: 0.12 | |
| Week Change: 1.65% Year-to-date Change: 0.5% | |
| LILAK Links: Profile News Message Board | |
| Charts:- Daily , Weekly | |
| Add LILAK to Watchlist: View: Get Complete LILAK Trend Analysis ➞ | |
 | SANM Sanmina Corporation |
| Sector: Technology | |
| SubSector: Diversified Electronics | |
| MarketCap: 1790.36 Millions | |
| Recent Price: 58.74 Smart Investing & Trading Score: 35 | |
| Day Percent Change: 1.64% Day Change: 0.95 | |
| Week Change: 1.64% Year-to-date Change: 14.4% | |
| SANM Links: Profile News Message Board | |
| Charts:- Daily , Weekly | |
| Add SANM to Watchlist: View: Get Complete SANM Trend Analysis ➞ | |
 | AVGO Broadcom Inc. |
| Sector: Technology | |
| SubSector: Semiconductor - Broad Line | |
| MarketCap: 86329.1 Millions | |
| Recent Price: 1224.46 Smart Investing & Trading Score: 26 | |
| Day Percent Change: 1.64% Day Change: 19.75 | |
| Week Change: 1.64% Year-to-date Change: 9.7% | |
| AVGO Links: Profile News Message Board | |
| Charts:- Daily , Weekly | |
| Add AVGO to Watchlist: View: Get Complete AVGO Trend Analysis ➞ | |
 | MSI Motorola Solutions, Inc. |
| Sector: Technology | |
| SubSector: Communication Equipment | |
| MarketCap: 26573.3 Millions | |
| Recent Price: 345.23 Smart Investing & Trading Score: 70 | |
| Day Percent Change: 1.64% Day Change: 5.58 | |
| Week Change: 1.64% Year-to-date Change: 10.3% | |
| MSI Links: Profile News Message Board | |
| Charts:- Daily , Weekly | |
| Add MSI to Watchlist: View: Get Complete MSI Trend Analysis ➞ | |
 | DDOG Datadog, Inc. |
| Sector: Technology | |
| SubSector: Application Software | |
| MarketCap: 10653.2 Millions | |
| Recent Price: 122.07 Smart Investing & Trading Score: 17 | |
| Day Percent Change: 1.64% Day Change: 1.97 | |
| Week Change: 1.64% Year-to-date Change: 0.6% | |
| DDOG Links: Profile News Message Board | |
| Charts:- Daily , Weekly | |
| Add DDOG to Watchlist: View: Get Complete DDOG Trend Analysis ➞ | |
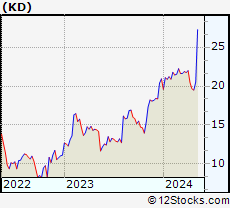 | KD Kyndryl Holdings, Inc. |
| Sector: Technology | |
| SubSector: Information Technology Services | |
| MarketCap: 2990 Millions | |
| Recent Price: 19.98 Smart Investing & Trading Score: 32 | |
| Day Percent Change: 1.63% Day Change: 0.32 | |
| Week Change: 1.63% Year-to-date Change: -4.6% | |
| KD Links: Profile News Message Board | |
| Charts:- Daily , Weekly | |
| Add KD to Watchlist: View: Get Complete KD Trend Analysis ➞ | |
 | QCOM QUALCOMM Incorporated |
| Sector: Technology | |
| SubSector: Communication Equipment | |
| MarketCap: 77517.7 Millions | |
| Recent Price: 160.18 Smart Investing & Trading Score: 48 | |
| Day Percent Change: 1.62% Day Change: 2.55 | |
| Week Change: 1.62% Year-to-date Change: 10.8% | |
| QCOM Links: Profile News Message Board | |
| Charts:- Daily , Weekly | |
| Add QCOM to Watchlist: View: Get Complete QCOM Trend Analysis ➞ | |
 | AMKR Amkor Technology, Inc. |
| Sector: Technology | |
| SubSector: Semiconductor - Integrated Circuits | |
| MarketCap: 1966.2 Millions | |
| Recent Price: 28.96 Smart Investing & Trading Score: 10 | |
| Day Percent Change: 1.61% Day Change: 0.46 | |
| Week Change: 1.61% Year-to-date Change: -13.0% | |
| AMKR Links: Profile News Message Board | |
| Charts:- Daily , Weekly | |
| Add AMKR to Watchlist: View: Get Complete AMKR Trend Analysis ➞ | |
 | ADI Analog Devices, Inc. |
| Sector: Technology | |
| SubSector: Semiconductor - Integrated Circuits | |
| MarketCap: 32859 Millions | |
| Recent Price: 186.31 Smart Investing & Trading Score: 17 | |
| Day Percent Change: 1.61% Day Change: 2.95 | |
| Week Change: 1.61% Year-to-date Change: -6.2% | |
| ADI Links: Profile News Message Board | |
| Charts:- Daily , Weekly | |
| Add ADI to Watchlist: View: Get Complete ADI Trend Analysis ➞ | |
 | TSM Taiwan Semiconductor Manufacturing Company Limited |
| Sector: Technology | |
| SubSector: Semiconductor - Integrated Circuits | |
| MarketCap: 239384 Millions | |
| Recent Price: 129.75 Smart Investing & Trading Score: 31 | |
| Day Percent Change: 1.61% Day Change: 2.05 | |
| Week Change: 1.61% Year-to-date Change: 24.8% | |
| TSM Links: Profile News Message Board | |
| Charts:- Daily , Weekly | |
| Add TSM to Watchlist: View: Get Complete TSM Trend Analysis ➞ | |
 | OLED Universal Display Corporation |
| Sector: Technology | |
| SubSector: Semiconductor Equipment & Materials | |
| MarketCap: 5660.08 Millions | |
| Recent Price: 152.22 Smart Investing & Trading Score: 35 | |
| Day Percent Change: 1.61% Day Change: 2.41 | |
| Week Change: 1.61% Year-to-date Change: -20.4% | |
| OLED Links: Profile News Message Board | |
| Charts:- Daily , Weekly | |
| Add OLED to Watchlist: View: Get Complete OLED Trend Analysis ➞ | |
 | APP AppLovin Corporation |
| Sector: Technology | |
| SubSector: Software - Application | |
| MarketCap: 9000 Millions | |
| Recent Price: 67.87 Smart Investing & Trading Score: 36 | |
| Day Percent Change: 1.60% Day Change: 1.07 | |
| Week Change: 1.6% Year-to-date Change: 70.6% | |
| APP Links: Profile News Message Board | |
| Charts:- Daily , Weekly | |
| Add APP to Watchlist: View: Get Complete APP Trend Analysis ➞ | |
 | VRNS Varonis Systems, Inc. |
| Sector: Technology | |
| SubSector: Technical & System Software | |
| MarketCap: 1715 Millions | |
| Recent Price: 44.03 Smart Investing & Trading Score: 32 | |
| Day Percent Change: 1.59% Day Change: 0.69 | |
| Week Change: 1.59% Year-to-date Change: -2.8% | |
| VRNS Links: Profile News Message Board | |
| Charts:- Daily , Weekly | |
| Add VRNS to Watchlist: View: Get Complete VRNS Trend Analysis ➞ | |
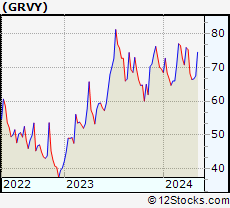 | GRVY Gravity Co., Ltd. |
| Sector: Technology | |
| SubSector: Multimedia & Graphics Software | |
| MarketCap: 167.586 Millions | |
| Recent Price: 67.49 Smart Investing & Trading Score: 58 | |
| Day Percent Change: 1.58% Day Change: 1.05 | |
| Week Change: 1.58% Year-to-date Change: -3.0% | |
| GRVY Links: Profile News Message Board | |
| Charts:- Daily , Weekly | |
| Add GRVY to Watchlist: View: Get Complete GRVY Trend Analysis ➞ | |
 | WK Workiva Inc. |
| Sector: Technology | |
| SubSector: Application Software | |
| MarketCap: 1537.42 Millions | |
| Recent Price: 79.09 Smart Investing & Trading Score: 49 | |
| Day Percent Change: 1.58% Day Change: 1.23 | |
| Week Change: 1.58% Year-to-date Change: -22.1% | |
| WK Links: Profile News Message Board | |
| Charts:- Daily , Weekly | |
| Add WK to Watchlist: View: Get Complete WK Trend Analysis ➞ | |
 | PRGS Progress Software Corporation |
| Sector: Technology | |
| SubSector: Application Software | |
| MarketCap: 1407.22 Millions | |
| Recent Price: 51.19 Smart Investing & Trading Score: 57 | |
| Day Percent Change: 1.55% Day Change: 0.78 | |
| Week Change: 1.55% Year-to-date Change: -5.7% | |
| PRGS Links: Profile News Message Board | |
| Charts:- Daily , Weekly | |
| Add PRGS to Watchlist: View: Get Complete PRGS Trend Analysis ➞ | |
 | MPWR Monolithic Power Systems, Inc. |
| Sector: Technology | |
| SubSector: Semiconductor - Specialized | |
| MarketCap: 6436.4 Millions | |
| Recent Price: 600.63 Smart Investing & Trading Score: 13 | |
| Day Percent Change: 1.54% Day Change: 9.11 | |
| Week Change: 1.54% Year-to-date Change: -4.8% | |
| MPWR Links: Profile News Message Board | |
| Charts:- Daily , Weekly | |
| Add MPWR to Watchlist: View: Get Complete MPWR Trend Analysis ➞ | |
 | APH Amphenol Corporation |
| Sector: Technology | |
| SubSector: Diversified Electronics | |
| MarketCap: 23422 Millions | |
| Recent Price: 111.86 Smart Investing & Trading Score: 56 | |
| Day Percent Change: 1.53% Day Change: 1.69 | |
| Week Change: 1.53% Year-to-date Change: 12.8% | |
| APH Links: Profile News Message Board | |
| Charts:- Daily , Weekly | |
| Add APH to Watchlist: View: Get Complete APH Trend Analysis ➞ | |
 | APPN Appian Corporation |
| Sector: Technology | |
| SubSector: Application Software | |
| MarketCap: 2737.92 Millions | |
| Recent Price: 35.12 Smart Investing & Trading Score: 53 | |
| Day Percent Change: 1.53% Day Change: 0.53 | |
| Week Change: 1.53% Year-to-date Change: -6.7% | |
| APPN Links: Profile News Message Board | |
| Charts:- Daily , Weekly | |
| Add APPN to Watchlist: View: Get Complete APPN Trend Analysis ➞ | |
 | BHE Benchmark Electronics, Inc. |
| Sector: Technology | |
| SubSector: Printed Circuit Boards | |
| MarketCap: 766.835 Millions | |
| Recent Price: 30.08 Smart Investing & Trading Score: 75 | |
| Day Percent Change: 1.52% Day Change: 0.45 | |
| Week Change: 1.52% Year-to-date Change: 8.8% | |
| BHE Links: Profile News Message Board | |
| Charts:- Daily , Weekly | |
| Add BHE to Watchlist: View: Get Complete BHE Trend Analysis ➞ | |
 | DIOD Diodes Incorporated |
| Sector: Technology | |
| SubSector: Semiconductor - Integrated Circuits | |
| MarketCap: 1967.6 Millions | |
| Recent Price: 67.91 Smart Investing & Trading Score: 86 | |
| Day Percent Change: 1.52% Day Change: 1.02 | |
| Week Change: 1.52% Year-to-date Change: -15.7% | |
| DIOD Links: Profile News Message Board | |
| Charts:- Daily , Weekly | |
| Add DIOD to Watchlist: View: Get Complete DIOD Trend Analysis ➞ | |
 | ENTG Entegris, Inc. |
| Sector: Technology | |
| SubSector: Semiconductor Equipment & Materials | |
| MarketCap: 5890.38 Millions | |
| Recent Price: 124.04 Smart Investing & Trading Score: 36 | |
| Day Percent Change: 1.51% Day Change: 1.84 | |
| Week Change: 1.51% Year-to-date Change: 3.5% | |
| ENTG Links: Profile News Message Board | |
| Charts:- Daily , Weekly | |
| Add ENTG to Watchlist: View: Get Complete ENTG Trend Analysis ➞ | |
 | WDC Western Digital Corporation |
| Sector: Technology | |
| SubSector: Data Storage Devices | |
| MarketCap: 10712.9 Millions | |
| Recent Price: 67.05 Smart Investing & Trading Score: 31 | |
| Day Percent Change: 1.51% Day Change: 1.00 | |
| Week Change: 1.51% Year-to-date Change: 28.0% | |
| WDC Links: Profile News Message Board | |
| Charts:- Daily , Weekly | |
| Add WDC to Watchlist: View: Get Complete WDC Trend Analysis ➞ | |
| For tabular summary view of above stock list: Summary View ➞ 0 - 25 , 25 - 50 , 50 - 75 , 75 - 100 , 100 - 125 , 125 - 150 , 150 - 175 , 175 - 200 , 200 - 225 , 225 - 250 , 250 - 275 , 275 - 300 , 300 - 325 , 325 - 350 , 350 - 375 , 375 - 400 , 400 - 425 , 425 - 450 , 450 - 475 , 475 - 500 , 500 - 525 , 525 - 550 , 550 - 575 , 575 - 600 , 600 - 625 , 625 - 650 | ||
| Click To Change The Sort Order: By Market Cap or Company Size Performance: Year-to-date, Week and Day | |
| Select Chart Type: | ||
|
Best Stocks Today 12Stocks.com |
© 2024 12Stocks.com Terms & Conditions Privacy Contact Us
All Information Provided Only For Education And Not To Be Used For Investing or Trading. See Terms & Conditions


One More Thing ... Get Best Stocks Delivered Daily!
Never Ever Miss A Move With Our Top Ten Stocks Lists
Find Best Stocks In Any Market - Bull or Bear Market
Take A Peek At Our Top Ten Stocks Lists: Daily, Weekly, Year-to-Date & Top Trends
Find Best Stocks In Any Market - Bull or Bear Market
Take A Peek At Our Top Ten Stocks Lists: Daily, Weekly, Year-to-Date & Top Trends
Technology Stocks With Best Up Trends [0-bearish to 100-bullish]: Matterport [100], Bilibili [100], JD.com [100], Nokia [100], Zuora [100], EchoStar [100], Jamf Holding[100], NextNav [100], Badger Meter[100], Bentley Systems[100], Telefonica S.A[100]
Best Technology Stocks Year-to-Date:
Pagaya [557.66%], MediaCo Holding[327.23%], CXApp [179.54%], Smith Micro[160.29%], Super Micro[152.24%], Uxin [116.83%], MicroStrategy [109.62%], GigaCloud [102.57%], NextNav [88.76%], CuriosityStream [87%], Matterport [77.78%] Best Technology Stocks This Week:
Matterport [175.86%], MicroStrategy [12.77%], So-Young [12.45%], CommScope Holding[10.52%], Bitdeer [10.47%], Akoustis [9.78%], Aerohive Networks[8.49%], Sea [7.94%], Bilibili [7.61%], BigBear.ai [7.59%], Tigo Energy[7.53%] Best Technology Stocks Daily:
Matterport [175.86%], MicroStrategy [12.77%], So-Young [12.45%], CommScope Holding[10.52%], Bitdeer [10.47%], Akoustis [9.78%], Aerohive Networks[8.49%], Sea [7.94%], Bilibili [7.61%], BigBear.ai [7.59%], Tigo Energy[7.53%]