
 Login Sign Up


| |||||
 |  | ||||

| 12Stocks.com Market Intelligence |
Best Tech Stocks
| In a hurry? Tech Stocks Lists: Performance & Trends, Stock Charts, FANG Stocks
Sort Tech stocks: Daily, Weekly, Year-to-Date, Market Cap & Trends. Filter Tech stocks list by size:All Tech Large Mid-Range Small and MicroCap |
| 12Stocks.com Tech Stocks Performances & Trends Daily | |||||||||
|
|  The overall Smart Investing & Trading Score is 32 (0-bearish to 100-bullish) which puts Technology sector in short term bearish to neutral trend. The Smart Investing & Trading Score from previous trading session is 38 and hence a deterioration of trend.
| ||||||||
Here are the Smart Investing & Trading Scores of the most requested Technology stocks at 12Stocks.com (click stock name for detailed review):
|


| 12Stocks.com: Investing in Technology sector with Stocks | |
|
The following table helps investors and traders sort through current performance and trends (as measured by Smart Investing & Trading Score) of various
stocks in the Tech sector. Quick View: Move mouse or cursor over stock symbol (ticker) to view short-term technical chart and over stock name to view long term chart. Click on  to add stock symbol to your watchlist and to add stock symbol to your watchlist and  to view watchlist. Click on any ticker or stock name for detailed market intelligence report for that stock. to view watchlist. Click on any ticker or stock name for detailed market intelligence report for that stock. |
12Stocks.com Performance of Stocks in Tech Sector
| Ticker | Stock Name | Watchlist | Category | Recent Price | Smart Investing & Trading Score | Change % | YTD Change% |
| GRVY | Gravity Co |   | Software | 67.85 | 58 | 0.33 | -2.46% |
| QLYS | Qualys | | Software | 172.11 | 64 | 0.33 | -12.31% |
| VZIO | VIZIO Holding | | Consumer Electronics | 10.79 | 61 | 0.33 | 39.88% |
| VIV | Telefonica Brasil | | Wireless | 9.42 | 35 | 0.32 | -13.89% |
| STNE | StoneCo | | Software | 15.83 | 20 | 0.32 | -12.20% |
| ZI | ZoomInfo | | Software | 15.89 | 57 | 0.32 | -14.06% |
| ZS | Zscaler | | Security Software | 177.46 | 22 | 0.31 | -19.90% |
| KARO | Karooooo | | Software - | 27.36 | 100 | 0.31 | 10.57% |
| SPSC | SPS Commerce | | Software | 171.12 | 49 | 0.30 | -11.72% |
| SAIC | Science Applications | | IT | 128.47 | 62 | 0.30 | 3.34% |
| WOW | WideOpenWest | | CATV | 3.49 | 22 | 0.29 | -13.83% |
| AVDX | AvidXchange | | Software - Infrastructure | 12.03 | 65 | 0.29 | -3.10% |
| BILL | Bill.com | | Software | 61.41 | 30 | 0.24 | -24.73% |
| DOCN | DigitalOcean | | Software - Infrastructure | 32.79 | 32 | 0.24 | -11.33% |
| VRSN | VeriSign | | Internet | 185.55 | 28 | 0.23 | -9.91% |
| FIVN | Five9 | | Software | 60.28 | 57 | 0.23 | -23.40% |
| ORCL | Oracle | | Software | 115.34 | 44 | 0.22 | 9.40% |
| KVHI | KVH Industries | | Communication | 4.81 | 17 | 0.21 | -8.56% |
| TTMI | TTM | | Circuit Boards | 14.62 | 93 | 0.21 | -7.53% |
| GRMN | Garmin | | Instruments | 142.79 | 63 | 0.20 | 11.09% |
| DOX | Amdocs | | Software | 86.74 | 32 | 0.20 | -1.31% |
| APPN | Appian | | Software | 36.66 | 53 | 0.19 | -2.66% |
| IT | Gartner | | IT | 451.06 | 32 | 0.18 | -0.01% |
| VRNS | Varonis Systems | | Software | 44.87 | 62 | 0.18 | -0.91% |
| SMAR | Smartsheet | | Software | 38.36 | 37 | 0.18 | -19.78% |
| For chart view version of above stock list: Chart View ➞ 0 - 25 , 25 - 50 , 50 - 75 , 75 - 100 , 100 - 125 , 125 - 150 , 150 - 175 , 175 - 200 , 200 - 225 , 225 - 250 , 250 - 275 , 275 - 300 , 300 - 325 , 325 - 350 , 350 - 375 , 375 - 400 , 400 - 425 , 425 - 450 , 450 - 475 , 475 - 500 , 500 - 525 , 525 - 550 , 550 - 575 , 575 - 600 , 600 - 625 , 625 - 650 | ||
 | Click To Change The Sort Order: By Market Cap or Company Size Performance: Year-to-date, Week and Day |  |
|
Get the most comprehensive stock market coverage daily at 12Stocks.com ➞ Best Stocks Today ➞ Best Stocks Weekly ➞ Best Stocks Year-to-Date ➞ Best Stocks Trends ➞  Best Stocks Today 12Stocks.com Best Nasdaq Stocks ➞ Best S&P 500 Stocks ➞ Best Tech Stocks ➞ Best Biotech Stocks ➞ |
| Detailed Overview of Tech Stocks |
| Tech Technical Overview, Leaders & Laggards, Top Tech ETF Funds & Detailed Tech Stocks List, Charts, Trends & More |
| Tech Sector: Technical Analysis, Trends & YTD Performance | |
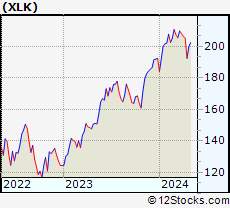
| Technology sector is composed of stocks
from semiconductors, software, web, social media
and services subsectors. Technology sector, as represented by XLK, an exchange-traded fund [ETF] that holds basket of tech stocks (e.g, Intel, Google) is up by 2.88% and is currently underperforming the overall market by -2.78% year-to-date. Below is a quick view of technical charts and trends: |
|
 XLK Weekly Chart |
|
| Long Term Trend: Good | |
| Medium Term Trend: Not Good | |
 XLK Daily Chart |
|
| Short Term Trend: Very Good | |
| Overall Trend Score: 32 | |
| YTD Performance: 2.88% | |
| **Trend Scores & Views Are Only For Educational Purposes And Not For Investing | |
| 12Stocks.com: Top Performing Technology Sector Stocks | ||||||||||||||||||||||||||||||||||||||||||||||||
 The top performing Technology sector stocks year to date are
Now, more recently, over last week, the top performing Technology sector stocks on the move are


|
||||||||||||||||||||||||||||||||||||||||||||||||
| 12Stocks.com: Investing in Tech Sector using Exchange Traded Funds | |
|
The following table shows list of key exchange traded funds (ETF) that
help investors track Tech Index. For detailed view, check out our ETF Funds section of our website. Quick View: Move mouse or cursor over ETF symbol (ticker) to view short-term technical chart and over ETF name to view long term chart. Click on ticker or stock name for detailed view. Click on to add stock symbol to your watchlist and to view watchlist. |
12Stocks.com List of ETFs that track Tech Index
| Ticker | ETF Name | Watchlist | Recent Price | Smart Investing & Trading Score | Change % | Week % | Year-to-date % |
| XLK | Technology | | 198.03 | 32 | 0.46 | 2.86 | 2.88% |
| QQQ | QQQ | | 426.51 | 58 | 0.34 | 2.86 | 4.15% |
| IYW | Technology | | 128.84 | 43 | 0.25 | 3.28 | 4.96% |
| VGT | Information Technology | | 495.24 | 30 | 0.16 | 3.2 | 2.32% |
| IXN | Global Tech | | 70.84 | 43 | 0.47 | 3.08 | 3.9% |
| IGV | Tech-Software | | 80.94 | 17 | 0.10 | 3.07 | -0.23% |
| XSD | Semiconductor | | 215.54 | 30 | 2.30 | 5.89 | -4.11% |
| TQQQ | QQQ | | 53.71 | 58 | 0.98 | 8.55 | 5.94% |
| SQQQ | Short QQQ | | 11.81 | 37 | -0.84 | -8.02 | -12.19% |
| SOXL | Semicondct Bull 3X | | 35.49 | 58 | 4.05 | 15.26 | 13.03% |
| SOXS | Semicondct Bear 3X | | 39.61 | 58 | -3.81 | -14.13 | 580.58% |
| SOXX | PHLX Semiconductor | | 208.54 | 43 | 1.30 | 5.12 | 8.6% |
| QTEC | First -100-Tech | | 181.14 | 30 | 0.69 | 4.14 | 3.23% |
| SMH | Semiconductor | | 208.04 | 58 | 0.12 | 4.43 | 18.97% |
| 12Stocks.com: Charts, Trends, Fundamental Data and Performances of Tech Stocks | |
|
We now take in-depth look at all Tech stocks including charts, multi-period performances and overall trends (as measured by Smart Investing & Trading Score). One can sort Tech stocks (click link to choose) by Daily, Weekly and by Year-to-Date performances. Also, one can sort by size of the company or by market capitalization. |
| Select Your Default Chart Type: | |||||
| |||||
| Click on stock symbol or name for detailed view. Click on to add stock symbol to your watchlist and to view watchlist. Quick View: Move mouse or cursor over "Daily" to quickly view daily technical stock chart and over "Weekly" to view weekly technical stock chart. | |||||


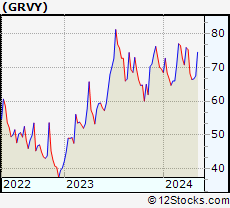 | GRVY Gravity Co., Ltd. |
| Sector: Technology | |
| SubSector: Multimedia & Graphics Software | |
| MarketCap: 167.586 Millions | |
| Recent Price: 67.85 Smart Investing & Trading Score: 58 | |
| Day Percent Change: 0.33% Day Change: 0.22 | |
| Week Change: 2.12% Year-to-date Change: -2.5% | |
| GRVY Links: Profile News Message Board | |
| Charts:- Daily , Weekly | |
| Add GRVY to Watchlist: View: Get Complete GRVY Trend Analysis ➞ | |
 | QLYS Qualys, Inc. |
| Sector: Technology | |
| SubSector: Application Software | |
| MarketCap: 3475.02 Millions | |
| Recent Price: 172.11 Smart Investing & Trading Score: 64 | |
| Day Percent Change: 0.33% Day Change: 0.57 | |
| Week Change: 5.23% Year-to-date Change: -12.3% | |
| QLYS Links: Profile News Message Board | |
| Charts:- Daily , Weekly | |
| Add QLYS to Watchlist: View: Get Complete QLYS Trend Analysis ➞ | |
 | VZIO VIZIO Holding Corp. |
| Sector: Technology | |
| SubSector: Consumer Electronics | |
| MarketCap: 1300 Millions | |
| Recent Price: 10.79 Smart Investing & Trading Score: 61 | |
| Day Percent Change: 0.33% Day Change: 0.04 | |
| Week Change: 0.05% Year-to-date Change: 39.9% | |
| VZIO Links: Profile News Message Board | |
| Charts:- Daily , Weekly | |
| Add VZIO to Watchlist: View: Get Complete VZIO Trend Analysis ➞ | |
 | VIV Telefonica Brasil S.A. |
| Sector: Technology | |
| SubSector: Wireless Communications | |
| MarketCap: 19611.1 Millions | |
| Recent Price: 9.42 Smart Investing & Trading Score: 35 | |
| Day Percent Change: 0.32% Day Change: 0.03 | |
| Week Change: 0.75% Year-to-date Change: -13.9% | |
| VIV Links: Profile News Message Board | |
| Charts:- Daily , Weekly | |
| Add VIV to Watchlist: View: Get Complete VIV Trend Analysis ➞ | |
 | STNE StoneCo Ltd. |
| Sector: Technology | |
| SubSector: Application Software | |
| MarketCap: 7347.82 Millions | |
| Recent Price: 15.83 Smart Investing & Trading Score: 20 | |
| Day Percent Change: 0.32% Day Change: 0.05 | |
| Week Change: 3.46% Year-to-date Change: -12.2% | |
| STNE Links: Profile News Message Board | |
| Charts:- Daily , Weekly | |
| Add STNE to Watchlist: View: Get Complete STNE Trend Analysis ➞ | |
 | ZI ZoomInfo Technologies Inc. |
| Sector: Technology | |
| SubSector: Software Application | |
| MarketCap: 15937 Millions | |
| Recent Price: 15.89 Smart Investing & Trading Score: 57 | |
| Day Percent Change: 0.32% Day Change: 0.05 | |
| Week Change: 0.06% Year-to-date Change: -14.1% | |
| ZI Links: Profile News Message Board | |
| Charts:- Daily , Weekly | |
| Add ZI to Watchlist: View: Get Complete ZI Trend Analysis ➞ | |
 | ZS Zscaler, Inc. |
| Sector: Technology | |
| SubSector: Security Software & Services | |
| MarketCap: 7532.17 Millions | |
| Recent Price: 177.46 Smart Investing & Trading Score: 22 | |
| Day Percent Change: 0.31% Day Change: 0.54 | |
| Week Change: 4.86% Year-to-date Change: -19.9% | |
| ZS Links: Profile News Message Board | |
| Charts:- Daily , Weekly | |
| Add ZS to Watchlist: View: Get Complete ZS Trend Analysis ➞ | |
 | KARO Karooooo Ltd. |
| Sector: Technology | |
| SubSector: Software - Application | |
| MarketCap: 728 Millions | |
| Recent Price: 27.36 Smart Investing & Trading Score: 100 | |
| Day Percent Change: 0.31% Day Change: 0.08 | |
| Week Change: 1.02% Year-to-date Change: 10.6% | |
| KARO Links: Profile News Message Board | |
| Charts:- Daily , Weekly | |
| Add KARO to Watchlist: View: Get Complete KARO Trend Analysis ➞ | |
 | SPSC SPS Commerce, Inc. |
| Sector: Technology | |
| SubSector: Application Software | |
| MarketCap: 1398.02 Millions | |
| Recent Price: 171.12 Smart Investing & Trading Score: 49 | |
| Day Percent Change: 0.30% Day Change: 0.52 | |
| Week Change: 3.4% Year-to-date Change: -11.7% | |
| SPSC Links: Profile News Message Board | |
| Charts:- Daily , Weekly | |
| Add SPSC to Watchlist: View: Get Complete SPSC Trend Analysis ➞ | |
 | SAIC Science Applications International Corporation |
| Sector: Technology | |
| SubSector: Information Technology Services | |
| MarketCap: 3388.78 Millions | |
| Recent Price: 128.47 Smart Investing & Trading Score: 62 | |
| Day Percent Change: 0.30% Day Change: 0.39 | |
| Week Change: 2.83% Year-to-date Change: 3.3% | |
| SAIC Links: Profile News Message Board | |
| Charts:- Daily , Weekly | |
| Add SAIC to Watchlist: View: Get Complete SAIC Trend Analysis ➞ | |
 | WOW WideOpenWest, Inc. |
| Sector: Technology | |
| SubSector: CATV Systems | |
| MarketCap: 328.932 Millions | |
| Recent Price: 3.49 Smart Investing & Trading Score: 22 | |
| Day Percent Change: 0.29% Day Change: 0.01 | |
| Week Change: -0.85% Year-to-date Change: -13.8% | |
| WOW Links: Profile News Message Board | |
| Charts:- Daily , Weekly | |
| Add WOW to Watchlist: View: Get Complete WOW Trend Analysis ➞ | |
 | AVDX AvidXchange Holdings, Inc. |
| Sector: Technology | |
| SubSector: Software - Infrastructure | |
| MarketCap: 2120 Millions | |
| Recent Price: 12.03 Smart Investing & Trading Score: 65 | |
| Day Percent Change: 0.29% Day Change: 0.04 | |
| Week Change: 5.07% Year-to-date Change: -3.1% | |
| AVDX Links: Profile News Message Board | |
| Charts:- Daily , Weekly | |
| Add AVDX to Watchlist: View: Get Complete AVDX Trend Analysis ➞ | |
 | BILL Bill.com Holdings, Inc. |
| Sector: Technology | |
| SubSector: Application Software | |
| MarketCap: 3068.42 Millions | |
| Recent Price: 61.41 Smart Investing & Trading Score: 30 | |
| Day Percent Change: 0.24% Day Change: 0.15 | |
| Week Change: 3.02% Year-to-date Change: -24.7% | |
| BILL Links: Profile News Message Board | |
| Charts:- Daily , Weekly | |
| Add BILL to Watchlist: View: Get Complete BILL Trend Analysis ➞ | |
 | DOCN DigitalOcean Holdings, Inc. |
| Sector: Technology | |
| SubSector: Software - Infrastructure | |
| MarketCap: 3620 Millions | |
| Recent Price: 32.79 Smart Investing & Trading Score: 32 | |
| Day Percent Change: 0.24% Day Change: 0.08 | |
| Week Change: 1.11% Year-to-date Change: -11.3% | |
| DOCN Links: Profile News Message Board | |
| Charts:- Daily , Weekly | |
| Add DOCN to Watchlist: View: Get Complete DOCN Trend Analysis ➞ | |
 | VRSN VeriSign, Inc. |
| Sector: Technology | |
| SubSector: Internet Information Providers | |
| MarketCap: 19657 Millions | |
| Recent Price: 185.55 Smart Investing & Trading Score: 28 | |
| Day Percent Change: 0.23% Day Change: 0.43 | |
| Week Change: 0.78% Year-to-date Change: -9.9% | |
| VRSN Links: Profile News Message Board | |
| Charts:- Daily , Weekly | |
| Add VRSN to Watchlist: View: Get Complete VRSN Trend Analysis ➞ | |
 | FIVN Five9, Inc. |
| Sector: Technology | |
| SubSector: Application Software | |
| MarketCap: 4253.62 Millions | |
| Recent Price: 60.28 Smart Investing & Trading Score: 57 | |
| Day Percent Change: 0.23% Day Change: 0.14 | |
| Week Change: 5.59% Year-to-date Change: -23.4% | |
| FIVN Links: Profile News Message Board | |
| Charts:- Daily , Weekly | |
| Add FIVN to Watchlist: View: Get Complete FIVN Trend Analysis ➞ | |
 | ORCL Oracle Corporation |
| Sector: Technology | |
| SubSector: Application Software | |
| MarketCap: 164530 Millions | |
| Recent Price: 115.34 Smart Investing & Trading Score: 44 | |
| Day Percent Change: 0.22% Day Change: 0.25 | |
| Week Change: 0.4% Year-to-date Change: 9.4% | |
| ORCL Links: Profile News Message Board | |
| Charts:- Daily , Weekly | |
| Add ORCL to Watchlist: View: Get Complete ORCL Trend Analysis ➞ | |
 | KVHI KVH Industries, Inc. |
| Sector: Technology | |
| SubSector: Communication Equipment | |
| MarketCap: 169.939 Millions | |
| Recent Price: 4.81 Smart Investing & Trading Score: 17 | |
| Day Percent Change: 0.21% Day Change: 0.01 | |
| Week Change: -2.63% Year-to-date Change: -8.6% | |
| KVHI Links: Profile News Message Board | |
| Charts:- Daily , Weekly | |
| Add KVHI to Watchlist: View: Get Complete KVHI Trend Analysis ➞ | |
 | TTMI TTM Technologies, Inc. |
| Sector: Technology | |
| SubSector: Printed Circuit Boards | |
| MarketCap: 1028.35 Millions | |
| Recent Price: 14.62 Smart Investing & Trading Score: 93 | |
| Day Percent Change: 0.21% Day Change: 0.03 | |
| Week Change: 4.06% Year-to-date Change: -7.5% | |
| TTMI Links: Profile News Message Board | |
| Charts:- Daily , Weekly | |
| Add TTMI to Watchlist: View: Get Complete TTMI Trend Analysis ➞ | |
 | GRMN Garmin Ltd. |
| Sector: Technology | |
| SubSector: Scientific & Technical Instruments | |
| MarketCap: 13909.3 Millions | |
| Recent Price: 142.79 Smart Investing & Trading Score: 63 | |
| Day Percent Change: 0.20% Day Change: 0.28 | |
| Week Change: 2.34% Year-to-date Change: 11.1% | |
| GRMN Links: Profile News Message Board | |
| Charts:- Daily , Weekly | |
| Add GRMN to Watchlist: View: Get Complete GRMN Trend Analysis ➞ | |
 | DOX Amdocs Limited |
| Sector: Technology | |
| SubSector: Business Software & Services | |
| MarketCap: 6895.48 Millions | |
| Recent Price: 86.74 Smart Investing & Trading Score: 32 | |
| Day Percent Change: 0.20% Day Change: 0.17 | |
| Week Change: 0.71% Year-to-date Change: -1.3% | |
| DOX Links: Profile News Message Board | |
| Charts:- Daily , Weekly | |
| Add DOX to Watchlist: View: Get Complete DOX Trend Analysis ➞ | |
 | APPN Appian Corporation |
| Sector: Technology | |
| SubSector: Application Software | |
| MarketCap: 2737.92 Millions | |
| Recent Price: 36.66 Smart Investing & Trading Score: 53 | |
| Day Percent Change: 0.19% Day Change: 0.07 | |
| Week Change: 5.98% Year-to-date Change: -2.7% | |
| APPN Links: Profile News Message Board | |
| Charts:- Daily , Weekly | |
| Add APPN to Watchlist: View: Get Complete APPN Trend Analysis ➞ | |
 | IT Gartner, Inc. |
| Sector: Technology | |
| SubSector: Information Technology Services | |
| MarketCap: 7767.98 Millions | |
| Recent Price: 451.06 Smart Investing & Trading Score: 32 | |
| Day Percent Change: 0.18% Day Change: 0.80 | |
| Week Change: 2.43% Year-to-date Change: 0.0% | |
| IT Links: Profile News Message Board | |
| Charts:- Daily , Weekly | |
| Add IT to Watchlist: View: Get Complete IT Trend Analysis ➞ | |
 | VRNS Varonis Systems, Inc. |
| Sector: Technology | |
| SubSector: Technical & System Software | |
| MarketCap: 1715 Millions | |
| Recent Price: 44.87 Smart Investing & Trading Score: 62 | |
| Day Percent Change: 0.18% Day Change: 0.08 | |
| Week Change: 3.53% Year-to-date Change: -0.9% | |
| VRNS Links: Profile News Message Board | |
| Charts:- Daily , Weekly | |
| Add VRNS to Watchlist: View: Get Complete VRNS Trend Analysis ➞ | |
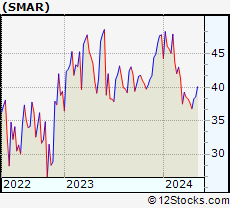 | SMAR Smartsheet Inc. |
| Sector: Technology | |
| SubSector: Business Software & Services | |
| MarketCap: 5159.38 Millions | |
| Recent Price: 38.36 Smart Investing & Trading Score: 37 | |
| Day Percent Change: 0.18% Day Change: 0.07 | |
| Week Change: 4.24% Year-to-date Change: -19.8% | |
| SMAR Links: Profile News Message Board | |
| Charts:- Daily , Weekly | |
| Add SMAR to Watchlist: View: Get Complete SMAR Trend Analysis ➞ | |
| For tabular summary view of above stock list: Summary View ➞ 0 - 25 , 25 - 50 , 50 - 75 , 75 - 100 , 100 - 125 , 125 - 150 , 150 - 175 , 175 - 200 , 200 - 225 , 225 - 250 , 250 - 275 , 275 - 300 , 300 - 325 , 325 - 350 , 350 - 375 , 375 - 400 , 400 - 425 , 425 - 450 , 450 - 475 , 475 - 500 , 500 - 525 , 525 - 550 , 550 - 575 , 575 - 600 , 600 - 625 , 625 - 650 | ||
| Click To Change The Sort Order: By Market Cap or Company Size Performance: Year-to-date, Week and Day | |
| Select Chart Type: | ||
|
Best Stocks Today 12Stocks.com |
© 2024 12Stocks.com Terms & Conditions Privacy Contact Us
All Information Provided Only For Education And Not To Be Used For Investing or Trading. See Terms & Conditions


One More Thing ... Get Best Stocks Delivered Daily!
Never Ever Miss A Move With Our Top Ten Stocks Lists
Find Best Stocks In Any Market - Bull or Bear Market
Take A Peek At Our Top Ten Stocks Lists: Daily, Weekly, Year-to-Date & Top Trends
Find Best Stocks In Any Market - Bull or Bear Market
Take A Peek At Our Top Ten Stocks Lists: Daily, Weekly, Year-to-Date & Top Trends
Technology Stocks With Best Up Trends [0-bearish to 100-bullish]: Amesite [100], Ribbon [100], Allegro MicroSystems[100], Texas [100], Microchip [100], EchoStar [100], Analog Devices[100], Vishay Inter[100], JD.com [100], Sea [100], Jamf Holding[100]
Best Technology Stocks Year-to-Date:
Pagaya [581.02%], MicroCloud Hologram[574.82%], MediaCo Holding[364.79%], Uxin [169.61%], CXApp [167.95%], Super Micro[165.5%], Smith Micro[162.71%], SoundHound AI[103.27%], MicroStrategy [100.38%], GigaCloud [96.01%], NextNav [95.73%] Best Technology Stocks This Week:
Matterport [166.09%], Amesite [69.72%], WiMi Hologram[64.85%], Ribbon [25.97%], HashiCorp [23.7%], SoundHound AI[22.54%], Intchains [20.36%], iQIYI [17.99%], Bilibili [16.87%], FTC Solar[16.56%], BigBear.ai [16.55%] Best Technology Stocks Daily:
Amesite [65.50%], WiMi Hologram[58.53%], Ribbon [26.46%], Intchains [22.28%], Uxin [13.86%], Bilibili [10.97%], Comtech Tele[10.76%], Mitcham Industries[9.88%], Navitas Semiconductor[8.83%], FTC Solar[8.51%], AMTD Digital[8.33%]