
 Login Sign Up


| |||||
 |  | ||||

| 12Stocks.com Market Intelligence |
Best Tech Stocks
| In a hurry? Tech Stocks Lists: Performance & Trends, Stock Charts, FANG Stocks
Sort Tech stocks: Daily, Weekly, Year-to-Date, Market Cap & Trends. Filter Tech stocks list by size:All Tech Large Mid-Range Small and MicroCap |
| 12Stocks.com Tech Stocks Performances & Trends Daily | |||||||||
|
|  The overall Smart Investing & Trading Score is 38 (0-bearish to 100-bullish) which puts Technology sector in short term bearish to neutral trend. The Smart Investing & Trading Score from previous trading session is 10 and hence an improvement of trend.
| ||||||||
Here are the Smart Investing & Trading Scores of the most requested Technology stocks at 12Stocks.com (click stock name for detailed review):
|

| 12Stocks.com: Investing in Technology sector with Stocks | |
|
The following table helps investors and traders sort through current performance and trends (as measured by Smart Investing & Trading Score) of various
stocks in the Tech sector. Quick View: Move mouse or cursor over stock symbol (ticker) to view short-term technical chart and over stock name to view long term chart. Click on  to add stock symbol to your watchlist and to add stock symbol to your watchlist and  to view watchlist. Click on any ticker or stock name for detailed market intelligence report for that stock. to view watchlist. Click on any ticker or stock name for detailed market intelligence report for that stock. |
12Stocks.com Performance of Stocks in Tech Sector
| Ticker | Stock Name | Watchlist | Category | Recent Price | Smart Investing & Trading Score | Change % | YTD Change% |
| SGH | SMART Global |   | Semiconductor- | 17.93 | 32 | 4.18 | -5.28% |
| NFLX | Netflix | | CATV | 577.75 | 43 | 4.17 | 18.66% |
| CFLT | Confluent | | Software - Infrastructure | 28.51 | 58 | 4.17 | 20.09% |
| SEDG | SolarEdge | | Semiconductor | 56.77 | 27 | 4.15 | -39.35% |
| TTD | Trade Desk | | Software | 81.07 | 51 | 4.15 | 12.66% |
| KRKR | 36Kr | | Internet | 0.38 | 10 | 4.14 | -32.68% |
| NOVT | Novanta | | Instruments | 159.38 | 58 | 4.10 | -5.36% |
| VRNT | Verint Systems | | Software | 30.35 | 76 | 4.08 | 12.28% |
| ZG | Zillow | | Internet | 43.18 | 42 | 4.02 | -23.87% |
| CTS | CTS | | Electronics | 45.49 | 83 | 3.93 | 4.00% |
| INSP | Inspire Medical | | Internet | 233.93 | 63 | 3.87 | 14.99% |
| SANM | Sanmina | | Electronics | 60.97 | 100 | 3.80 | 18.69% |
| ICHR | Ichor | | Semiconductor | 37.54 | 56 | 3.79 | 11.63% |
| FROG | JFrog | | Software | 39.17 | 65 | 3.79 | 13.14% |
| DSP | Viant | | Software - | 9.06 | 63 | 3.78 | 30.55% |
| NET | Cloudflare | | Software | 87.88 | 58 | 3.77 | 5.55% |
| VIOT | Viomi | | Electronic | 0.55 | 25 | 3.77 | -45.00% |
| SABR | Sabre | | IT | 2.76 | 69 | 3.76 | -37.27% |
| ACIW | ACI Worldwide | | Software | 33.46 | 100 | 3.75 | 9.35% |
| HIVE | Aerohive Networks | | Communication | 3.05 | 80 | 3.74 | -32.67% |
| ITRI | Itron | | Instruments | 94.84 | 95 | 3.70 | 25.60% |
| NVDA | NVIDIA | | Semiconductor | 824.23 | 48 | 3.65 | 66.44% |
| GWRE | Guidewire Software | | Software | 113.78 | 75 | 3.63 | 4.35% |
| CRWD | CrowdStrike | | Security Software | 299.65 | 58 | 3.63 | 17.36% |
| DXC | DXC | | IT | 21.16 | 74 | 3.62 | -7.48% |
| For chart view version of above stock list: Chart View ➞ 0 - 25 , 25 - 50 , 50 - 75 , 75 - 100 , 100 - 125 , 125 - 150 , 150 - 175 , 175 - 200 , 200 - 225 , 225 - 250 , 250 - 275 , 275 - 300 , 300 - 325 , 325 - 350 , 350 - 375 , 375 - 400 , 400 - 425 , 425 - 450 , 450 - 475 , 475 - 500 , 500 - 525 , 525 - 550 , 550 - 575 , 575 - 600 , 600 - 625 , 625 - 650 | ||
 | Click To Change The Sort Order: By Market Cap or Company Size Performance: Year-to-date, Week and Day |  |
|
Get the most comprehensive stock market coverage daily at 12Stocks.com ➞ Best Stocks Today ➞ Best Stocks Weekly ➞ Best Stocks Year-to-Date ➞ Best Stocks Trends ➞  Best Stocks Today 12Stocks.com Best Nasdaq Stocks ➞ Best S&P 500 Stocks ➞ Best Tech Stocks ➞ Best Biotech Stocks ➞ |
| Detailed Overview of Tech Stocks |
| Tech Technical Overview, Leaders & Laggards, Top Tech ETF Funds & Detailed Tech Stocks List, Charts, Trends & More |
| Tech Sector: Technical Analysis, Trends & YTD Performance | |
| Technology sector is composed of stocks
from semiconductors, software, web, social media
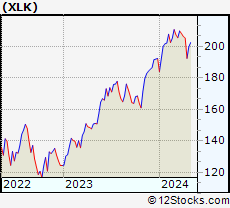
and services subsectors. Technology sector, as represented by XLK, an exchange-traded fund [ETF] that holds basket of tech stocks (e.g, Intel, Google) is up by 2.42% and is currently underperforming the overall market by -3.22% year-to-date. Below is a quick view of technical charts and trends: |
|
 XLK Weekly Chart |
|
| Long Term Trend: Not Good | |
| Medium Term Trend: Not Good | |
 XLK Daily Chart |
|
| Short Term Trend: Very Good | |
| Overall Trend Score: 38 | |
| YTD Performance: 2.42% | |
| **Trend Scores & Views Are Only For Educational Purposes And Not For Investing | |
| 12Stocks.com: Top Performing Technology Sector Stocks | ||||||||||||||||||||||||||||||||||||||||||||||||
 The top performing Technology sector stocks year to date are
Now, more recently, over last week, the top performing Technology sector stocks on the move are


|
||||||||||||||||||||||||||||||||||||||||||||||||
| 12Stocks.com: Investing in Tech Sector using Exchange Traded Funds | |
|
The following table shows list of key exchange traded funds (ETF) that
help investors track Tech Index. For detailed view, check out our ETF Funds section of our website. Quick View: Move mouse or cursor over ETF symbol (ticker) to view short-term technical chart and over ETF name to view long term chart. Click on ticker or stock name for detailed view. Click on to add stock symbol to your watchlist and to view watchlist. |
12Stocks.com List of ETFs that track Tech Index
| Ticker | ETF Name | Watchlist | Recent Price | Smart Investing & Trading Score | Change % | Week % | Year-to-date % |
| XLK | Technology | | 197.13 | 38 | 1.48 | 2.39 | 2.42% |
| QQQ | QQQ | | 425.07 | 51 | 2.59 | 2.51 | 3.8% |
| IYW | Technology | | 128.52 | 51 | 1.81 | 3.02 | 4.7% |
| VGT | Information Technology | | 494.45 | 38 | 1.64 | 3.03 | 2.16% |
| IXN | Global Tech | | 70.51 | 38 | 1.63 | 2.6 | 3.42% |
| IGV | Tech-Software | | 80.86 | 32 | 1.74 | 2.97 | -0.33% |
| XSD | Semiconductor | | 210.70 | 38 | 1.97 | 3.51 | -6.27% |
| TQQQ | QQQ | | 53.19 | 58 | 4.46 | 7.5 | 4.91% |
| SQQQ | Short QQQ | | 11.91 | 37 | -4.49 | -7.24 | -11.45% |
| SOXL | Semicondct Bull 3X | | 34.11 | 43 | 6.36 | 10.78 | 8.63% |
| SOXS | Semicondct Bear 3X | | 41.18 | 66 | -6.35 | -10.73 | 607.56% |
| SOXX | PHLX Semiconductor | | 205.87 | 51 | 2.09 | 3.77 | 7.21% |
| QTEC | First -100-Tech | | 179.90 | 38 | 2.01 | 3.43 | 2.52% |
| SMH | Semiconductor | | 207.80 | 51 | 2.35 | 4.31 | 18.83% |
| 12Stocks.com: Charts, Trends, Fundamental Data and Performances of Tech Stocks | |
|
We now take in-depth look at all Tech stocks including charts, multi-period performances and overall trends (as measured by Smart Investing & Trading Score). One can sort Tech stocks (click link to choose) by Daily, Weekly and by Year-to-Date performances. Also, one can sort by size of the company or by market capitalization. |
| Select Your Default Chart Type: | |||||
| |||||
| Click on stock symbol or name for detailed view. Click on to add stock symbol to your watchlist and to view watchlist. Quick View: Move mouse or cursor over "Daily" to quickly view daily technical stock chart and over "Weekly" to view weekly technical stock chart. | |||||


 | SGH SMART Global Holdings, Inc. |
| Sector: Technology | |
| SubSector: Semiconductor- Memory Chips | |
| MarketCap: 657.8 Millions | |
| Recent Price: 17.93 Smart Investing & Trading Score: 32 | |
| Day Percent Change: 4.18% Day Change: 0.72 | |
| Week Change: 5.97% Year-to-date Change: -5.3% | |
| SGH Links: Profile News Message Board | |
| Charts:- Daily , Weekly | |
| Add SGH to Watchlist: View: Get Complete SGH Trend Analysis ➞ | |
 | NFLX Netflix, Inc. |
| Sector: Technology | |
| SubSector: CATV Systems | |
| MarketCap: 162108 Millions | |
| Recent Price: 577.75 Smart Investing & Trading Score: 43 | |
| Day Percent Change: 4.17% Day Change: 23.15 | |
| Week Change: 4.09% Year-to-date Change: 18.7% | |
| NFLX Links: Profile News Message Board | |
| Charts:- Daily , Weekly | |
| Add NFLX to Watchlist: View: Get Complete NFLX Trend Analysis ➞ | |
 | CFLT Confluent, Inc. |
| Sector: Technology | |
| SubSector: Software - Infrastructure | |
| MarketCap: 10820 Millions | |
| Recent Price: 28.51 Smart Investing & Trading Score: 58 | |
| Day Percent Change: 4.17% Day Change: 1.14 | |
| Week Change: 6.02% Year-to-date Change: 20.1% | |
| CFLT Links: Profile News Message Board | |
| Charts:- Daily , Weekly | |
| Add CFLT to Watchlist: View: Get Complete CFLT Trend Analysis ➞ | |
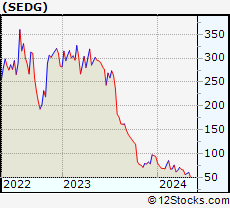 | SEDG SolarEdge Technologies, Inc. |
| Sector: Technology | |
| SubSector: Semiconductor - Specialized | |
| MarketCap: 4008.8 Millions | |
| Recent Price: 56.77 Smart Investing & Trading Score: 27 | |
| Day Percent Change: 4.15% Day Change: 2.26 | |
| Week Change: 1.74% Year-to-date Change: -39.4% | |
| SEDG Links: Profile News Message Board | |
| Charts:- Daily , Weekly | |
| Add SEDG to Watchlist: View: Get Complete SEDG Trend Analysis ➞ | |
 | TTD The Trade Desk, Inc. |
| Sector: Technology | |
| SubSector: Application Software | |
| MarketCap: 9006.92 Millions | |
| Recent Price: 81.07 Smart Investing & Trading Score: 51 | |
| Day Percent Change: 4.15% Day Change: 3.23 | |
| Week Change: 4.88% Year-to-date Change: 12.7% | |
| TTD Links: Profile News Message Board | |
| Charts:- Daily , Weekly | |
| Add TTD to Watchlist: View: Get Complete TTD Trend Analysis ➞ | |
 | KRKR 36Kr Holdings Inc. |
| Sector: Technology | |
| SubSector: Internet Information Providers | |
| MarketCap: 173.18 Millions | |
| Recent Price: 0.38 Smart Investing & Trading Score: 10 | |
| Day Percent Change: 4.14% Day Change: 0.02 | |
| Week Change: 4.14% Year-to-date Change: -32.7% | |
| KRKR Links: Profile News Message Board | |
| Charts:- Daily , Weekly | |
| Add KRKR to Watchlist: View: Get Complete KRKR Trend Analysis ➞ | |
 | NOVT Novanta Inc. |
| Sector: Technology | |
| SubSector: Scientific & Technical Instruments | |
| MarketCap: 2680.83 Millions | |
| Recent Price: 159.38 Smart Investing & Trading Score: 58 | |
| Day Percent Change: 4.10% Day Change: 6.27 | |
| Week Change: 6.77% Year-to-date Change: -5.4% | |
| NOVT Links: Profile News Message Board | |
| Charts:- Daily , Weekly | |
| Add NOVT to Watchlist: View: Get Complete NOVT Trend Analysis ➞ | |
 | VRNT Verint Systems Inc. |
| Sector: Technology | |
| SubSector: Business Software & Services | |
| MarketCap: 2902.18 Millions | |
| Recent Price: 30.35 Smart Investing & Trading Score: 76 | |
| Day Percent Change: 4.08% Day Change: 1.19 | |
| Week Change: 4.15% Year-to-date Change: 12.3% | |
| VRNT Links: Profile News Message Board | |
| Charts:- Daily , Weekly | |
| Add VRNT to Watchlist: View: Get Complete VRNT Trend Analysis ➞ | |
 | ZG Zillow Group, Inc. |
| Sector: Technology | |
| SubSector: Internet Information Providers | |
| MarketCap: 6536.7 Millions | |
| Recent Price: 43.18 Smart Investing & Trading Score: 42 | |
| Day Percent Change: 4.02% Day Change: 1.67 | |
| Week Change: 5.21% Year-to-date Change: -23.9% | |
| ZG Links: Profile News Message Board | |
| Charts:- Daily , Weekly | |
| Add ZG to Watchlist: View: Get Complete ZG Trend Analysis ➞ | |
 | CTS CTS Corporation |
| Sector: Technology | |
| SubSector: Diversified Electronics | |
| MarketCap: 645.896 Millions | |
| Recent Price: 45.49 Smart Investing & Trading Score: 83 | |
| Day Percent Change: 3.93% Day Change: 1.72 | |
| Week Change: 4.74% Year-to-date Change: 4.0% | |
| CTS Links: Profile News Message Board | |
| Charts:- Daily , Weekly | |
| Add CTS to Watchlist: View: Get Complete CTS Trend Analysis ➞ | |
 | INSP Inspire Medical Systems, Inc. |
| Sector: Technology | |
| SubSector: Internet Information Providers | |
| MarketCap: 1239.8 Millions | |
| Recent Price: 233.93 Smart Investing & Trading Score: 63 | |
| Day Percent Change: 3.87% Day Change: 8.71 | |
| Week Change: 2.05% Year-to-date Change: 15.0% | |
| INSP Links: Profile News Message Board | |
| Charts:- Daily , Weekly | |
| Add INSP to Watchlist: View: Get Complete INSP Trend Analysis ➞ | |
 | SANM Sanmina Corporation |
| Sector: Technology | |
| SubSector: Diversified Electronics | |
| MarketCap: 1790.36 Millions | |
| Recent Price: 60.97 Smart Investing & Trading Score: 100 | |
| Day Percent Change: 3.80% Day Change: 2.23 | |
| Week Change: 5.5% Year-to-date Change: 18.7% | |
| SANM Links: Profile News Message Board | |
| Charts:- Daily , Weekly | |
| Add SANM to Watchlist: View: Get Complete SANM Trend Analysis ➞ | |
 | ICHR Ichor Holdings, Ltd. |
| Sector: Technology | |
| SubSector: Semiconductor Equipment & Materials | |
| MarketCap: 409.018 Millions | |
| Recent Price: 37.54 Smart Investing & Trading Score: 56 | |
| Day Percent Change: 3.79% Day Change: 1.37 | |
| Week Change: 1.82% Year-to-date Change: 11.6% | |
| ICHR Links: Profile News Message Board | |
| Charts:- Daily , Weekly | |
| Add ICHR to Watchlist: View: Get Complete ICHR Trend Analysis ➞ | |
 | FROG JFrog Ltd. |
| Sector: Technology | |
| SubSector: Software Application | |
| MarketCap: 62287 Millions | |
| Recent Price: 39.17 Smart Investing & Trading Score: 65 | |
| Day Percent Change: 3.79% Day Change: 1.43 | |
| Week Change: 4.68% Year-to-date Change: 13.1% | |
| FROG Links: Profile News Message Board | |
| Charts:- Daily , Weekly | |
| Add FROG to Watchlist: View: Get Complete FROG Trend Analysis ➞ | |
 | DSP Viant Technology Inc. |
| Sector: Technology | |
| SubSector: Software - Application | |
| MarketCap: 279 Millions | |
| Recent Price: 9.06 Smart Investing & Trading Score: 63 | |
| Day Percent Change: 3.78% Day Change: 0.33 | |
| Week Change: 6.59% Year-to-date Change: 30.6% | |
| DSP Links: Profile News Message Board | |
| Charts:- Daily , Weekly | |
| Add DSP to Watchlist: View: Get Complete DSP Trend Analysis ➞ | |
 | NET Cloudflare, Inc. |
| Sector: Technology | |
| SubSector: Application Software | |
| MarketCap: 7063.72 Millions | |
| Recent Price: 87.88 Smart Investing & Trading Score: 58 | |
| Day Percent Change: 3.77% Day Change: 3.19 | |
| Week Change: 4.49% Year-to-date Change: 5.6% | |
| NET Links: Profile News Message Board | |
| Charts:- Daily , Weekly | |
| Add NET to Watchlist: View: Get Complete NET Trend Analysis ➞ | |
 | VIOT Viomi Technology Co., Ltd |
| Sector: Technology | |
| SubSector: Electronic Equipment | |
| MarketCap: 357.2 Millions | |
| Recent Price: 0.55 Smart Investing & Trading Score: 25 | |
| Day Percent Change: 3.77% Day Change: 0.02 | |
| Week Change: 0.82% Year-to-date Change: -45.0% | |
| VIOT Links: Profile News Message Board | |
| Charts:- Daily , Weekly | |
| Add VIOT to Watchlist: View: Get Complete VIOT Trend Analysis ➞ | |
 | SABR Sabre Corporation |
| Sector: Technology | |
| SubSector: Information Technology Services | |
| MarketCap: 152.468 Millions | |
| Recent Price: 2.76 Smart Investing & Trading Score: 69 | |
| Day Percent Change: 3.76% Day Change: 0.10 | |
| Week Change: 11.29% Year-to-date Change: -37.3% | |
| SABR Links: Profile News Message Board | |
| Charts:- Daily , Weekly | |
| Add SABR to Watchlist: View: Get Complete SABR Trend Analysis ➞ | |
 | ACIW ACI Worldwide, Inc. |
| Sector: Technology | |
| SubSector: Technical & System Software | |
| MarketCap: 2645.7 Millions | |
| Recent Price: 33.46 Smart Investing & Trading Score: 100 | |
| Day Percent Change: 3.75% Day Change: 1.21 | |
| Week Change: 4.73% Year-to-date Change: 9.4% | |
| ACIW Links: Profile News Message Board | |
| Charts:- Daily , Weekly | |
| Add ACIW to Watchlist: View: Get Complete ACIW Trend Analysis ➞ | |
 | HIVE Aerohive Networks, Inc. |
| Sector: Technology | |
| SubSector: Communication Equipment | |
| MarketCap: 225.85 Millions | |
| Recent Price: 3.05 Smart Investing & Trading Score: 80 | |
| Day Percent Change: 3.74% Day Change: 0.11 | |
| Week Change: 12.55% Year-to-date Change: -32.7% | |
| HIVE Links: Profile News Message Board | |
| Charts:- Daily , Weekly | |
| Add HIVE to Watchlist: View: Get Complete HIVE Trend Analysis ➞ | |
 | ITRI Itron, Inc. |
| Sector: Technology | |
| SubSector: Scientific & Technical Instruments | |
| MarketCap: 2222.23 Millions | |
| Recent Price: 94.84 Smart Investing & Trading Score: 95 | |
| Day Percent Change: 3.70% Day Change: 3.38 | |
| Week Change: 5.75% Year-to-date Change: 25.6% | |
| ITRI Links: Profile News Message Board | |
| Charts:- Daily , Weekly | |
| Add ITRI to Watchlist: View: Get Complete ITRI Trend Analysis ➞ | |
 | NVDA NVIDIA Corporation |
| Sector: Technology | |
| SubSector: Semiconductor - Specialized | |
| MarketCap: 143476 Millions | |
| Recent Price: 824.23 Smart Investing & Trading Score: 48 | |
| Day Percent Change: 3.65% Day Change: 29.05 | |
| Week Change: 8.17% Year-to-date Change: 66.4% | |
| NVDA Links: Profile News Message Board | |
| Charts:- Daily , Weekly | |
| Add NVDA to Watchlist: View: Get Complete NVDA Trend Analysis ➞ | |
 | GWRE Guidewire Software, Inc. |
| Sector: Technology | |
| SubSector: Business Software & Services | |
| MarketCap: 7073.18 Millions | |
| Recent Price: 113.78 Smart Investing & Trading Score: 75 | |
| Day Percent Change: 3.63% Day Change: 3.99 | |
| Week Change: 5.7% Year-to-date Change: 4.4% | |
| GWRE Links: Profile News Message Board | |
| Charts:- Daily , Weekly | |
| Add GWRE to Watchlist: View: Get Complete GWRE Trend Analysis ➞ | |
 | CRWD CrowdStrike Holdings, Inc. |
| Sector: Technology | |
| SubSector: Security Software & Services | |
| MarketCap: 11803.6 Millions | |
| Recent Price: 299.65 Smart Investing & Trading Score: 58 | |
| Day Percent Change: 3.63% Day Change: 10.50 | |
| Week Change: 6.01% Year-to-date Change: 17.4% | |
| CRWD Links: Profile News Message Board | |
| Charts:- Daily , Weekly | |
| Add CRWD to Watchlist: View: Get Complete CRWD Trend Analysis ➞ | |
 | DXC DXC Technology Company |
| Sector: Technology | |
| SubSector: Information Technology Services | |
| MarketCap: 3622.28 Millions | |
| Recent Price: 21.16 Smart Investing & Trading Score: 74 | |
| Day Percent Change: 3.62% Day Change: 0.74 | |
| Week Change: 5.06% Year-to-date Change: -7.5% | |
| DXC Links: Profile News Message Board | |
| Charts:- Daily , Weekly | |
| Add DXC to Watchlist: View: Get Complete DXC Trend Analysis ➞ | |
| For tabular summary view of above stock list: Summary View ➞ 0 - 25 , 25 - 50 , 50 - 75 , 75 - 100 , 100 - 125 , 125 - 150 , 150 - 175 , 175 - 200 , 200 - 225 , 225 - 250 , 250 - 275 , 275 - 300 , 300 - 325 , 325 - 350 , 350 - 375 , 375 - 400 , 400 - 425 , 425 - 450 , 450 - 475 , 475 - 500 , 500 - 525 , 525 - 550 , 550 - 575 , 575 - 600 , 600 - 625 , 625 - 650 | ||
| Click To Change The Sort Order: By Market Cap or Company Size Performance: Year-to-date, Week and Day | |
| Select Chart Type: | ||
|
Best Stocks Today 12Stocks.com |
© 2024 12Stocks.com Terms & Conditions Privacy Contact Us
All Information Provided Only For Education And Not To Be Used For Investing or Trading. See Terms & Conditions


One More Thing ... Get Best Stocks Delivered Daily!
Never Ever Miss A Move With Our Top Ten Stocks Lists
Find Best Stocks In Any Market - Bull or Bear Market
Take A Peek At Our Top Ten Stocks Lists: Daily, Weekly, Year-to-Date & Top Trends
Find Best Stocks In Any Market - Bull or Bear Market
Take A Peek At Our Top Ten Stocks Lists: Daily, Weekly, Year-to-Date & Top Trends
Technology Stocks With Best Up Trends [0-bearish to 100-bullish]: HashiCorp [100], Akoustis [100], ScanSource [100], iQIYI [100], Xunlei [100], Tencent Music[100], Payoneer Global[100], Grab [100], Sea [100], Sanmina [100], ACI Worldwide[100]
Best Technology Stocks Year-to-Date:
Pagaya [574.82%], MediaCo Holding[367.14%], CXApp [172.59%], Super Micro[168.02%], Smith Micro[156.66%], Uxin [136.8%], MicroStrategy [111.94%], GigaCloud [102.02%], CuriosityStream [99.96%], SoundHound AI[95.09%], NextNav [94.49%] Best Technology Stocks This Week:
Matterport [164.37%], HashiCorp [22.53%], Akoustis [21.29%], BigBear.ai [17.93%], SoundHound AI[17.61%], Cheetah Mobile[14.69%], MicroStrategy [14.01%], Sea [12.62%], Aerohive Networks[12.55%], IonQ [12.41%], iQIYI [12.12%] Best Technology Stocks Daily:
HashiCorp [19.54%], Akoustis [10.48%], SoundHound AI[10.45%], on [10.02%], BigBear.ai [9.62%], HealthStream [9.54%], MediaCo Holding[9.34%], Uxin [9.21%], Vacasa [9.18%], Ebang [9.17%], Cheetah Mobile[8.85%]