
 Login Sign Up


| |||||
 |  | ||||

| 12Stocks.com Market Intelligence |
Best SmallCap Stocks
|
| In a hurry? Small Cap Stock Lists: Performance Trends Table, Stock Charts
Sort Small Cap stocks: Daily, Weekly, Year-to-Date, Market Cap & Trends. Filter Small Cap stocks list by sector: Show all, Tech, Finance, Energy, Staples, Retail, Industrial, Materials, Utilities and HealthCare Filter Small Cap stocks list by size: All Large Medium Small and MicroCap |
| 12Stocks.com Small Cap Stocks Performances & Trends Daily | |||||||||
|
|  The overall Smart Investing & Trading Score is 90 (0-bearish to 100-bullish) which puts Small Cap index in short term bullish trend. The Smart Investing & Trading Score from previous trading session is 100 and hence a deterioration of trend.
| ||||||||
Here are the Smart Investing & Trading Scores of the most requested small cap stocks at 12Stocks.com (click stock name for detailed review):
|


| 12Stocks.com: Investing in Smallcap Index with Stocks | |
|
The following table helps investors and traders sort through current performance and trends (as measured by Smart Investing & Trading Score) of various
stocks in the Smallcap Index. Quick View: Move mouse or cursor over stock symbol (ticker) to view short-term technical chart and over stock name to view long term chart. Click on  to add stock symbol to your watchlist and to add stock symbol to your watchlist and  to view watchlist. Click on any ticker or stock name for detailed market intelligence report for that stock. to view watchlist. Click on any ticker or stock name for detailed market intelligence report for that stock. |
12Stocks.com Performance of Stocks in Smallcap Index
| Ticker | Stock Name | Watchlist | Category | Recent Price | Smart Investing & Trading Score | Change % | Weekly Change% |
| JACK | Jack in |   | Services & Goods | 55.25 | 49 | 3.45% | 4.62% |
| ANF | Abercrombie & Fitch Co | | Services & Goods | 135.69 | 85 | -1.45% | 4.61% |
| TBI | TrueBlue | | Services & Goods | 11.31 | 60 | 2.91% | 4.53% |
| DHT | DHT | | Transports | 12.64 | 100 | 2.93% | 4.46% |
| ACHR | Archer Aviation | | Industrials | 3.81 | 30 | -2.06% | 4.38% |
| TRST | TrustCo Bank | | Financials | 29.54 | 100 | 2.53% | 4.34% |
| SASR | Sandy Spring | | Financials | 23.80 | 95 | 0.98% | 4.25% |
| TCX | Tucows | | Technology | 18.87 | 70 | -2.68% | 4.17% |
| STNG | Scorpio Tankers | | Transports | 81.05 | 95 | 1.69% | 4.15% |
| CDXS | Codexis | | Health Care | 3.77 | 64 | 1.89% | 4.14% |
| SPRY | ARS | | Health Care | 9.10 | 76 | 2.48% | 4.12% |
| GLNG | Golar LNG | | Transports | 26.94 | 100 | 0.30% | 4.06% |
| LC | LendingClub | | Financials | 9.37 | 90 | -1.06% | 4.00% |
| TSE | Trinseo S.A | | Materials | 3.42 | 62 | 1.79% | 3.95% |
| MLAB | Mesa | | Technology | 120.61 | 95 | 1.69% | 3.94% |
| SLP | Simulations Plus | | Technology | 50.20 | 88 | -0.09% | 3.86% |
| EGBN | Eagle Bancorp | | Financials | 20.70 | 74 | 1.62% | 3.81% |
| TRS | TriMas | | Industrials | 27.80 | 100 | 0.98% | 3.73% |
| ATEX | Anterix | | Technology | 33.01 | 69 | 0.89% | 3.54% |
| MYPS | PLAYSTUDIOS | | Services & Goods | 2.37 | 32 | -0.42% | 3.49% |
| INSW | Seaways | | Services & Goods | 63.50 | 90 | 1.23% | 3.39% |
| SPTN | SpartanNash | | Consumer Staples | 21.02 | 87 | 1.94% | 3.29% |
| FARO | FARO | | Technology | 19.57 | 62 | 1.87% | 3.27% |
| ENTA | Enanta | | Health Care | 13.06 | 57 | -2.10% | 3.24% |
| SPNS | Sapiens | | Technology | 34.33 | 83 | -0.92% | 3.22% |
| For chart view version of above stock list: Chart View ➞ 0 - 25 , 25 - 50 , 50 - 75 , 75 - 100 , 100 - 125 , 125 - 150 , 150 - 175 , 175 - 200 , 200 - 225 , 225 - 250 , 250 - 275 , 275 - 300 , 300 - 325 , 325 - 350 | ||
 | Click To Change The Sort Order: By Market Cap or Company Size Performance: Year-to-date, Week and Day |  |
| Too many stocks? View smallcap stocks filtered by marketcap & sector |
| Marketcap: All SmallCap Stocks (default-no microcap), Large, Mid-Range, Small |
| Smallcap Sector: Tech, Finance, Energy, Staples, Retail, Industrial, Materials, & Medical |
|
Get the most comprehensive stock market coverage daily at 12Stocks.com ➞ Best Stocks Today ➞ Best Stocks Weekly ➞ Best Stocks Year-to-Date ➞ Best Stocks Trends ➞  Best Stocks Today 12Stocks.com Best Nasdaq Stocks ➞ Best S&P 500 Stocks ➞ Best Tech Stocks ➞ Best Biotech Stocks ➞ |
| Detailed Overview of SmallCap Stocks |
| SmallCap Technical Overview, Leaders & Laggards, Top SmallCap ETF Funds & Detailed SmallCap Stocks List, Charts, Trends & More |
| Smallcap: Technical Analysis, Trends & YTD Performance | |
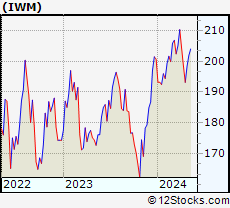
| SmallCap segment as represented by
IWM, an exchange-traded fund [ETF], holds basket of thousands of smallcap stocks from across all major sectors of the US stock market. The smallcap index (contains stocks like Riverbed & Sotheby's) is up by 3.6% and is currently underperforming the overall market by -6.82% year-to-date. Below is a quick view of technical charts and trends: | |
 IWM Weekly Chart |
|
| Long Term Trend: Very Good | |
| Medium Term Trend: Very Good | |
 IWM Daily Chart |
|
| Short Term Trend: Good | |
| Overall Trend Score: 90 | |
| YTD Performance: 3.6% | |
| **Trend Scores & Views Are Only For Educational Purposes And Not For Investing | |
| 12Stocks.com: Top Performing Small Cap Index Stocks | ||||||||||||||||||||||||||||||||||||||||||||||||
 The top performing Small Cap Index stocks year to date are
Now, more recently, over last week, the top performing Small Cap Index stocks on the move are


|
||||||||||||||||||||||||||||||||||||||||||||||||
| 12Stocks.com: Investing in Smallcap Index using Exchange Traded Funds | |
|
The following table shows list of key exchange traded funds (ETF) that
help investors track Smallcap index. The following list also includes leveraged ETF funds that track twice or thrice the daily returns of Smallcap indices. Short or inverse ETF funds move in the opposite direction to the index they track and are useful during market pullbacks or during bear markets. Quick View: Move mouse or cursor over ETF symbol (ticker) to view short-term technical chart and over ETF name to view long term chart. Click on ticker or stock name for detailed view. Click on to add stock symbol to your watchlist and to view watchlist. |
12Stocks.com List of ETFs that track Smallcap Index
| Ticker | ETF Name | Watchlist | Recent Price | Smart Investing & Trading Score | Change % | Week % | Year-to-date % |
| IWM | iShares Russell 2000 | | 207.93 | 90 | -0.72 | 1.77 | 3.6% |
| VTWO | Vanguard Russell 2000 ETF | | 84.11 | 85 | -0.61 | 1.8 | 3.71% |
| IJR | iShares Core S&P Small-Cap | | 110.63 | 83 | -0.14 | 1.51 | 2.2% |
| IWN | iShares Russell 2000 Value | | 158.82 | 88 | 0.06 | 1.68 | 2.25% |
| IJT | iShares S&P Small-Cap 600 Growth | | 131.29 | 78 | -0.69 | 1.1 | 4.91% |
| IJS | iShares S&P Small-Cap 600 Value | | 102.02 | 83 | -0.11 | 1.49 | -1.02% |
| IWO | iShares Russell 2000 Growth | | 267.15 | 95 | 0.21 | 2.78 | 5.92% |
| XSLV | PowerShares S&P SmallCap Low Volatil ETF | | 44.48 | 76 | -0.02 | 0.57 | 0.75% |
| SBB | ProShares Short SmallCap600 | | 15.71 | 17 | 0.32 | -1.54 | -1.38% |
| SAA | ProShares Ultra SmallCap600 | | 24.78 | 71 | -1.69 | 1.77 | -0.68% |
| SMLV | SPDR SSGA US Small Cap Low Volatil ETF | | 112.79 | 95 | 0.22 | 1.41 | 0.24% |
| SDD | ProShares UltraShort SmallCap600 | | 17.67 | 27 | 0.00 | -3.34 | -4.11% |
| 12Stocks.com: Charts, Trends, Fundamental Data and Performances of SmallCap Stocks | |
|
We now take in-depth look at all SmallCap stocks including charts, multi-period performances and overall trends (as measured by Smart Investing & Trading Score). One can sort SmallCap stocks (click link to choose) by Daily, Weekly and by Year-to-Date performances. Also, one can sort by size of the company or by market capitalization. |
| Select Your Default Chart Type: | |||||
| |||||
| Click on stock symbol or name for detailed view. Click on to add stock symbol to your watchlist and to view watchlist. Quick View: Move mouse or cursor over "Daily" to quickly view daily technical stock chart and over "Weekly" to view weekly technical stock chart. | |||||

 | JACK Jack in the Box Inc. |
| Sector: Services & Goods | |
| SubSector: Restaurants | |
| MarketCap: 633.87 Millions | |
| Recent Price: 55.25 Smart Investing & Trading Score: 49 | |
| Day Percent Change: 3.45% Day Change: 1.84 | |
| Week Change: 4.62% Year-to-date Change: -32.3% | |
| JACK Links: Profile News Message Board | |
| Charts:- Daily , Weekly | |
| Add JACK to Watchlist: View: Get Complete JACK Trend Analysis ➞ | |
 | ANF Abercrombie & Fitch Co. |
| Sector: Services & Goods | |
| SubSector: Apparel Stores | |
| MarketCap: 589.108 Millions | |
| Recent Price: 135.69 Smart Investing & Trading Score: 85 | |
| Day Percent Change: -1.45% Day Change: -1.99 | |
| Week Change: 4.61% Year-to-date Change: 53.8% | |
| ANF Links: Profile News Message Board | |
| Charts:- Daily , Weekly | |
| Add ANF to Watchlist: View: Get Complete ANF Trend Analysis ➞ | |
 | TBI TrueBlue, Inc. |
| Sector: Services & Goods | |
| SubSector: Staffing & Outsourcing Services | |
| MarketCap: 563.228 Millions | |
| Recent Price: 11.31 Smart Investing & Trading Score: 60 | |
| Day Percent Change: 2.91% Day Change: 0.32 | |
| Week Change: 4.53% Year-to-date Change: -26.3% | |
| TBI Links: Profile News Message Board | |
| Charts:- Daily , Weekly | |
| Add TBI to Watchlist: View: Get Complete TBI Trend Analysis ➞ | |
 | DHT DHT Holdings, Inc. |
| Sector: Transports | |
| SubSector: Shipping | |
| MarketCap: 754.514 Millions | |
| Recent Price: 12.64 Smart Investing & Trading Score: 100 | |
| Day Percent Change: 2.93% Day Change: 0.36 | |
| Week Change: 4.46% Year-to-date Change: 28.9% | |
| DHT Links: Profile News Message Board | |
| Charts:- Daily , Weekly | |
| Add DHT to Watchlist: View: Get Complete DHT Trend Analysis ➞ | |
 | ACHR Archer Aviation Inc. |
| Sector: Industrials | |
| SubSector: Aerospace & Defense | |
| MarketCap: 976 Millions | |
| Recent Price: 3.81 Smart Investing & Trading Score: 30 | |
| Day Percent Change: -2.06% Day Change: -0.08 | |
| Week Change: 4.38% Year-to-date Change: -37.8% | |
| ACHR Links: Profile News Message Board | |
| Charts:- Daily , Weekly | |
| Add ACHR to Watchlist: View: Get Complete ACHR Trend Analysis ➞ | |
 | TRST TrustCo Bank Corp NY |
| Sector: Financials | |
| SubSector: Regional - Northeast Banks | |
| MarketCap: 543.999 Millions | |
| Recent Price: 29.54 Smart Investing & Trading Score: 100 | |
| Day Percent Change: 2.53% Day Change: 0.73 | |
| Week Change: 4.34% Year-to-date Change: -4.9% | |
| TRST Links: Profile News Message Board | |
| Charts:- Daily , Weekly | |
| Add TRST to Watchlist: View: Get Complete TRST Trend Analysis ➞ | |
 | SASR Sandy Spring Bancorp, Inc. |
| Sector: Financials | |
| SubSector: Regional - Mid-Atlantic Banks | |
| MarketCap: 764.659 Millions | |
| Recent Price: 23.80 Smart Investing & Trading Score: 95 | |
| Day Percent Change: 0.98% Day Change: 0.23 | |
| Week Change: 4.25% Year-to-date Change: -12.6% | |
| SASR Links: Profile News Message Board | |
| Charts:- Daily , Weekly | |
| Add SASR to Watchlist: View: Get Complete SASR Trend Analysis ➞ | |
 | TCX Tucows Inc. |
| Sector: Technology | |
| SubSector: Internet Information Providers | |
| MarketCap: 557.78 Millions | |
| Recent Price: 18.87 Smart Investing & Trading Score: 70 | |
| Day Percent Change: -2.68% Day Change: -0.52 | |
| Week Change: 4.17% Year-to-date Change: -30.1% | |
| TCX Links: Profile News Message Board | |
| Charts:- Daily , Weekly | |
| Add TCX to Watchlist: View: Get Complete TCX Trend Analysis ➞ | |
 | STNG Scorpio Tankers Inc. |
| Sector: Transports | |
| SubSector: Shipping | |
| MarketCap: 813.214 Millions | |
| Recent Price: 81.05 Smart Investing & Trading Score: 95 | |
| Day Percent Change: 1.69% Day Change: 1.35 | |
| Week Change: 4.15% Year-to-date Change: 33.3% | |
| STNG Links: Profile News Message Board | |
| Charts:- Daily , Weekly | |
| Add STNG to Watchlist: View: Get Complete STNG Trend Analysis ➞ | |
 | CDXS Codexis, Inc. |
| Sector: Health Care | |
| SubSector: Biotechnology | |
| MarketCap: 592.185 Millions | |
| Recent Price: 3.77 Smart Investing & Trading Score: 64 | |
| Day Percent Change: 1.89% Day Change: 0.07 | |
| Week Change: 4.14% Year-to-date Change: 23.6% | |
| CDXS Links: Profile News Message Board | |
| Charts:- Daily , Weekly | |
| Add CDXS to Watchlist: View: Get Complete CDXS Trend Analysis ➞ | |
 | SPRY ARS Pharmaceuticals, Inc. |
| Sector: Health Care | |
| SubSector: Biotechnology | |
| MarketCap: 632 Millions | |
| Recent Price: 9.10 Smart Investing & Trading Score: 76 | |
| Day Percent Change: 2.48% Day Change: 0.22 | |
| Week Change: 4.12% Year-to-date Change: 60.1% | |
| SPRY Links: Profile News Message Board | |
| Charts:- Daily , Weekly | |
| Add SPRY to Watchlist: View: Get Complete SPRY Trend Analysis ➞ | |
 | GLNG Golar LNG Limited |
| Sector: Transports | |
| SubSector: Shipping | |
| MarketCap: 854.414 Millions | |
| Recent Price: 26.94 Smart Investing & Trading Score: 100 | |
| Day Percent Change: 0.30% Day Change: 0.08 | |
| Week Change: 4.06% Year-to-date Change: 17.2% | |
| GLNG Links: Profile News Message Board | |
| Charts:- Daily , Weekly | |
| Add GLNG to Watchlist: View: Get Complete GLNG Trend Analysis ➞ | |
 | LC LendingClub Corporation |
| Sector: Financials | |
| SubSector: Credit Services | |
| MarketCap: 852.308 Millions | |
| Recent Price: 9.37 Smart Investing & Trading Score: 90 | |
| Day Percent Change: -1.06% Day Change: -0.10 | |
| Week Change: 4% Year-to-date Change: 7.2% | |
| LC Links: Profile News Message Board | |
| Charts:- Daily , Weekly | |
| Add LC to Watchlist: View: Get Complete LC Trend Analysis ➞ | |
 | TSE Trinseo S.A. |
| Sector: Materials | |
| SubSector: Specialty Chemicals | |
| MarketCap: 790.057 Millions | |
| Recent Price: 3.42 Smart Investing & Trading Score: 62 | |
| Day Percent Change: 1.79% Day Change: 0.06 | |
| Week Change: 3.95% Year-to-date Change: -59.1% | |
| TSE Links: Profile News Message Board | |
| Charts:- Daily , Weekly | |
| Add TSE to Watchlist: View: Get Complete TSE Trend Analysis ➞ | |
 | MLAB Mesa Laboratories, Inc. |
| Sector: Technology | |
| SubSector: Scientific & Technical Instruments | |
| MarketCap: 935.453 Millions | |
| Recent Price: 120.61 Smart Investing & Trading Score: 95 | |
| Day Percent Change: 1.69% Day Change: 2.01 | |
| Week Change: 3.94% Year-to-date Change: 15.1% | |
| MLAB Links: Profile News Message Board | |
| Charts:- Daily , Weekly | |
| Add MLAB to Watchlist: View: Get Complete MLAB Trend Analysis ➞ | |
 | SLP Simulations Plus, Inc. |
| Sector: Technology | |
| SubSector: Business Software & Services | |
| MarketCap: 564.258 Millions | |
| Recent Price: 50.20 Smart Investing & Trading Score: 88 | |
| Day Percent Change: -0.09% Day Change: -0.05 | |
| Week Change: 3.86% Year-to-date Change: 12.2% | |
| SLP Links: Profile News Message Board | |
| Charts:- Daily , Weekly | |
| Add SLP to Watchlist: View: Get Complete SLP Trend Analysis ➞ | |
 | EGBN Eagle Bancorp, Inc. |
| Sector: Financials | |
| SubSector: Regional - Mid-Atlantic Banks | |
| MarketCap: 906.559 Millions | |
| Recent Price: 20.70 Smart Investing & Trading Score: 74 | |
| Day Percent Change: 1.62% Day Change: 0.33 | |
| Week Change: 3.81% Year-to-date Change: -31.3% | |
| EGBN Links: Profile News Message Board | |
| Charts:- Daily , Weekly | |
| Add EGBN to Watchlist: View: Get Complete EGBN Trend Analysis ➞ | |
 | TRS TriMas Corporation |
| Sector: Industrials | |
| SubSector: Industrial Equipment & Components | |
| MarketCap: 963.509 Millions | |
| Recent Price: 27.80 Smart Investing & Trading Score: 100 | |
| Day Percent Change: 0.98% Day Change: 0.27 | |
| Week Change: 3.73% Year-to-date Change: 9.8% | |
| TRS Links: Profile News Message Board | |
| Charts:- Daily , Weekly | |
| Add TRS to Watchlist: View: Get Complete TRS Trend Analysis ➞ | |
 | ATEX Anterix Inc. |
| Sector: Technology | |
| SubSector: Telecom Services - Domestic | |
| MarketCap: 694.077 Millions | |
| Recent Price: 33.01 Smart Investing & Trading Score: 69 | |
| Day Percent Change: 0.89% Day Change: 0.29 | |
| Week Change: 3.54% Year-to-date Change: -0.9% | |
| ATEX Links: Profile News Message Board | |
| Charts:- Daily , Weekly | |
| Add ATEX to Watchlist: View: Get Complete ATEX Trend Analysis ➞ | |
 | MYPS PLAYSTUDIOS, Inc. |
| Sector: Services & Goods | |
| SubSector: Electronic Gaming & Multimedia | |
| MarketCap: 635 Millions | |
| Recent Price: 2.37 Smart Investing & Trading Score: 32 | |
| Day Percent Change: -0.42% Day Change: -0.01 | |
| Week Change: 3.49% Year-to-date Change: -11.4% | |
| MYPS Links: Profile News Message Board | |
| Charts:- Daily , Weekly | |
| Add MYPS to Watchlist: View: Get Complete MYPS Trend Analysis ➞ | |
 | INSW International Seaways, Inc. |
| Sector: Services & Goods | |
| SubSector: Business Services | |
| MarketCap: 521.582 Millions | |
| Recent Price: 63.50 Smart Investing & Trading Score: 90 | |
| Day Percent Change: 1.23% Day Change: 0.77 | |
| Week Change: 3.39% Year-to-date Change: 39.6% | |
| INSW Links: Profile News Message Board | |
| Charts:- Daily , Weekly | |
| Add INSW to Watchlist: View: Get Complete INSW Trend Analysis ➞ | |
 | SPTN SpartanNash Company |
| Sector: Consumer Staples | |
| SubSector: Food Wholesale | |
| MarketCap: 671.229 Millions | |
| Recent Price: 21.02 Smart Investing & Trading Score: 87 | |
| Day Percent Change: 1.94% Day Change: 0.40 | |
| Week Change: 3.29% Year-to-date Change: -8.4% | |
| SPTN Links: Profile News Message Board | |
| Charts:- Daily , Weekly | |
| Add SPTN to Watchlist: View: Get Complete SPTN Trend Analysis ➞ | |
 | FARO FARO Technologies, Inc. |
| Sector: Technology | |
| SubSector: Scientific & Technical Instruments | |
| MarketCap: 721.953 Millions | |
| Recent Price: 19.57 Smart Investing & Trading Score: 62 | |
| Day Percent Change: 1.87% Day Change: 0.36 | |
| Week Change: 3.27% Year-to-date Change: -13.1% | |
| FARO Links: Profile News Message Board | |
| Charts:- Daily , Weekly | |
| Add FARO to Watchlist: View: Get Complete FARO Trend Analysis ➞ | |
 | ENTA Enanta Pharmaceuticals, Inc. |
| Sector: Health Care | |
| SubSector: Biotechnology | |
| MarketCap: 998.385 Millions | |
| Recent Price: 13.06 Smart Investing & Trading Score: 57 | |
| Day Percent Change: -2.10% Day Change: -0.28 | |
| Week Change: 3.24% Year-to-date Change: 38.8% | |
| ENTA Links: Profile News Message Board | |
| Charts:- Daily , Weekly | |
| Add ENTA to Watchlist: View: Get Complete ENTA Trend Analysis ➞ | |
 | SPNS Sapiens International Corporation N.V. |
| Sector: Technology | |
| SubSector: Business Software & Services | |
| MarketCap: 841.858 Millions | |
| Recent Price: 34.33 Smart Investing & Trading Score: 83 | |
| Day Percent Change: -0.92% Day Change: -0.32 | |
| Week Change: 3.22% Year-to-date Change: 18.6% | |
| SPNS Links: Profile News Message Board | |
| Charts:- Daily , Weekly | |
| Add SPNS to Watchlist: View: Get Complete SPNS Trend Analysis ➞ | |
| For tabular summary view of above stock list: Summary View ➞ 0 - 25 , 25 - 50 , 50 - 75 , 75 - 100 , 100 - 125 , 125 - 150 , 150 - 175 , 175 - 200 , 200 - 225 , 225 - 250 , 250 - 275 , 275 - 300 , 300 - 325 , 325 - 350 | ||
| Click To Change The Sort Order: By Market Cap or Company Size Performance: Year-to-date, Week and Day | |
| Select Chart Type: | ||
| Too many stocks? View smallcap stocks filtered by marketcap & sector |
| Marketcap: All SmallCap Stocks (default-no microcap), Large, Mid-Range, Small & MicroCap |
| Sector: Tech, Finance, Energy, Staples, Retail, Industrial, Materials, Utilities & Medical |
|
Best Stocks Today 12Stocks.com |
© 2024 12Stocks.com Terms & Conditions Privacy Contact Us
All Information Provided Only For Education And Not To Be Used For Investing or Trading. See Terms & Conditions


One More Thing ... Get Best Stocks Delivered Daily!
Never Ever Miss A Move With Our Top Ten Stocks Lists
Find Best Stocks In Any Market - Bull or Bear Market
Take A Peek At Our Top Ten Stocks Lists: Daily, Weekly, Year-to-Date & Top Trends
Find Best Stocks In Any Market - Bull or Bear Market
Take A Peek At Our Top Ten Stocks Lists: Daily, Weekly, Year-to-Date & Top Trends
Smallcap Stocks With Best Up Trends [0-bearish to 100-bullish]: Trupanion [100], Zura Bio[100], SilverBow Resources[100], Novavax [100], Third Harmonic[100], Hawkins [100], BRP Group[100], Kura Sushi[100], Aurinia [100], Heron [100], Cadiz [100]
Best Smallcap Stocks Year-to-Date:
CareMax [471.13%], Bakkt [370.4%], Janux [342.16%], Viking [304.73%], Alpine Immune[241.18%], Longboard [235.68%], Super Micro[218.16%], Avidity Biosciences[217.7%], Novavax [200%], Arcutis Bio[182.35%], Sweetgreen [181.24%] Best Smallcap Stocks This Week:
Novavax [62.16%], MacroGenics [54.68%], Maxeon Solar[49.31%], SunPower [43.04%], Harrow Health[39.31%], Workhorse Group[39.06%], Humacyte [36.6%], ProKidney [34.88%], Allbirds [33.47%], Cadiz [28.76%], Fossil Group[28.72%] Best Smallcap Stocks Daily:
Maxeon Solar[26.56%], Allakos [22.36%], Ventyx Biosciences[18.85%], Trupanion [15.85%], Zura Bio[15.61%], Beyond Air[15.42%], SilverBow Resources[13.20%], Children s[13.09%], Comtech Tele[12.92%], Aceto [12.14%], Novavax [11.63%]