
 Login Sign Up


| |||||
 |  | ||||

| 12Stocks.com Market Intelligence |
Best SmallCap Stocks
|
| In a hurry? Small Cap Stock Lists: Performance Trends Table, Stock Charts
Sort Small Cap stocks: Daily, Weekly, Year-to-Date, Market Cap & Trends. Filter Small Cap stocks list by sector: Show all, Tech, Finance, Energy, Staples, Retail, Industrial, Materials, Utilities and HealthCare Filter Small Cap stocks list by size: All Large Medium Small and MicroCap |
| 12Stocks.com Small Cap Stocks Performances & Trends Daily | |||||||||
|
|  The overall Smart Investing & Trading Score is 39 (0-bearish to 100-bullish) which puts Small Cap index in short term bearish to neutral trend. The Smart Investing & Trading Score from previous trading session is 14 and hence an improvement of trend.
| ||||||||
Here are the Smart Investing & Trading Scores of the most requested small cap stocks at 12Stocks.com (click stock name for detailed review):
|


| 12Stocks.com: Investing in Smallcap Index with Stocks | |
|
The following table helps investors and traders sort through current performance and trends (as measured by Smart Investing & Trading Score) of various
stocks in the Smallcap Index. Quick View: Move mouse or cursor over stock symbol (ticker) to view short-term technical chart and over stock name to view long term chart. Click on  to add stock symbol to your watchlist and to add stock symbol to your watchlist and  to view watchlist. Click on any ticker or stock name for detailed market intelligence report for that stock. to view watchlist. Click on any ticker or stock name for detailed market intelligence report for that stock. |
12Stocks.com Performance of Stocks in Smallcap Index
| Ticker | Stock Name | Watchlist | Category | Recent Price | Smart Investing & Trading Score | Change % | Weekly Change% |
| TRTX | TPG RE |   | Financials | 8.28 | 100 | -0.18% | 9.60% |
| KNSA | Kiniksa | | Health Care | 19.59 | 64 | 1.01% | 9.59% |
| BV | BrightView | | Industrials | 12.35 | 100 | 9.54% | 9.44% |
| CDLX | Cardlytics | | Technology | 13.47 | 70 | 3.70% | 9.42% |
| UPWK | Upwork | | Technology | 12.65 | 64 | 5.73% | 9.39% |
| FDMT | 4D Molecular | | Health Care | 25.38 | 32 | 0.08% | 9.28% |
| NTLA | Intellia | | Health Care | 22.68 | 59 | 0.80% | 9.25% |
| SILK | Silk Road | | Health Care | 19.45 | 90 | -3.55% | 9.24% |
| MLYS | Mineralys | | Health Care | 12.93 | 67 | 0.23% | 8.98% |
| HLVX | HilleVax | | Health Care | 13.94 | 49 | 3.03% | 8.82% |
| RWT | Redwood Trust | | Financials | 6.22 | 100 | 0.65% | 8.74% |
| RVNC | Revance | | Health Care | 3.69 | 39 | -2.77% | 8.53% |
| CSTL | Castle Biosciences | | Health Care | 22.03 | 100 | 0.05% | 8.31% |
| RYTM | Rhythm | | Health Care | 41.38 | 64 | -0.11% | 8.11% |
| BMEA | Biomea Fusion | | Health Care | 11.64 | 49 | 0.65% | 8.03% |
| SSP | E.W. Scripps | | Services & Goods | 4.00 | 69 | 2.44% | 7.97% |
| TROX | Tronox | | Materials | 18.79 | 100 | 9.95% | 7.49% |
| LYEL | Lyell Immunopharma | | Health Care | 2.33 | 30 | -0.21% | 7.39% |
| MLAB | Mesa | | Technology | 110.68 | 100 | 0.45% | 7.25% |
| TCBK | TriCo Bancshares | | Financials | 36.29 | 100 | 1.68% | 7.21% |
| ME | 23andMe Holding | | Health Care | 0.50 | 37 | -0.76% | 7.17% |
| MOND | Mondee | | Services & Goods | 2.32 | 88 | 0.87% | 6.42% |
| BE | Bloom Energy | | Utilities | 11.24 | 100 | -0.57% | 6.08% |
| GLT | P. H. | | Consumer Staples | 1.58 | 37 | 6.04% | 6.04% |
| XPER | Xperi | | Technology | 10.54 | 54 | 0.57% | 5.93% |
| For chart view version of above stock list: Chart View ➞ 0 - 25 , 25 - 50 , 50 - 75 , 75 - 100 , 100 - 125 , 125 - 150 , 150 - 175 , 175 - 200 , 200 - 225 , 225 - 250 , 250 - 275 , 275 - 300 , 300 - 325 , 325 - 350 | ||
 | Click To Change The Sort Order: By Market Cap or Company Size Performance: Year-to-date, Week and Day |  |
| Too many stocks? View smallcap stocks filtered by marketcap & sector |
| Marketcap: All SmallCap Stocks (default-no microcap), Large, Mid-Range, Small |
| Smallcap Sector: Tech, Finance, Energy, Staples, Retail, Industrial, Materials, & Medical |
|
Get the most comprehensive stock market coverage daily at 12Stocks.com ➞ Best Stocks Today ➞ Best Stocks Weekly ➞ Best Stocks Year-to-Date ➞ Best Stocks Trends ➞  Best Stocks Today 12Stocks.com Best Nasdaq Stocks ➞ Best S&P 500 Stocks ➞ Best Tech Stocks ➞ Best Biotech Stocks ➞ |
| Detailed Overview of SmallCap Stocks |
| SmallCap Technical Overview, Leaders & Laggards, Top SmallCap ETF Funds & Detailed SmallCap Stocks List, Charts, Trends & More |
| Smallcap: Technical Analysis, Trends & YTD Performance | |
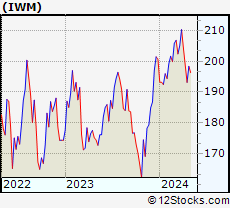
| SmallCap segment as represented by
IWM, an exchange-traded fund [ETF], holds basket of thousands of smallcap stocks from across all major sectors of the US stock market. The smallcap index (contains stocks like Riverbed & Sotheby's) is down by -1.02% and is currently underperforming the overall market by -6.17% year-to-date. Below is a quick view of technical charts and trends: | |
 IWM Weekly Chart |
|
| Long Term Trend: Not Good | |
| Medium Term Trend: Not Good | |
 IWM Daily Chart |
|
| Short Term Trend: Deteriorating | |
| Overall Trend Score: 39 | |
| YTD Performance: -1.02% | |
| **Trend Scores & Views Are Only For Educational Purposes And Not For Investing | |
| 12Stocks.com: Top Performing Small Cap Index Stocks | ||||||||||||||||||||||||||||||||||||||||||||||||
 The top performing Small Cap Index stocks year to date are
Now, more recently, over last week, the top performing Small Cap Index stocks on the move are


|
||||||||||||||||||||||||||||||||||||||||||||||||
| 12Stocks.com: Investing in Smallcap Index using Exchange Traded Funds | |
|
The following table shows list of key exchange traded funds (ETF) that
help investors track Smallcap index. The following list also includes leveraged ETF funds that track twice or thrice the daily returns of Smallcap indices. Short or inverse ETF funds move in the opposite direction to the index they track and are useful during market pullbacks or during bear markets. Quick View: Move mouse or cursor over ETF symbol (ticker) to view short-term technical chart and over ETF name to view long term chart. Click on ticker or stock name for detailed view. Click on to add stock symbol to your watchlist and to view watchlist. |
12Stocks.com List of ETFs that track Smallcap Index
| Ticker | ETF Name | Watchlist | Recent Price | Smart Investing & Trading Score | Change % | Week % | Year-to-date % |
| IWM | iShares Russell 2000 | | 198.66 | 39 | 1.20 | 0.14 | -1.02% |
| IJR | iShares Core S&P Small-Cap | | 105.66 | 50 | 0.88 | 0.01 | -2.39% |
| IWN | iShares Russell 2000 Value | | 151.74 | 50 | 1.28 | 0.39 | -2.31% |
| IWO | iShares Russell 2000 Growth | | 252.43 | 17 | 1.14 | -0.26 | 0.08% |
| 12Stocks.com: Charts, Trends, Fundamental Data and Performances of SmallCap Stocks | |
|
We now take in-depth look at all SmallCap stocks including charts, multi-period performances and overall trends (as measured by Smart Investing & Trading Score). One can sort SmallCap stocks (click link to choose) by Daily, Weekly and by Year-to-Date performances. Also, one can sort by size of the company or by market capitalization. |
| Select Your Default Chart Type: | |||||
| |||||
| Click on stock symbol or name for detailed view. Click on to add stock symbol to your watchlist and to view watchlist. Quick View: Move mouse or cursor over "Daily" to quickly view daily technical stock chart and over "Weekly" to view weekly technical stock chart. | |||||

 | TRTX TPG RE Finance Trust, Inc. |
| Sector: Financials | |
| SubSector: Mortgage Investment | |
| MarketCap: 607.739 Millions | |
| Recent Price: 8.28 Smart Investing & Trading Score: 100 | |
| Day Percent Change: -0.18% Day Change: -0.01 | |
| Week Change: 9.6% Year-to-date Change: 27.3% | |
| TRTX Links: Profile News Message Board | |
| Charts:- Daily , Weekly | |
| Add TRTX to Watchlist: View: Get Complete TRTX Trend Analysis ➞ | |
 | KNSA Kiniksa Pharmaceuticals, Ltd. |
| Sector: Health Care | |
| SubSector: Biotechnology | |
| MarketCap: 780.285 Millions | |
| Recent Price: 19.59 Smart Investing & Trading Score: 64 | |
| Day Percent Change: 1.01% Day Change: 0.20 | |
| Week Change: 9.59% Year-to-date Change: 11.7% | |
| KNSA Links: Profile News Message Board | |
| Charts:- Daily , Weekly | |
| Add KNSA to Watchlist: View: Get Complete KNSA Trend Analysis ➞ | |
 | BV BrightView Holdings, Inc. |
| Sector: Industrials | |
| SubSector: General Contractors | |
| MarketCap: 973.763 Millions | |
| Recent Price: 12.35 Smart Investing & Trading Score: 100 | |
| Day Percent Change: 9.54% Day Change: 1.08 | |
| Week Change: 9.44% Year-to-date Change: 46.6% | |
| BV Links: Profile News Message Board | |
| Charts:- Daily , Weekly | |
| Add BV to Watchlist: View: Get Complete BV Trend Analysis ➞ | |
 | CDLX Cardlytics, Inc. |
| Sector: Technology | |
| SubSector: Internet Information Providers | |
| MarketCap: 855.48 Millions | |
| Recent Price: 13.47 Smart Investing & Trading Score: 70 | |
| Day Percent Change: 3.70% Day Change: 0.48 | |
| Week Change: 9.42% Year-to-date Change: 46.3% | |
| CDLX Links: Profile News Message Board | |
| Charts:- Daily , Weekly | |
| Add CDLX to Watchlist: View: Get Complete CDLX Trend Analysis ➞ | |
 | UPWK Upwork Inc. |
| Sector: Technology | |
| SubSector: Internet Information Providers | |
| MarketCap: 815.98 Millions | |
| Recent Price: 12.65 Smart Investing & Trading Score: 64 | |
| Day Percent Change: 5.73% Day Change: 0.68 | |
| Week Change: 9.39% Year-to-date Change: -15.0% | |
| UPWK Links: Profile News Message Board | |
| Charts:- Daily , Weekly | |
| Add UPWK to Watchlist: View: Get Complete UPWK Trend Analysis ➞ | |
 | FDMT 4D Molecular Therapeutics, Inc. |
| Sector: Health Care | |
| SubSector: Biotechnology | |
| MarketCap: 772 Millions | |
| Recent Price: 25.38 Smart Investing & Trading Score: 32 | |
| Day Percent Change: 0.08% Day Change: 0.02 | |
| Week Change: 9.28% Year-to-date Change: 22.6% | |
| FDMT Links: Profile News Message Board | |
| Charts:- Daily , Weekly | |
| Add FDMT to Watchlist: View: Get Complete FDMT Trend Analysis ➞ | |
 | NTLA Intellia Therapeutics, Inc. |
| Sector: Health Care | |
| SubSector: Biotechnology | |
| MarketCap: 707.185 Millions | |
| Recent Price: 22.68 Smart Investing & Trading Score: 59 | |
| Day Percent Change: 0.80% Day Change: 0.18 | |
| Week Change: 9.25% Year-to-date Change: -25.6% | |
| NTLA Links: Profile News Message Board | |
| Charts:- Daily , Weekly | |
| Add NTLA to Watchlist: View: Get Complete NTLA Trend Analysis ➞ | |
 | SILK Silk Road Medical, Inc |
| Sector: Health Care | |
| SubSector: Medical Appliances & Equipment | |
| MarketCap: 881.78 Millions | |
| Recent Price: 19.45 Smart Investing & Trading Score: 90 | |
| Day Percent Change: -3.55% Day Change: -0.71 | |
| Week Change: 9.24% Year-to-date Change: 58.5% | |
| SILK Links: Profile News Message Board | |
| Charts:- Daily , Weekly | |
| Add SILK to Watchlist: View: Get Complete SILK Trend Analysis ➞ | |
 | MLYS Mineralys Therapeutics, Inc. |
| Sector: Health Care | |
| SubSector: Biotechnology | |
| MarketCap: 719 Millions | |
| Recent Price: 12.93 Smart Investing & Trading Score: 67 | |
| Day Percent Change: 0.23% Day Change: 0.03 | |
| Week Change: 8.98% Year-to-date Change: 48.2% | |
| MLYS Links: Profile News Message Board | |
| Charts:- Daily , Weekly | |
| Add MLYS to Watchlist: View: Get Complete MLYS Trend Analysis ➞ | |
 | HLVX HilleVax, Inc. |
| Sector: Health Care | |
| SubSector: Biotechnology | |
| MarketCap: 680 Millions | |
| Recent Price: 13.94 Smart Investing & Trading Score: 49 | |
| Day Percent Change: 3.03% Day Change: 0.41 | |
| Week Change: 8.82% Year-to-date Change: -15.4% | |
| HLVX Links: Profile News Message Board | |
| Charts:- Daily , Weekly | |
| Add HLVX to Watchlist: View: Get Complete HLVX Trend Analysis ➞ | |
 | RWT Redwood Trust, Inc. |
| Sector: Financials | |
| SubSector: Mortgage Investment | |
| MarketCap: 674.739 Millions | |
| Recent Price: 6.22 Smart Investing & Trading Score: 100 | |
| Day Percent Change: 0.65% Day Change: 0.04 | |
| Week Change: 8.74% Year-to-date Change: -16.1% | |
| RWT Links: Profile News Message Board | |
| Charts:- Daily , Weekly | |
| Add RWT to Watchlist: View: Get Complete RWT Trend Analysis ➞ | |
 | RVNC Revance Therapeutics, Inc. |
| Sector: Health Care | |
| SubSector: Biotechnology | |
| MarketCap: 854.185 Millions | |
| Recent Price: 3.69 Smart Investing & Trading Score: 39 | |
| Day Percent Change: -2.77% Day Change: -0.10 | |
| Week Change: 8.53% Year-to-date Change: -58.0% | |
| RVNC Links: Profile News Message Board | |
| Charts:- Daily , Weekly | |
| Add RVNC to Watchlist: View: Get Complete RVNC Trend Analysis ➞ | |
 | CSTL Castle Biosciences, Inc. |
| Sector: Health Care | |
| SubSector: Medical Laboratories & Research | |
| MarketCap: 545 Millions | |
| Recent Price: 22.03 Smart Investing & Trading Score: 100 | |
| Day Percent Change: 0.05% Day Change: 0.01 | |
| Week Change: 8.31% Year-to-date Change: 2.1% | |
| CSTL Links: Profile News Message Board | |
| Charts:- Daily , Weekly | |
| Add CSTL to Watchlist: View: Get Complete CSTL Trend Analysis ➞ | |
 | RYTM Rhythm Pharmaceuticals, Inc. |
| Sector: Health Care | |
| SubSector: Biotechnology | |
| MarketCap: 643.685 Millions | |
| Recent Price: 41.38 Smart Investing & Trading Score: 64 | |
| Day Percent Change: -0.11% Day Change: -0.05 | |
| Week Change: 8.11% Year-to-date Change: -10.0% | |
| RYTM Links: Profile News Message Board | |
| Charts:- Daily , Weekly | |
| Add RYTM to Watchlist: View: Get Complete RYTM Trend Analysis ➞ | |
 | BMEA Biomea Fusion, Inc. |
| Sector: Health Care | |
| SubSector: Biotechnology | |
| MarketCap: 818 Millions | |
| Recent Price: 11.64 Smart Investing & Trading Score: 49 | |
| Day Percent Change: 0.65% Day Change: 0.07 | |
| Week Change: 8.03% Year-to-date Change: -20.5% | |
| BMEA Links: Profile News Message Board | |
| Charts:- Daily , Weekly | |
| Add BMEA to Watchlist: View: Get Complete BMEA Trend Analysis ➞ | |
 | SSP The E.W. Scripps Company |
| Sector: Services & Goods | |
| SubSector: Broadcasting - TV | |
| MarketCap: 766.163 Millions | |
| Recent Price: 4.00 Smart Investing & Trading Score: 69 | |
| Day Percent Change: 2.44% Day Change: 0.10 | |
| Week Change: 7.97% Year-to-date Change: -50.0% | |
| SSP Links: Profile News Message Board | |
| Charts:- Daily , Weekly | |
| Add SSP to Watchlist: View: Get Complete SSP Trend Analysis ➞ | |
 | TROX Tronox Holdings plc |
| Sector: Materials | |
| SubSector: Chemicals - Major Diversified | |
| MarketCap: 807 Millions | |
| Recent Price: 18.79 Smart Investing & Trading Score: 100 | |
| Day Percent Change: 9.95% Day Change: 1.70 | |
| Week Change: 7.49% Year-to-date Change: 32.7% | |
| TROX Links: Profile News Message Board | |
| Charts:- Daily , Weekly | |
| Add TROX to Watchlist: View: Get Complete TROX Trend Analysis ➞ | |
 | LYEL Lyell Immunopharma, Inc. |
| Sector: Health Care | |
| SubSector: Biotechnology | |
| MarketCap: 809 Millions | |
| Recent Price: 2.33 Smart Investing & Trading Score: 30 | |
| Day Percent Change: -0.21% Day Change: 0.00 | |
| Week Change: 7.39% Year-to-date Change: 18.3% | |
| LYEL Links: Profile News Message Board | |
| Charts:- Daily , Weekly | |
| Add LYEL to Watchlist: View: Get Complete LYEL Trend Analysis ➞ | |
 | MLAB Mesa Laboratories, Inc. |
| Sector: Technology | |
| SubSector: Scientific & Technical Instruments | |
| MarketCap: 935.453 Millions | |
| Recent Price: 110.68 Smart Investing & Trading Score: 100 | |
| Day Percent Change: 0.45% Day Change: 0.49 | |
| Week Change: 7.25% Year-to-date Change: 5.6% | |
| MLAB Links: Profile News Message Board | |
| Charts:- Daily , Weekly | |
| Add MLAB to Watchlist: View: Get Complete MLAB Trend Analysis ➞ | |
 | TCBK TriCo Bancshares |
| Sector: Financials | |
| SubSector: Regional - Pacific Banks | |
| MarketCap: 875.129 Millions | |
| Recent Price: 36.29 Smart Investing & Trading Score: 100 | |
| Day Percent Change: 1.68% Day Change: 0.60 | |
| Week Change: 7.21% Year-to-date Change: -15.6% | |
| TCBK Links: Profile News Message Board | |
| Charts:- Daily , Weekly | |
| Add TCBK to Watchlist: View: Get Complete TCBK Trend Analysis ➞ | |
 | ME 23andMe Holding Co. |
| Sector: Health Care | |
| SubSector: Diagnostics & Research | |
| MarketCap: 802 Millions | |
| Recent Price: 0.50 Smart Investing & Trading Score: 37 | |
| Day Percent Change: -0.76% Day Change: 0.00 | |
| Week Change: 7.17% Year-to-date Change: -44.2% | |
| ME Links: Profile News Message Board | |
| Charts:- Daily , Weekly | |
| Add ME to Watchlist: View: Get Complete ME Trend Analysis ➞ | |
 | MOND Mondee Holdings, Inc. |
| Sector: Services & Goods | |
| SubSector: Travel Services | |
| MarketCap: 744 Millions | |
| Recent Price: 2.32 Smart Investing & Trading Score: 88 | |
| Day Percent Change: 0.87% Day Change: 0.02 | |
| Week Change: 6.42% Year-to-date Change: -16.6% | |
| MOND Links: Profile News Message Board | |
| Charts:- Daily , Weekly | |
| Add MOND to Watchlist: View: Get Complete MOND Trend Analysis ➞ | |
 | BE Bloom Energy Corporation |
| Sector: Utilities | |
| SubSector: Electric Utilities | |
| MarketCap: 567.514 Millions | |
| Recent Price: 11.24 Smart Investing & Trading Score: 100 | |
| Day Percent Change: -0.57% Day Change: -0.07 | |
| Week Change: 6.08% Year-to-date Change: -24.0% | |
| BE Links: Profile News Message Board | |
| Charts:- Daily , Weekly | |
| Add BE to Watchlist: View: Get Complete BE Trend Analysis ➞ | |
 | GLT P. H. Glatfelter Company |
| Sector: Consumer Staples | |
| SubSector: Paper & Paper Products | |
| MarketCap: 525.003 Millions | |
| Recent Price: 1.58 Smart Investing & Trading Score: 37 | |
| Day Percent Change: 6.04% Day Change: 0.09 | |
| Week Change: 6.04% Year-to-date Change: -18.6% | |
| GLT Links: Profile News Message Board | |
| Charts:- Daily , Weekly | |
| Add GLT to Watchlist: View: Get Complete GLT Trend Analysis ➞ | |
 | XPER Xperi Corporation |
| Sector: Technology | |
| SubSector: Semiconductor Equipment & Materials | |
| MarketCap: 631.618 Millions | |
| Recent Price: 10.54 Smart Investing & Trading Score: 54 | |
| Day Percent Change: 0.57% Day Change: 0.06 | |
| Week Change: 5.93% Year-to-date Change: -4.4% | |
| XPER Links: Profile News Message Board | |
| Charts:- Daily , Weekly | |
| Add XPER to Watchlist: View: Get Complete XPER Trend Analysis ➞ | |
| For tabular summary view of above stock list: Summary View ➞ 0 - 25 , 25 - 50 , 50 - 75 , 75 - 100 , 100 - 125 , 125 - 150 , 150 - 175 , 175 - 200 , 200 - 225 , 225 - 250 , 250 - 275 , 275 - 300 , 300 - 325 , 325 - 350 | ||
| Click To Change The Sort Order: By Market Cap or Company Size Performance: Year-to-date, Week and Day | |
| Select Chart Type: | ||
| Too many stocks? View smallcap stocks filtered by marketcap & sector |
| Marketcap: All SmallCap Stocks (default-no microcap), Large, Mid-Range, Small & MicroCap |
| Sector: Tech, Finance, Energy, Staples, Retail, Industrial, Materials, Utilities & Medical |
|
Best Stocks Today 12Stocks.com |
© 2024 12Stocks.com Terms & Conditions Privacy Contact Us
All Information Provided Only For Education And Not To Be Used For Investing or Trading. See Terms & Conditions


One More Thing ... Get Best Stocks Delivered Daily!
Never Ever Miss A Move With Our Top Ten Stocks Lists
Find Best Stocks In Any Market - Bull or Bear Market
Take A Peek At Our Top Ten Stocks Lists: Daily, Weekly, Year-to-Date & Top Trends
Find Best Stocks In Any Market - Bull or Bear Market
Take A Peek At Our Top Ten Stocks Lists: Daily, Weekly, Year-to-Date & Top Trends
Smallcap Stocks With Best Up Trends [0-bearish to 100-bullish]: Emergent BioSolutions[100], Aspen Aerogels[100], Gannett Co[100], Pitney Bowes[100], Perdoceo Education[100], Origin Materials[100], Benchmark Electronics[100], Sprouts Farmers[100], FormFactor [100], Lantheus [100], TTM [100]
Best Smallcap Stocks Year-to-Date:
Janux [440.16%], Viking [306.02%], Longboard [258.92%], Alpine Immune[239.44%], Bakkt [187.89%], Avidity Biosciences[184.07%], Vera [170.74%], Cullinan Oncology[169.74%], Arcutis Bio[163.93%], Super Micro[161.15%], Y-mAbs [145.23%] Best Smallcap Stocks This Week:
Emergent BioSolutions[110.94%], Eyenovia [45.27%], P3 Health[38.51%], Aspen Aerogels[37.17%], Origin Materials[36.24%], Cue Biopharma[35.9%], Poseida [34.98%], Enovix [32.07%], Surmodics [31.94%], Phibro Animal[28.44%], TransMedics Group[28.2%] Best Smallcap Stocks Daily:
Emergent BioSolutions[109.84%], Aspen Aerogels[45.11%], Gannett Co[31.12%], Enovix [31.06%], Pitney Bowes[23.87%], Office Properties[22.00%], Pulmonx [20.21%], Perdoceo Education[19.25%], Origin Materials[17.75%], Benchmark Electronics[17.40%], Children s[14.21%]