
 Login Sign Up


| |||||
 |  | ||||

| 12Stocks.com Market Intelligence |
Best SmallCap Stocks
|
| In a hurry? Small Cap Stock Lists: Performance Trends Table, Stock Charts
Sort Small Cap stocks: Daily, Weekly, Year-to-Date, Market Cap & Trends. Filter Small Cap stocks list by sector: Show all, Tech, Finance, Energy, Staples, Retail, Industrial, Materials, Utilities and HealthCare Filter Small Cap stocks list by size: All Large Medium Small and MicroCap |
| 12Stocks.com Small Cap Stocks Performances & Trends Daily | |||||||||
|
|  The overall Smart Investing & Trading Score is 23 (0-bearish to 100-bullish) which puts Small Cap index in short term bearish to neutral trend. The Smart Investing & Trading Score from previous trading session is 13 and an improvement of trend continues.
| ||||||||
Here are the Smart Investing & Trading Scores of the most requested small cap stocks at 12Stocks.com (click stock name for detailed review):
|


| 12Stocks.com: Investing in Smallcap Index with Stocks | |
|
The following table helps investors and traders sort through current performance and trends (as measured by Smart Investing & Trading Score) of various
stocks in the Smallcap Index. Quick View: Move mouse or cursor over stock symbol (ticker) to view short-term technical chart and over stock name to view long term chart. Click on  to add stock symbol to your watchlist and to add stock symbol to your watchlist and  to view watchlist. Click on any ticker or stock name for detailed market intelligence report for that stock. to view watchlist. Click on any ticker or stock name for detailed market intelligence report for that stock. |
12Stocks.com Performance of Stocks in Smallcap Index
| Ticker | Stock Name | Watchlist | Category | Recent Price | Smart Investing & Trading Score | Change % | Weekly Change% |
| SNPO | Snap One |   | Technology | 10.55 | 81 | -0.09% | 29.61% |
| CVGW | Calavo Growers | | Consumer Staples | 28.43 | 85 | 6.16% | 16.33% |
| ORGN | Origin Materials | | Materials | 0.70 | 88 | 20.44% | 12.60% |
| SSP | E.W. Scripps | | Services & Goods | 3.59 | 52 | 4.06% | 12.19% |
| WINA | Winmark | | Services & Goods | 382.30 | 90 | 4.45% | 11.26% |
| JRVR | James River | | Financials | 9.33 | 74 | 1.30% | 10.28% |
| EXFY | Expensify | | Technology | 1.62 | 47 | -6.90% | 10.20% |
| ITCI | Intra-Cellular Therapies | | Health Care | 72.29 | 68 | 0.40% | 9.73% |
| WIRE | Encore Wire | | Technology | 284.41 | 68 | -0.90% | 8.98% |
| ME | 23andMe Holding | | Health Care | 0.48 | 62 | -18.55% | 8.57% |
| DCGO | DocGo | | Health Care | 3.50 | 47 | 0.29% | 7.52% |
| HCC | Warrior Met | | Materials | 67.04 | 80 | 1.35% | 7.25% |
| BIG | Big Lots | | Services & Goods | 3.70 | 52 | 1.09% | 7.25% |
| LKFN | Lakeland Financial | | Financials | 61.73 | 42 | 4.41% | 5.56% |
| AIR | AAR | | Industrials | 64.12 | 90 | 1.73% | 5.48% |
| YMAB | Y-mAbs | | Health Care | 15.15 | 48 | 1.00% | 5.43% |
| UHG | United Homes | | Services & Goods | 6.33 | 35 | -0.55% | 5.24% |
| HFWA | Heritage Financial | | Financials | 18.18 | 52 | 3.59% | 5.03% |
| SNBR | Sleep Number | | Consumer Staples | 13.61 | 68 | 2.48% | 5.02% |
| SPTN | SpartanNash | | Consumer Staples | 19.65 | 59 | 2.24% | 4.91% |
| AMTB | Amerant Bancorp | | Financials | 22.18 | 52 | 4.18% | 4.87% |
| IAUX | i-80 Gold | | Materials | 1.25 | 35 | 2.22% | 4.62% |
| UFCS | United Fire | | Financials | 22.76 | 100 | 3.31% | 4.55% |
| SBSI | Southside Bancshares | | Financials | 28.18 | 52 | 3.53% | 4.33% |
| IMAX | IMAX | | Services & Goods | 17.13 | 76 | 0.12% | 4.26% |
| For chart view version of above stock list: Chart View ➞ 0 - 25 , 25 - 50 , 50 - 75 , 75 - 100 , 100 - 125 , 125 - 150 , 150 - 175 , 175 - 200 , 200 - 225 , 225 - 250 , 250 - 275 , 275 - 300 , 300 - 325 , 325 - 350 | ||
 | Click To Change The Sort Order: By Market Cap or Company Size Performance: Year-to-date, Week and Day |  |
| Too many stocks? View smallcap stocks filtered by marketcap & sector |
| Marketcap: All SmallCap Stocks (default-no microcap), Large, Mid-Range, Small |
| Smallcap Sector: Tech, Finance, Energy, Staples, Retail, Industrial, Materials, & Medical |
|
Get the most comprehensive stock market coverage daily at 12Stocks.com ➞ Best Stocks Today ➞ Best Stocks Weekly ➞ Best Stocks Year-to-Date ➞ Best Stocks Trends ➞  Best Stocks Today 12Stocks.com Best Nasdaq Stocks ➞ Best S&P 500 Stocks ➞ Best Tech Stocks ➞ Best Biotech Stocks ➞ |
| Detailed Overview of SmallCap Stocks |
| SmallCap Technical Overview, Leaders & Laggards, Top SmallCap ETF Funds & Detailed SmallCap Stocks List, Charts, Trends & More |
| Smallcap: Technical Analysis, Trends & YTD Performance | |
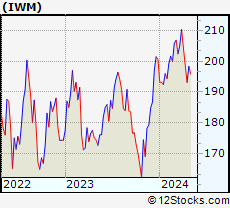
| SmallCap segment as represented by
IWM, an exchange-traded fund [ETF], holds basket of thousands of smallcap stocks from across all major sectors of the US stock market. The smallcap index (contains stocks like Riverbed & Sotheby's) is down by -3.77% and is currently underperforming the overall market by -7.15% year-to-date. Below is a quick view of technical charts and trends: | |
 IWM Weekly Chart |
|
| Long Term Trend: Not Good | |
| Medium Term Trend: Not Good | |
 IWM Daily Chart |
|
| Short Term Trend: Not Good | |
| Overall Trend Score: 23 | |
| YTD Performance: -3.77% | |
| **Trend Scores & Views Are Only For Educational Purposes And Not For Investing | |
| 12Stocks.com: Top Performing Small Cap Index Stocks | ||||||||||||||||||||||||||||||||||||||||||||||||
 The top performing Small Cap Index stocks year to date are
Now, more recently, over last week, the top performing Small Cap Index stocks on the move are


|
||||||||||||||||||||||||||||||||||||||||||||||||
| 12Stocks.com: Investing in Smallcap Index using Exchange Traded Funds | |
|
The following table shows list of key exchange traded funds (ETF) that
help investors track Smallcap index. The following list also includes leveraged ETF funds that track twice or thrice the daily returns of Smallcap indices. Short or inverse ETF funds move in the opposite direction to the index they track and are useful during market pullbacks or during bear markets. Quick View: Move mouse or cursor over ETF symbol (ticker) to view short-term technical chart and over ETF name to view long term chart. Click on ticker or stock name for detailed view. Click on to add stock symbol to your watchlist and to view watchlist. |
12Stocks.com List of ETFs that track Smallcap Index
| Ticker | ETF Name | Watchlist | Recent Price | Smart Investing & Trading Score | Change % | Week % | Year-to-date % |
| IWM | iShares Russell 2000 | | 193.14 | 23 | 0.16 | -2.79 | -3.77% |
| IJR | iShares Core S&P Small-Cap | | 103.22 | 10 | 0.86 | -1.23 | -4.65% |
| IWN | iShares Russell 2000 Value | | 147.78 | 10 | 0.99 | -1.73 | -4.86% |
| VTWO | Vanguard Russell 2000 ETF | | 78.06 | 23 | 0.14 | -2.81 | -3.75% |
| IWO | iShares Russell 2000 Growth | | 245.29 | 36 | -0.67 | -3.94 | -2.75% |
| IJS | iShares S&P Small-Cap 600 Value | | 95.61 | 17 | 1.16 | -0.58 | -7.24% |
| IJT | iShares S&P Small-Cap 600 Growth | | 121.96 | 23 | 0.32 | -2.26 | -2.54% |
| XSLV | PowerShares S&P SmallCap Low Volatil ETF | | 42.30 | 17 | 1.56 | 0.5 | -4.19% |
| SAA | ProShares Ultra SmallCap600 | | 21.80 | 18 | 0.83 | -3.37 | -12.63% |
| SMLV | SPDR SSGA US Small Cap Low Volatil ETF | | 106.09 | 32 | 2.18 | 1.03 | -5.71% |
| SDD | ProShares UltraShort SmallCap600 | | 20.34 | 76 | -1.69 | 2.57 | 10.38% |
| SBB | ProShares Short SmallCap600 | | 16.84 | 76 | -0.82 | 1.77 | 5.71% |
| 12Stocks.com: Charts, Trends, Fundamental Data and Performances of SmallCap Stocks | |
|
We now take in-depth look at all SmallCap stocks including charts, multi-period performances and overall trends (as measured by Smart Investing & Trading Score). One can sort SmallCap stocks (click link to choose) by Daily, Weekly and by Year-to-Date performances. Also, one can sort by size of the company or by market capitalization. |
| Select Your Default Chart Type: | |||||
| |||||
| Click on stock symbol or name for detailed view. Click on to add stock symbol to your watchlist and to view watchlist. Quick View: Move mouse or cursor over "Daily" to quickly view daily technical stock chart and over "Weekly" to view weekly technical stock chart. | |||||

 | SNPO Snap One Holdings Corp. |
| Sector: Technology | |
| SubSector: Electronics & Computer Distribution | |
| MarketCap: 807 Millions | |
| Recent Price: 10.55 Smart Investing & Trading Score: 81 | |
| Day Percent Change: -0.09% Day Change: -0.01 | |
| Week Change: 29.61% Year-to-date Change: 13.6% | |
| SNPO Links: Profile News Message Board | |
| Charts:- Daily , Weekly | |
| Add SNPO to Watchlist: View: Get Complete SNPO Trend Analysis ➞ | |
 | CVGW Calavo Growers, Inc. |
| Sector: Consumer Staples | |
| SubSector: Farm Products | |
| MarketCap: 935.287 Millions | |
| Recent Price: 28.43 Smart Investing & Trading Score: 85 | |
| Day Percent Change: 6.16% Day Change: 1.65 | |
| Week Change: 16.33% Year-to-date Change: -3.3% | |
| CVGW Links: Profile News Message Board | |
| Charts:- Daily , Weekly | |
| Add CVGW to Watchlist: View: Get Complete CVGW Trend Analysis ➞ | |
 | ORGN Origin Materials, Inc. |
| Sector: Materials | |
| SubSector: Chemicals | |
| MarketCap: 586 Millions | |
| Recent Price: 0.70 Smart Investing & Trading Score: 88 | |
| Day Percent Change: 20.44% Day Change: 0.12 | |
| Week Change: 12.6% Year-to-date Change: -17.5% | |
| ORGN Links: Profile News Message Board | |
| Charts:- Daily , Weekly | |
| Add ORGN to Watchlist: View: Get Complete ORGN Trend Analysis ➞ | |
 | SSP The E.W. Scripps Company |
| Sector: Services & Goods | |
| SubSector: Broadcasting - TV | |
| MarketCap: 766.163 Millions | |
| Recent Price: 3.59 Smart Investing & Trading Score: 52 | |
| Day Percent Change: 4.06% Day Change: 0.14 | |
| Week Change: 12.19% Year-to-date Change: -55.1% | |
| SSP Links: Profile News Message Board | |
| Charts:- Daily , Weekly | |
| Add SSP to Watchlist: View: Get Complete SSP Trend Analysis ➞ | |
 | WINA Winmark Corporation |
| Sector: Services & Goods | |
| SubSector: Specialty Retail, Other | |
| MarketCap: 520.444 Millions | |
| Recent Price: 382.30 Smart Investing & Trading Score: 90 | |
| Day Percent Change: 4.45% Day Change: 16.30 | |
| Week Change: 11.26% Year-to-date Change: -8.4% | |
| WINA Links: Profile News Message Board | |
| Charts:- Daily , Weekly | |
| Add WINA to Watchlist: View: Get Complete WINA Trend Analysis ➞ | |
 | JRVR James River Group Holdings, Ltd. |
| Sector: Financials | |
| SubSector: Property & Casualty Insurance | |
| MarketCap: 978.312 Millions | |
| Recent Price: 9.33 Smart Investing & Trading Score: 74 | |
| Day Percent Change: 1.30% Day Change: 0.12 | |
| Week Change: 10.28% Year-to-date Change: 1.0% | |
| JRVR Links: Profile News Message Board | |
| Charts:- Daily , Weekly | |
| Add JRVR to Watchlist: View: Get Complete JRVR Trend Analysis ➞ | |
 | EXFY Expensify, Inc. |
| Sector: Technology | |
| SubSector: Software - Application | |
| MarketCap: 678 Millions | |
| Recent Price: 1.62 Smart Investing & Trading Score: 47 | |
| Day Percent Change: -6.90% Day Change: -0.12 | |
| Week Change: 10.2% Year-to-date Change: -35.7% | |
| EXFY Links: Profile News Message Board | |
| Charts:- Daily , Weekly | |
| Add EXFY to Watchlist: View: Get Complete EXFY Trend Analysis ➞ | |
 | ITCI Intra-Cellular Therapies, Inc. |
| Sector: Health Care | |
| SubSector: Biotechnology | |
| MarketCap: 991.885 Millions | |
| Recent Price: 72.29 Smart Investing & Trading Score: 68 | |
| Day Percent Change: 0.40% Day Change: 0.29 | |
| Week Change: 9.73% Year-to-date Change: 0.9% | |
| ITCI Links: Profile News Message Board | |
| Charts:- Daily , Weekly | |
| Add ITCI to Watchlist: View: Get Complete ITCI Trend Analysis ➞ | |
 | WIRE Encore Wire Corporation |
| Sector: Technology | |
| SubSector: Diversified Electronics | |
| MarketCap: 898.896 Millions | |
| Recent Price: 284.41 Smart Investing & Trading Score: 68 | |
| Day Percent Change: -0.90% Day Change: -2.59 | |
| Week Change: 8.98% Year-to-date Change: 33.2% | |
| WIRE Links: Profile News Message Board | |
| Charts:- Daily , Weekly | |
| Add WIRE to Watchlist: View: Get Complete WIRE Trend Analysis ➞ | |
 | ME 23andMe Holding Co. |
| Sector: Health Care | |
| SubSector: Diagnostics & Research | |
| MarketCap: 802 Millions | |
| Recent Price: 0.48 Smart Investing & Trading Score: 62 | |
| Day Percent Change: -18.55% Day Change: -0.11 | |
| Week Change: 8.57% Year-to-date Change: -46.0% | |
| ME Links: Profile News Message Board | |
| Charts:- Daily , Weekly | |
| Add ME to Watchlist: View: Get Complete ME Trend Analysis ➞ | |
 | DCGO DocGo Inc. |
| Sector: Health Care | |
| SubSector: Medical Care Facilities | |
| MarketCap: 972 Millions | |
| Recent Price: 3.50 Smart Investing & Trading Score: 47 | |
| Day Percent Change: 0.29% Day Change: 0.01 | |
| Week Change: 7.52% Year-to-date Change: -37.3% | |
| DCGO Links: Profile News Message Board | |
| Charts:- Daily , Weekly | |
| Add DCGO to Watchlist: View: Get Complete DCGO Trend Analysis ➞ | |
 | HCC Warrior Met Coal, Inc. |
| Sector: Materials | |
| SubSector: Industrial Metals & Minerals | |
| MarketCap: 748.81 Millions | |
| Recent Price: 67.04 Smart Investing & Trading Score: 80 | |
| Day Percent Change: 1.35% Day Change: 0.89 | |
| Week Change: 7.25% Year-to-date Change: 10.0% | |
| HCC Links: Profile News Message Board | |
| Charts:- Daily , Weekly | |
| Add HCC to Watchlist: View: Get Complete HCC Trend Analysis ➞ | |
 | BIG Big Lots, Inc. |
| Sector: Services & Goods | |
| SubSector: Discount, Variety Stores | |
| MarketCap: 603.572 Millions | |
| Recent Price: 3.70 Smart Investing & Trading Score: 52 | |
| Day Percent Change: 1.09% Day Change: 0.04 | |
| Week Change: 7.25% Year-to-date Change: -52.5% | |
| BIG Links: Profile News Message Board | |
| Charts:- Daily , Weekly | |
| Add BIG to Watchlist: View: Get Complete BIG Trend Analysis ➞ | |
 | LKFN Lakeland Financial Corporation |
| Sector: Financials | |
| SubSector: Regional - Midwest Banks | |
| MarketCap: 903.27 Millions | |
| Recent Price: 61.73 Smart Investing & Trading Score: 42 | |
| Day Percent Change: 4.41% Day Change: 2.61 | |
| Week Change: 5.56% Year-to-date Change: -5.3% | |
| LKFN Links: Profile News Message Board | |
| Charts:- Daily , Weekly | |
| Add LKFN to Watchlist: View: Get Complete LKFN Trend Analysis ➞ | |
 | AIR AAR Corp. |
| Sector: Industrials | |
| SubSector: Aerospace/Defense Products & Services | |
| MarketCap: 591.701 Millions | |
| Recent Price: 64.12 Smart Investing & Trading Score: 90 | |
| Day Percent Change: 1.73% Day Change: 1.09 | |
| Week Change: 5.48% Year-to-date Change: 2.8% | |
| AIR Links: Profile News Message Board | |
| Charts:- Daily , Weekly | |
| Add AIR to Watchlist: View: Get Complete AIR Trend Analysis ➞ | |
 | YMAB Y-mAbs Therapeutics, Inc. |
| Sector: Health Care | |
| SubSector: Biotechnology | |
| MarketCap: 899.585 Millions | |
| Recent Price: 15.15 Smart Investing & Trading Score: 48 | |
| Day Percent Change: 1.00% Day Change: 0.15 | |
| Week Change: 5.43% Year-to-date Change: 122.1% | |
| YMAB Links: Profile News Message Board | |
| Charts:- Daily , Weekly | |
| Add YMAB to Watchlist: View: Get Complete YMAB Trend Analysis ➞ | |
 | UHG United Homes Group, Inc. |
| Sector: Services & Goods | |
| SubSector: Residential Construction | |
| MarketCap: 566 Millions | |
| Recent Price: 6.33 Smart Investing & Trading Score: 35 | |
| Day Percent Change: -0.55% Day Change: -0.04 | |
| Week Change: 5.24% Year-to-date Change: -24.6% | |
| UHG Links: Profile News Message Board | |
| Charts:- Daily , Weekly | |
| Add UHG to Watchlist: View: Get Complete UHG Trend Analysis ➞ | |
 | HFWA Heritage Financial Corporation |
| Sector: Financials | |
| SubSector: Regional - Pacific Banks | |
| MarketCap: 752.829 Millions | |
| Recent Price: 18.18 Smart Investing & Trading Score: 52 | |
| Day Percent Change: 3.59% Day Change: 0.63 | |
| Week Change: 5.03% Year-to-date Change: -15.0% | |
| HFWA Links: Profile News Message Board | |
| Charts:- Daily , Weekly | |
| Add HFWA to Watchlist: View: Get Complete HFWA Trend Analysis ➞ | |
 | SNBR Sleep Number Corporation |
| Sector: Consumer Staples | |
| SubSector: Home Furnishings & Fixtures | |
| MarketCap: 692.735 Millions | |
| Recent Price: 13.61 Smart Investing & Trading Score: 68 | |
| Day Percent Change: 2.48% Day Change: 0.33 | |
| Week Change: 5.02% Year-to-date Change: -8.2% | |
| SNBR Links: Profile News Message Board | |
| Charts:- Daily , Weekly | |
| Add SNBR to Watchlist: View: Get Complete SNBR Trend Analysis ➞ | |
 | SPTN SpartanNash Company |
| Sector: Consumer Staples | |
| SubSector: Food Wholesale | |
| MarketCap: 671.229 Millions | |
| Recent Price: 19.65 Smart Investing & Trading Score: 59 | |
| Day Percent Change: 2.24% Day Change: 0.43 | |
| Week Change: 4.91% Year-to-date Change: -14.4% | |
| SPTN Links: Profile News Message Board | |
| Charts:- Daily , Weekly | |
| Add SPTN to Watchlist: View: Get Complete SPTN Trend Analysis ➞ | |
 | AMTB Amerant Bancorp Inc. |
| Sector: Financials | |
| SubSector: Regional - Midwest Banks | |
| MarketCap: 653.87 Millions | |
| Recent Price: 22.18 Smart Investing & Trading Score: 52 | |
| Day Percent Change: 4.18% Day Change: 0.89 | |
| Week Change: 4.87% Year-to-date Change: -9.7% | |
| AMTB Links: Profile News Message Board | |
| Charts:- Daily , Weekly | |
| Add AMTB to Watchlist: View: Get Complete AMTB Trend Analysis ➞ | |
 | IAUX i-80 Gold Corp. |
| Sector: Materials | |
| SubSector: Gold | |
| MarketCap: 616 Millions | |
| Recent Price: 1.25 Smart Investing & Trading Score: 35 | |
| Day Percent Change: 2.22% Day Change: 0.03 | |
| Week Change: 4.62% Year-to-date Change: -28.9% | |
| IAUX Links: Profile News Message Board | |
| Charts:- Daily , Weekly | |
| Add IAUX to Watchlist: View: Get Complete IAUX Trend Analysis ➞ | |
 | UFCS United Fire Group, Inc. |
| Sector: Financials | |
| SubSector: Property & Casualty Insurance | |
| MarketCap: 862.812 Millions | |
| Recent Price: 22.76 Smart Investing & Trading Score: 100 | |
| Day Percent Change: 3.31% Day Change: 0.73 | |
| Week Change: 4.55% Year-to-date Change: 13.1% | |
| UFCS Links: Profile News Message Board | |
| Charts:- Daily , Weekly | |
| Add UFCS to Watchlist: View: Get Complete UFCS Trend Analysis ➞ | |
 | SBSI Southside Bancshares, Inc. |
| Sector: Financials | |
| SubSector: Regional - Mid-Atlantic Banks | |
| MarketCap: 971.259 Millions | |
| Recent Price: 28.18 Smart Investing & Trading Score: 52 | |
| Day Percent Change: 3.53% Day Change: 0.96 | |
| Week Change: 4.33% Year-to-date Change: -10.0% | |
| SBSI Links: Profile News Message Board | |
| Charts:- Daily , Weekly | |
| Add SBSI to Watchlist: View: Get Complete SBSI Trend Analysis ➞ | |
 | IMAX IMAX Corporation |
| Sector: Services & Goods | |
| SubSector: Entertainment - Diversified | |
| MarketCap: 874.237 Millions | |
| Recent Price: 17.13 Smart Investing & Trading Score: 76 | |
| Day Percent Change: 0.12% Day Change: 0.02 | |
| Week Change: 4.26% Year-to-date Change: 14.1% | |
| IMAX Links: Profile News Message Board | |
| Charts:- Daily , Weekly | |
| Add IMAX to Watchlist: View: Get Complete IMAX Trend Analysis ➞ | |
| For tabular summary view of above stock list: Summary View ➞ 0 - 25 , 25 - 50 , 50 - 75 , 75 - 100 , 100 - 125 , 125 - 150 , 150 - 175 , 175 - 200 , 200 - 225 , 225 - 250 , 250 - 275 , 275 - 300 , 300 - 325 , 325 - 350 | ||
| Click To Change The Sort Order: By Market Cap or Company Size Performance: Year-to-date, Week and Day | |
| Select Chart Type: | ||
| Too many stocks? View smallcap stocks filtered by marketcap & sector |
| Marketcap: All SmallCap Stocks (default-no microcap), Large, Mid-Range, Small & MicroCap |
| Sector: Tech, Finance, Energy, Staples, Retail, Industrial, Materials, Utilities & Medical |
|
Best Stocks Today 12Stocks.com |
© 2024 12Stocks.com Terms & Conditions Privacy Contact Us
All Information Provided Only For Education And Not To Be Used For Investing or Trading. See Terms & Conditions


One More Thing ... Get Best Stocks Delivered Daily!
Never Ever Miss A Move With Our Top Ten Stocks Lists
Find Best Stocks In Any Market - Bull or Bear Market
Take A Peek At Our Top Ten Stocks Lists: Daily, Weekly, Year-to-Date & Top Trends
Find Best Stocks In Any Market - Bull or Bear Market
Take A Peek At Our Top Ten Stocks Lists: Daily, Weekly, Year-to-Date & Top Trends
Smallcap Stocks With Best Up Trends [0-bearish to 100-bullish]: Humacyte [100], Old Second[100], Gannett Co[100], Tejon Ranch[100], Cricut [100], Victory Capital[100], United Fire[100], Century Aluminum[100], Portland General[100], Lantheus [100], Oscar Health[100]
Best Smallcap Stocks Year-to-Date:
Agenus [540.17%], CareMax [423.71%], Janux [336.95%], Viking [240.57%], Alpine Immune[238.94%], Longboard [194.11%], Arcutis Bio[181.42%], Avidity Biosciences[153.65%], Super Micro[151.19%], Vera [138.18%], Stoke [129.66%] Best Smallcap Stocks This Week:
Macatawa Bank[46.82%], Vertex Energy[43.27%], Snap One[29.61%], Vanda [24.03%], Humacyte [23.78%], ALX Oncology[22.49%], ContextLogic [20%], ProKidney [16.57%], Calavo Growers[16.33%], Badger Meter[15.61%], Accolade [13.45%] Best Smallcap Stocks Daily:
Tellurian [28.11%], Origin Materials[20.44%], Metropolitan Bank[18.01%], Vertex Energy[13.74%], Genelux [10.37%], Gevo [10.14%], Riot Blockchain[10.07%], Humacyte [9.86%], Marathon Patent[9.78%], Emergent BioSolutions[9.68%], Fossil Group[9.64%]