
 Login Sign Up


| |||||
 |  | ||||

| 12Stocks.com Market Intelligence |
Best SmallCap Stocks
|
| In a hurry? Small Cap Stock Lists: Performance Trends Table, Stock Charts
Sort Small Cap stocks: Daily, Weekly, Year-to-Date, Market Cap & Trends. Filter Small Cap stocks list by sector: Show all, Tech, Finance, Energy, Staples, Retail, Industrial, Materials, Utilities and HealthCare Filter Small Cap stocks list by size: All Large Medium Small and MicroCap |
| 12Stocks.com Small Cap Stocks Performances & Trends Daily | |||||||||
|
|  The overall Smart Investing & Trading Score is 90 (0-bearish to 100-bullish) which puts Small Cap index in short term bullish trend. The Smart Investing & Trading Score from previous trading session is 100 and hence a deterioration of trend.
| ||||||||
Here are the Smart Investing & Trading Scores of the most requested small cap stocks at 12Stocks.com (click stock name for detailed review):
|


| 12Stocks.com: Investing in Smallcap Index with Stocks | |
|
The following table helps investors and traders sort through current performance and trends (as measured by Smart Investing & Trading Score) of various
stocks in the Smallcap Index. Quick View: Move mouse or cursor over stock symbol (ticker) to view short-term technical chart and over stock name to view long term chart. Click on  to add stock symbol to your watchlist and to add stock symbol to your watchlist and  to view watchlist. Click on any ticker or stock name for detailed market intelligence report for that stock. to view watchlist. Click on any ticker or stock name for detailed market intelligence report for that stock. |
12Stocks.com Performance of Stocks in Smallcap Index
| Ticker | Stock Name | Watchlist | Category | Recent Price | Smart Investing & Trading Score | Change % | Weekly Change% |
| OFIX | Orthofix Medical |   | Health Care | 15.11 | 76 | -1.69% | 3.21% |
| ETNB | 89bio | | Health Care | 8.97 | 40 | -2.50% | 3.10% |
| TRTX | TPG RE | | Financials | 8.85 | 83 | 0.91% | 3.09% |
| GLT | P. H. | | Consumer Staples | 1.68 | 57 | -1.18% | 3.07% |
| KREF | KKR Real | | Financials | 9.84 | 93 | 0.51% | 3.04% |
| SNBR | Sleep Number | | Consumer Staples | 16.00 | 62 | -2.20% | 3.03% |
| MATW | Matthews | | Services & Goods | 29.70 | 88 | 2.03% | 3.02% |
| CSTM | Constellium SE | | Materials | 20.84 | 88 | 3.22% | 2.96% |
| KIDS | OrthoPediatrics | | Health Care | 31.79 | 88 | 1.34% | 2.91% |
| BRKL | Brookline Bancorp | | Financials | 9.06 | 74 | 0.78% | 2.84% |
| WEAV | Weave | | Technology | 9.13 | 49 | 0.33% | 2.82% |
| UIS | Unisys | | Technology | 5.13 | 42 | -1.54% | 2.81% |
| CEVA | CEVA | | Technology | 20.16 | 62 | -1.18% | 2.80% |
| RWT | Redwood Trust | | Financials | 6.63 | 90 | 0.15% | 2.79% |
| SAH | Sonic Automotive | | Services & Goods | 59.67 | 68 | 0.13% | 2.77% |
| BFS | Saul Centers | | Financials | 37.91 | 100 | 1.61% | 2.76% |
| WASH | Washington Trust | | Financials | 27.54 | 95 | 0.69% | 2.72% |
| BCC | Boise Cascade | | Industrials | 137.29 | 70 | -2.53% | 2.70% |
| RES | RPC | | Energy | 6.90 | 42 | 1.02% | 2.68% |
| GABC | German American | | Financials | 33.22 | 100 | 0.88% | 2.66% |
| PMT | PennyMac Mortgage | | Financials | 15.17 | 100 | 1.27% | 2.50% |
| LAW | CS Disco | | Technology | 6.97 | 56 | -1.13% | 2.50% |
| HLIT | Harmonic | | Technology | 11.67 | 69 | 3.27% | 2.46% |
| PAHC | Phibro Animal | | Health Care | 17.98 | 83 | -1.48% | 2.45% |
| ITCI | Intra-Cellular Therapies | | Health Care | 66.53 | 18 | -0.46% | 2.42% |
| For chart view version of above stock list: Chart View ➞ 0 - 25 , 25 - 50 , 50 - 75 , 75 - 100 , 100 - 125 , 125 - 150 , 150 - 175 , 175 - 200 , 200 - 225 , 225 - 250 , 250 - 275 , 275 - 300 , 300 - 325 , 325 - 350 | ||
 | Click To Change The Sort Order: By Market Cap or Company Size Performance: Year-to-date, Week and Day |  |
| Too many stocks? View smallcap stocks filtered by marketcap & sector |
| Marketcap: All SmallCap Stocks (default-no microcap), Large, Mid-Range, Small |
| Smallcap Sector: Tech, Finance, Energy, Staples, Retail, Industrial, Materials, & Medical |
|
Get the most comprehensive stock market coverage daily at 12Stocks.com ➞ Best Stocks Today ➞ Best Stocks Weekly ➞ Best Stocks Year-to-Date ➞ Best Stocks Trends ➞  Best Stocks Today 12Stocks.com Best Nasdaq Stocks ➞ Best S&P 500 Stocks ➞ Best Tech Stocks ➞ Best Biotech Stocks ➞ |
| Detailed Overview of SmallCap Stocks |
| SmallCap Technical Overview, Leaders & Laggards, Top SmallCap ETF Funds & Detailed SmallCap Stocks List, Charts, Trends & More |
| Smallcap: Technical Analysis, Trends & YTD Performance | |
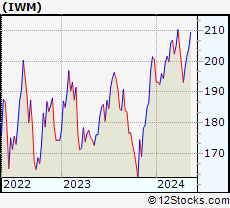
| SmallCap segment as represented by
IWM, an exchange-traded fund [ETF], holds basket of thousands of smallcap stocks from across all major sectors of the US stock market. The smallcap index (contains stocks like Riverbed & Sotheby's) is up by 3.6% and is currently underperforming the overall market by -6.82% year-to-date. Below is a quick view of technical charts and trends: | |
 IWM Weekly Chart |
|
| Long Term Trend: Very Good | |
| Medium Term Trend: Very Good | |
 IWM Daily Chart |
|
| Short Term Trend: Good | |
| Overall Trend Score: 90 | |
| YTD Performance: 3.6% | |
| **Trend Scores & Views Are Only For Educational Purposes And Not For Investing | |
| 12Stocks.com: Top Performing Small Cap Index Stocks | ||||||||||||||||||||||||||||||||||||||||||||||||
 The top performing Small Cap Index stocks year to date are
Now, more recently, over last week, the top performing Small Cap Index stocks on the move are


|
||||||||||||||||||||||||||||||||||||||||||||||||
| 12Stocks.com: Investing in Smallcap Index using Exchange Traded Funds | |
|
The following table shows list of key exchange traded funds (ETF) that
help investors track Smallcap index. The following list also includes leveraged ETF funds that track twice or thrice the daily returns of Smallcap indices. Short or inverse ETF funds move in the opposite direction to the index they track and are useful during market pullbacks or during bear markets. Quick View: Move mouse or cursor over ETF symbol (ticker) to view short-term technical chart and over ETF name to view long term chart. Click on ticker or stock name for detailed view. Click on to add stock symbol to your watchlist and to view watchlist. |
12Stocks.com List of ETFs that track Smallcap Index
| Ticker | ETF Name | Watchlist | Recent Price | Smart Investing & Trading Score | Change % | Week % | Year-to-date % |
| IWM | iShares Russell 2000 | | 207.93 | 90 | -0.72 | 1.77 | 3.6% |
| VTWO | Vanguard Russell 2000 ETF | | 84.11 | 85 | -0.61 | 1.8 | 3.71% |
| IJR | iShares Core S&P Small-Cap | | 110.63 | 83 | -0.14 | 1.51 | 2.2% |
| IWN | iShares Russell 2000 Value | | 158.82 | 88 | 0.06 | 1.68 | 2.25% |
| IJT | iShares S&P Small-Cap 600 Growth | | 131.29 | 78 | -0.69 | 1.1 | 4.91% |
| IJS | iShares S&P Small-Cap 600 Value | | 102.02 | 83 | -0.11 | 1.49 | -1.02% |
| IWO | iShares Russell 2000 Growth | | 267.15 | 95 | 0.21 | 2.78 | 5.92% |
| XSLV | PowerShares S&P SmallCap Low Volatil ETF | | 44.48 | 76 | -0.02 | 0.57 | 0.75% |
| SBB | ProShares Short SmallCap600 | | 15.71 | 17 | 0.32 | -1.54 | -1.38% |
| SAA | ProShares Ultra SmallCap600 | | 24.78 | 71 | -1.69 | 1.77 | -0.68% |
| SMLV | SPDR SSGA US Small Cap Low Volatil ETF | | 112.79 | 95 | 0.22 | 1.41 | 0.24% |
| SDD | ProShares UltraShort SmallCap600 | | 17.67 | 27 | 0.00 | -3.34 | -4.11% |
| 12Stocks.com: Charts, Trends, Fundamental Data and Performances of SmallCap Stocks | |
|
We now take in-depth look at all SmallCap stocks including charts, multi-period performances and overall trends (as measured by Smart Investing & Trading Score). One can sort SmallCap stocks (click link to choose) by Daily, Weekly and by Year-to-Date performances. Also, one can sort by size of the company or by market capitalization. |
| Select Your Default Chart Type: | |||||
| |||||
| Click on stock symbol or name for detailed view. Click on to add stock symbol to your watchlist and to view watchlist. Quick View: Move mouse or cursor over "Daily" to quickly view daily technical stock chart and over "Weekly" to view weekly technical stock chart. | |||||

 | OFIX Orthofix Medical Inc. |
| Sector: Health Care | |
| SubSector: Medical Appliances & Equipment | |
| MarketCap: 508.18 Millions | |
| Recent Price: 15.11 Smart Investing & Trading Score: 76 | |
| Day Percent Change: -1.69% Day Change: -0.26 | |
| Week Change: 3.21% Year-to-date Change: 12.1% | |
| OFIX Links: Profile News Message Board | |
| Charts:- Daily , Weekly | |
| Add OFIX to Watchlist: View: Get Complete OFIX Trend Analysis ➞ | |
 | ETNB 89bio, Inc. |
| Sector: Health Care | |
| SubSector: Biotechnology | |
| MarketCap: 517.485 Millions | |
| Recent Price: 8.97 Smart Investing & Trading Score: 40 | |
| Day Percent Change: -2.50% Day Change: -0.23 | |
| Week Change: 3.1% Year-to-date Change: -19.7% | |
| ETNB Links: Profile News Message Board | |
| Charts:- Daily , Weekly | |
| Add ETNB to Watchlist: View: Get Complete ETNB Trend Analysis ➞ | |
 | TRTX TPG RE Finance Trust, Inc. |
| Sector: Financials | |
| SubSector: Mortgage Investment | |
| MarketCap: 607.739 Millions | |
| Recent Price: 8.85 Smart Investing & Trading Score: 83 | |
| Day Percent Change: 0.91% Day Change: 0.08 | |
| Week Change: 3.09% Year-to-date Change: 36.2% | |
| TRTX Links: Profile News Message Board | |
| Charts:- Daily , Weekly | |
| Add TRTX to Watchlist: View: Get Complete TRTX Trend Analysis ➞ | |
 | GLT P. H. Glatfelter Company |
| Sector: Consumer Staples | |
| SubSector: Paper & Paper Products | |
| MarketCap: 525.003 Millions | |
| Recent Price: 1.68 Smart Investing & Trading Score: 57 | |
| Day Percent Change: -1.18% Day Change: -0.02 | |
| Week Change: 3.07% Year-to-date Change: -13.4% | |
| GLT Links: Profile News Message Board | |
| Charts:- Daily , Weekly | |
| Add GLT to Watchlist: View: Get Complete GLT Trend Analysis ➞ | |
 | KREF KKR Real Estate Finance Trust Inc. |
| Sector: Financials | |
| SubSector: Mortgage Investment | |
| MarketCap: 645.939 Millions | |
| Recent Price: 9.84 Smart Investing & Trading Score: 93 | |
| Day Percent Change: 0.51% Day Change: 0.05 | |
| Week Change: 3.04% Year-to-date Change: -25.6% | |
| KREF Links: Profile News Message Board | |
| Charts:- Daily , Weekly | |
| Add KREF to Watchlist: View: Get Complete KREF Trend Analysis ➞ | |
 | SNBR Sleep Number Corporation |
| Sector: Consumer Staples | |
| SubSector: Home Furnishings & Fixtures | |
| MarketCap: 692.735 Millions | |
| Recent Price: 16.00 Smart Investing & Trading Score: 62 | |
| Day Percent Change: -2.20% Day Change: -0.36 | |
| Week Change: 3.03% Year-to-date Change: 7.9% | |
| SNBR Links: Profile News Message Board | |
| Charts:- Daily , Weekly | |
| Add SNBR to Watchlist: View: Get Complete SNBR Trend Analysis ➞ | |
 | MATW Matthews International Corporation |
| Sector: Services & Goods | |
| SubSector: Personal Services | |
| MarketCap: 803.325 Millions | |
| Recent Price: 29.70 Smart Investing & Trading Score: 88 | |
| Day Percent Change: 2.03% Day Change: 0.59 | |
| Week Change: 3.02% Year-to-date Change: -19.0% | |
| MATW Links: Profile News Message Board | |
| Charts:- Daily , Weekly | |
| Add MATW to Watchlist: View: Get Complete MATW Trend Analysis ➞ | |
 | CSTM Constellium SE |
| Sector: Materials | |
| SubSector: Aluminum | |
| MarketCap: 646.608 Millions | |
| Recent Price: 20.84 Smart Investing & Trading Score: 88 | |
| Day Percent Change: 3.22% Day Change: 0.65 | |
| Week Change: 2.96% Year-to-date Change: 4.4% | |
| CSTM Links: Profile News Message Board | |
| Charts:- Daily , Weekly | |
| Add CSTM to Watchlist: View: Get Complete CSTM Trend Analysis ➞ | |
 | KIDS OrthoPediatrics Corp. |
| Sector: Health Care | |
| SubSector: Medical Appliances & Equipment | |
| MarketCap: 742.28 Millions | |
| Recent Price: 31.79 Smart Investing & Trading Score: 88 | |
| Day Percent Change: 1.34% Day Change: 0.42 | |
| Week Change: 2.91% Year-to-date Change: -2.2% | |
| KIDS Links: Profile News Message Board | |
| Charts:- Daily , Weekly | |
| Add KIDS to Watchlist: View: Get Complete KIDS Trend Analysis ➞ | |
 | BRKL Brookline Bancorp, Inc. |
| Sector: Financials | |
| SubSector: Savings & Loans | |
| MarketCap: 894.43 Millions | |
| Recent Price: 9.06 Smart Investing & Trading Score: 74 | |
| Day Percent Change: 0.78% Day Change: 0.07 | |
| Week Change: 2.84% Year-to-date Change: -17.0% | |
| BRKL Links: Profile News Message Board | |
| Charts:- Daily , Weekly | |
| Add BRKL to Watchlist: View: Get Complete BRKL Trend Analysis ➞ | |
 | WEAV Weave Communications, Inc. |
| Sector: Technology | |
| SubSector: Software - Application | |
| MarketCap: 740 Millions | |
| Recent Price: 9.13 Smart Investing & Trading Score: 49 | |
| Day Percent Change: 0.33% Day Change: 0.03 | |
| Week Change: 2.82% Year-to-date Change: -21.4% | |
| WEAV Links: Profile News Message Board | |
| Charts:- Daily , Weekly | |
| Add WEAV to Watchlist: View: Get Complete WEAV Trend Analysis ➞ | |
 | UIS Unisys Corporation |
| Sector: Technology | |
| SubSector: Information Technology Services | |
| MarketCap: 803.868 Millions | |
| Recent Price: 5.13 Smart Investing & Trading Score: 42 | |
| Day Percent Change: -1.54% Day Change: -0.08 | |
| Week Change: 2.81% Year-to-date Change: -8.7% | |
| UIS Links: Profile News Message Board | |
| Charts:- Daily , Weekly | |
| Add UIS to Watchlist: View: Get Complete UIS Trend Analysis ➞ | |
 | CEVA CEVA, Inc. |
| Sector: Technology | |
| SubSector: Semiconductor - Specialized | |
| MarketCap: 587.06 Millions | |
| Recent Price: 20.16 Smart Investing & Trading Score: 62 | |
| Day Percent Change: -1.18% Day Change: -0.24 | |
| Week Change: 2.8% Year-to-date Change: -11.2% | |
| CEVA Links: Profile News Message Board | |
| Charts:- Daily , Weekly | |
| Add CEVA to Watchlist: View: Get Complete CEVA Trend Analysis ➞ | |
 | RWT Redwood Trust, Inc. |
| Sector: Financials | |
| SubSector: Mortgage Investment | |
| MarketCap: 674.739 Millions | |
| Recent Price: 6.63 Smart Investing & Trading Score: 90 | |
| Day Percent Change: 0.15% Day Change: 0.01 | |
| Week Change: 2.79% Year-to-date Change: -10.5% | |
| RWT Links: Profile News Message Board | |
| Charts:- Daily , Weekly | |
| Add RWT to Watchlist: View: Get Complete RWT Trend Analysis ➞ | |
 | SAH Sonic Automotive, Inc. |
| Sector: Services & Goods | |
| SubSector: Auto Dealerships | |
| MarketCap: 581.321 Millions | |
| Recent Price: 59.67 Smart Investing & Trading Score: 68 | |
| Day Percent Change: 0.13% Day Change: 0.08 | |
| Week Change: 2.77% Year-to-date Change: 6.2% | |
| SAH Links: Profile News Message Board | |
| Charts:- Daily , Weekly | |
| Add SAH to Watchlist: View: Get Complete SAH Trend Analysis ➞ | |
 | BFS Saul Centers, Inc. |
| Sector: Financials | |
| SubSector: REIT - Retail | |
| MarketCap: 689.914 Millions | |
| Recent Price: 37.91 Smart Investing & Trading Score: 100 | |
| Day Percent Change: 1.61% Day Change: 0.60 | |
| Week Change: 2.76% Year-to-date Change: -3.5% | |
| BFS Links: Profile News Message Board | |
| Charts:- Daily , Weekly | |
| Add BFS to Watchlist: View: Get Complete BFS Trend Analysis ➞ | |
 | WASH Washington Trust Bancorp, Inc. |
| Sector: Financials | |
| SubSector: Regional - Northeast Banks | |
| MarketCap: 590.099 Millions | |
| Recent Price: 27.54 Smart Investing & Trading Score: 95 | |
| Day Percent Change: 0.69% Day Change: 0.19 | |
| Week Change: 2.72% Year-to-date Change: -15.0% | |
| WASH Links: Profile News Message Board | |
| Charts:- Daily , Weekly | |
| Add WASH to Watchlist: View: Get Complete WASH Trend Analysis ➞ | |
 | BCC Boise Cascade Company |
| Sector: Industrials | |
| SubSector: Lumber, Wood Production | |
| MarketCap: 963.938 Millions | |
| Recent Price: 137.29 Smart Investing & Trading Score: 70 | |
| Day Percent Change: -2.53% Day Change: -3.57 | |
| Week Change: 2.7% Year-to-date Change: 6.1% | |
| BCC Links: Profile News Message Board | |
| Charts:- Daily , Weekly | |
| Add BCC to Watchlist: View: Get Complete BCC Trend Analysis ➞ | |
 | RES RPC, Inc. |
| Sector: Energy | |
| SubSector: Oil & Gas Equipment & Services | |
| MarketCap: 546.261 Millions | |
| Recent Price: 6.90 Smart Investing & Trading Score: 42 | |
| Day Percent Change: 1.02% Day Change: 0.07 | |
| Week Change: 2.68% Year-to-date Change: -5.2% | |
| RES Links: Profile News Message Board | |
| Charts:- Daily , Weekly | |
| Add RES to Watchlist: View: Get Complete RES Trend Analysis ➞ | |
 | GABC German American Bancorp, Inc. |
| Sector: Financials | |
| SubSector: Regional - Midwest Banks | |
| MarketCap: 731.47 Millions | |
| Recent Price: 33.22 Smart Investing & Trading Score: 100 | |
| Day Percent Change: 0.88% Day Change: 0.29 | |
| Week Change: 2.66% Year-to-date Change: 2.5% | |
| GABC Links: Profile News Message Board | |
| Charts:- Daily , Weekly | |
| Add GABC to Watchlist: View: Get Complete GABC Trend Analysis ➞ | |
 | PMT PennyMac Mortgage Investment Trust |
| Sector: Financials | |
| SubSector: Mortgage Investment | |
| MarketCap: 917.639 Millions | |
| Recent Price: 15.17 Smart Investing & Trading Score: 100 | |
| Day Percent Change: 1.27% Day Change: 0.19 | |
| Week Change: 2.5% Year-to-date Change: 1.5% | |
| PMT Links: Profile News Message Board | |
| Charts:- Daily , Weekly | |
| Add PMT to Watchlist: View: Get Complete PMT Trend Analysis ➞ | |
 | LAW CS Disco, Inc. |
| Sector: Technology | |
| SubSector: Software - Application | |
| MarketCap: 505 Millions | |
| Recent Price: 6.97 Smart Investing & Trading Score: 56 | |
| Day Percent Change: -1.13% Day Change: -0.08 | |
| Week Change: 2.5% Year-to-date Change: -8.8% | |
| LAW Links: Profile News Message Board | |
| Charts:- Daily , Weekly | |
| Add LAW to Watchlist: View: Get Complete LAW Trend Analysis ➞ | |
 | HLIT Harmonic Inc. |
| Sector: Technology | |
| SubSector: Communication Equipment | |
| MarketCap: 533.539 Millions | |
| Recent Price: 11.67 Smart Investing & Trading Score: 69 | |
| Day Percent Change: 3.27% Day Change: 0.37 | |
| Week Change: 2.46% Year-to-date Change: -10.5% | |
| HLIT Links: Profile News Message Board | |
| Charts:- Daily , Weekly | |
| Add HLIT to Watchlist: View: Get Complete HLIT Trend Analysis ➞ | |
 | PAHC Phibro Animal Health Corporation |
| Sector: Health Care | |
| SubSector: Specialized Health Services | |
| MarketCap: 852.956 Millions | |
| Recent Price: 17.98 Smart Investing & Trading Score: 83 | |
| Day Percent Change: -1.48% Day Change: -0.27 | |
| Week Change: 2.45% Year-to-date Change: 55.3% | |
| PAHC Links: Profile News Message Board | |
| Charts:- Daily , Weekly | |
| Add PAHC to Watchlist: View: Get Complete PAHC Trend Analysis ➞ | |
 | ITCI Intra-Cellular Therapies, Inc. |
| Sector: Health Care | |
| SubSector: Biotechnology | |
| MarketCap: 991.885 Millions | |
| Recent Price: 66.53 Smart Investing & Trading Score: 18 | |
| Day Percent Change: -0.46% Day Change: -0.31 | |
| Week Change: 2.42% Year-to-date Change: -7.1% | |
| ITCI Links: Profile News Message Board | |
| Charts:- Daily , Weekly | |
| Add ITCI to Watchlist: View: Get Complete ITCI Trend Analysis ➞ | |
| For tabular summary view of above stock list: Summary View ➞ 0 - 25 , 25 - 50 , 50 - 75 , 75 - 100 , 100 - 125 , 125 - 150 , 150 - 175 , 175 - 200 , 200 - 225 , 225 - 250 , 250 - 275 , 275 - 300 , 300 - 325 , 325 - 350 | ||
| Click To Change The Sort Order: By Market Cap or Company Size Performance: Year-to-date, Week and Day | |
| Select Chart Type: | ||
| Too many stocks? View smallcap stocks filtered by marketcap & sector |
| Marketcap: All SmallCap Stocks (default-no microcap), Large, Mid-Range, Small & MicroCap |
| Sector: Tech, Finance, Energy, Staples, Retail, Industrial, Materials, Utilities & Medical |
|
Best Stocks Today 12Stocks.com |
© 2024 12Stocks.com Terms & Conditions Privacy Contact Us
All Information Provided Only For Education And Not To Be Used For Investing or Trading. See Terms & Conditions


One More Thing ... Get Best Stocks Delivered Daily!
Never Ever Miss A Move With Our Top Ten Stocks Lists
Find Best Stocks In Any Market - Bull or Bear Market
Take A Peek At Our Top Ten Stocks Lists: Daily, Weekly, Year-to-Date & Top Trends
Find Best Stocks In Any Market - Bull or Bear Market
Take A Peek At Our Top Ten Stocks Lists: Daily, Weekly, Year-to-Date & Top Trends
Smallcap Stocks With Best Up Trends [0-bearish to 100-bullish]: Trupanion [100], Zura Bio[100], SilverBow Resources[100], Novavax [100], Third Harmonic[100], Hawkins [100], BRP Group[100], Kura Sushi[100], Aurinia [100], Heron [100], Cadiz [100]
Best Smallcap Stocks Year-to-Date:
CareMax [471.13%], Bakkt [370.4%], Janux [342.16%], Viking [304.73%], Alpine Immune[241.18%], Longboard [235.68%], Super Micro[218.16%], Avidity Biosciences[217.7%], Novavax [200%], Arcutis Bio[182.35%], Sweetgreen [181.24%] Best Smallcap Stocks This Week:
Novavax [62.16%], MacroGenics [54.68%], Maxeon Solar[49.31%], SunPower [43.04%], Harrow Health[39.31%], Workhorse Group[39.06%], Humacyte [36.6%], ProKidney [34.88%], Allbirds [33.47%], Cadiz [28.76%], Fossil Group[28.72%] Best Smallcap Stocks Daily:
Maxeon Solar[26.56%], Allakos [22.36%], Ventyx Biosciences[18.85%], Trupanion [15.85%], Zura Bio[15.61%], Beyond Air[15.42%], SilverBow Resources[13.20%], Children s[13.09%], Comtech Tele[12.92%], Aceto [12.14%], Novavax [11.63%]