
 Login Sign Up


| |||||
 |  | ||||

| 12Stocks.com Market Intelligence |
Best SmallCap Stocks
|
| In a hurry? Small Cap Stock Lists: Performance Trends Table, Stock Charts
Sort Small Cap stocks: Daily, Weekly, Year-to-Date, Market Cap & Trends. Filter Small Cap stocks list by sector: Show all, Tech, Finance, Energy, Staples, Retail, Industrial, Materials, Utilities and HealthCare Filter Small Cap stocks list by size: All Large Medium Small and MicroCap |
| 12Stocks.com Small Cap Stocks Performances & Trends Daily | |||||||||
|
|  The overall Smart Investing & Trading Score is 90 (0-bearish to 100-bullish) which puts Small Cap index in short term bullish trend. The Smart Investing & Trading Score from previous trading session is 100 and hence a deterioration of trend.
| ||||||||
Here are the Smart Investing & Trading Scores of the most requested small cap stocks at 12Stocks.com (click stock name for detailed review):
|


| 12Stocks.com: Investing in Smallcap Index with Stocks | |
|
The following table helps investors and traders sort through current performance and trends (as measured by Smart Investing & Trading Score) of various
stocks in the Smallcap Index. Quick View: Move mouse or cursor over stock symbol (ticker) to view short-term technical chart and over stock name to view long term chart. Click on  to add stock symbol to your watchlist and to add stock symbol to your watchlist and  to view watchlist. Click on any ticker or stock name for detailed market intelligence report for that stock. to view watchlist. Click on any ticker or stock name for detailed market intelligence report for that stock. |
12Stocks.com Performance of Stocks in Smallcap Index
| Ticker | Stock Name | Watchlist | Category | Recent Price | Smart Investing & Trading Score | Change % | Weekly Change% |
| ALTI | AlTi Global |   | Financials | 4.55 | 17 | 2.48% | -1.30% |
| KELYA | Kelly Services | | Services & Goods | 22.89 | 32 | 0.31% | -1.38% |
| CENTA | Central Garden | | Materials | 39.60 | 68 | -3.04% | -1.57% |
| ROAD | Construction Partners | | Industrials | 54.80 | 61 | -4.26% | -1.60% |
| APOG | Apogee Enterprises | | Industrials | 65.78 | 76 | -1.91% | -1.64% |
| HMST | HomeStreet | | Financials | 10.16 | 23 | 0.10% | -1.65% |
| NPO | EnPro Industries | | Industrials | 149.51 | 15 | -2.66% | -1.68% |
| COOK | Traeger | | Services & Goods | 2.29 | 51 | -2.97% | -1.72% |
| TCMD | Tactile Systems | | Health Care | 13.66 | 10 | -0.22% | -1.73% |
| OXM | Oxford Industries | | Consumer Staples | 107.33 | 44 | 0.71% | -1.75% |
| ANDE | Andersons | | Consumer Staples | 52.46 | 32 | 0.65% | -1.76% |
| SMP | Standard Motor | | Consumer Staples | 31.95 | 30 | 0.73% | -1.81% |
| SST | System1 | | Industrials | 1.57 | 15 | 0.64% | -1.88% |
| ARCB | ArcBest | | Transports | 115.17 | 17 | -2.26% | -1.90% |
| YMAB | Y-mAbs | | Health Care | 11.85 | 10 | -2.71% | -1.90% |
| CSWI | CSW Industrials | | Industrials | 242.79 | 54 | -1.43% | -1.95% |
| DY | Dycom Industries | | Industrials | 147.48 | 58 | -1.67% | -2.05% |
| PATK | Patrick Industries | | Industrials | 112.49 | 40 | -2.50% | -2.08% |
| CDNA | CareDx | | Services & Goods | 14.52 | 68 | -2.22% | -2.09% |
| XPER | Xperi | | Technology | 9.78 | 8 | -2.30% | -2.10% |
| IHRT | iHeartMedia | | Services & Goods | 1.29 | 32 | 4.03% | -2.27% |
| MUR | Murphy Oil | | Energy | 43.21 | 33 | -1.53% | -2.33% |
| NRDY | Nerdy | | Technology | 2.08 | 10 | -2.35% | -2.35% |
| ARIS | Aris Water | | Utilities | 16.42 | 73 | -1.68% | -2.49% |
| GRC | Gorman-Rupp | | Industrials | 32.54 | 0 | -1.24% | -2.55% |
| For chart view version of above stock list: Chart View ➞ 0 - 25 , 25 - 50 , 50 - 75 , 75 - 100 , 100 - 125 , 125 - 150 , 150 - 175 , 175 - 200 , 200 - 225 , 225 - 250 , 250 - 275 , 275 - 300 , 300 - 325 , 325 - 350 | ||
 | Click To Change The Sort Order: By Market Cap or Company Size Performance: Year-to-date, Week and Day |  |
| Too many stocks? View smallcap stocks filtered by marketcap & sector |
| Marketcap: All SmallCap Stocks (default-no microcap), Large, Mid-Range, Small |
| Smallcap Sector: Tech, Finance, Energy, Staples, Retail, Industrial, Materials, & Medical |
|
Get the most comprehensive stock market coverage daily at 12Stocks.com ➞ Best Stocks Today ➞ Best Stocks Weekly ➞ Best Stocks Year-to-Date ➞ Best Stocks Trends ➞  Best Stocks Today 12Stocks.com Best Nasdaq Stocks ➞ Best S&P 500 Stocks ➞ Best Tech Stocks ➞ Best Biotech Stocks ➞ |
| Detailed Overview of SmallCap Stocks |
| SmallCap Technical Overview, Leaders & Laggards, Top SmallCap ETF Funds & Detailed SmallCap Stocks List, Charts, Trends & More |
| Smallcap: Technical Analysis, Trends & YTD Performance | |
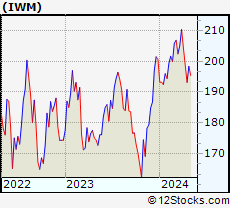
| SmallCap segment as represented by
IWM, an exchange-traded fund [ETF], holds basket of thousands of smallcap stocks from across all major sectors of the US stock market. The smallcap index (contains stocks like Riverbed & Sotheby's) is up by 3.6% and is currently underperforming the overall market by -6.82% year-to-date. Below is a quick view of technical charts and trends: | |
 IWM Weekly Chart |
|
| Long Term Trend: Very Good | |
| Medium Term Trend: Very Good | |
 IWM Daily Chart |
|
| Short Term Trend: Good | |
| Overall Trend Score: 90 | |
| YTD Performance: 3.6% | |
| **Trend Scores & Views Are Only For Educational Purposes And Not For Investing | |
| 12Stocks.com: Top Performing Small Cap Index Stocks | ||||||||||||||||||||||||||||||||||||||||||||||||
 The top performing Small Cap Index stocks year to date are
Now, more recently, over last week, the top performing Small Cap Index stocks on the move are


|
||||||||||||||||||||||||||||||||||||||||||||||||
| 12Stocks.com: Investing in Smallcap Index using Exchange Traded Funds | |
|
The following table shows list of key exchange traded funds (ETF) that
help investors track Smallcap index. The following list also includes leveraged ETF funds that track twice or thrice the daily returns of Smallcap indices. Short or inverse ETF funds move in the opposite direction to the index they track and are useful during market pullbacks or during bear markets. Quick View: Move mouse or cursor over ETF symbol (ticker) to view short-term technical chart and over ETF name to view long term chart. Click on ticker or stock name for detailed view. Click on to add stock symbol to your watchlist and to view watchlist. |
12Stocks.com List of ETFs that track Smallcap Index
| Ticker | ETF Name | Watchlist | Recent Price | Smart Investing & Trading Score | Change % | Week % | Year-to-date % |
| IWM | iShares Russell 2000 | | 207.93 | 90 | -0.72 | 1.77 | 3.6% |
| VTWO | Vanguard Russell 2000 ETF | | 84.11 | 85 | -0.61 | 1.8 | 3.71% |
| IJR | iShares Core S&P Small-Cap | | 110.63 | 83 | -0.14 | 1.51 | 2.2% |
| IWN | iShares Russell 2000 Value | | 158.82 | 88 | 0.06 | 1.68 | 2.25% |
| IJT | iShares S&P Small-Cap 600 Growth | | 131.29 | 78 | -0.69 | 1.1 | 4.91% |
| IJS | iShares S&P Small-Cap 600 Value | | 102.02 | 83 | -0.11 | 1.49 | -1.02% |
| IWO | iShares Russell 2000 Growth | | 267.15 | 95 | 0.21 | 2.78 | 5.92% |
| XSLV | PowerShares S&P SmallCap Low Volatil ETF | | 44.48 | 76 | -0.02 | 0.57 | 0.75% |
| SBB | ProShares Short SmallCap600 | | 15.71 | 17 | 0.32 | -1.54 | -1.38% |
| SAA | ProShares Ultra SmallCap600 | | 24.78 | 71 | -1.69 | 1.77 | -0.68% |
| SMLV | SPDR SSGA US Small Cap Low Volatil ETF | | 112.79 | 95 | 0.22 | 1.41 | 0.24% |
| SDD | ProShares UltraShort SmallCap600 | | 17.67 | 27 | 0.00 | -3.34 | -4.11% |
| 12Stocks.com: Charts, Trends, Fundamental Data and Performances of SmallCap Stocks | |
|
We now take in-depth look at all SmallCap stocks including charts, multi-period performances and overall trends (as measured by Smart Investing & Trading Score). One can sort SmallCap stocks (click link to choose) by Daily, Weekly and by Year-to-Date performances. Also, one can sort by size of the company or by market capitalization. |
| Select Your Default Chart Type: | |||||
| |||||
| Click on stock symbol or name for detailed view. Click on to add stock symbol to your watchlist and to view watchlist. Quick View: Move mouse or cursor over "Daily" to quickly view daily technical stock chart and over "Weekly" to view weekly technical stock chart. | |||||

 | ALTI AlTi Global, Inc. |
| Sector: Financials | |
| SubSector: Asset Management | |
| MarketCap: 917 Millions | |
| Recent Price: 4.55 Smart Investing & Trading Score: 17 | |
| Day Percent Change: 2.48% Day Change: 0.11 | |
| Week Change: -1.3% Year-to-date Change: -49.8% | |
| ALTI Links: Profile News Message Board | |
| Charts:- Daily , Weekly | |
| Add ALTI to Watchlist: View: Get Complete ALTI Trend Analysis ➞ | |
 | KELYA Kelly Services, Inc. |
| Sector: Services & Goods | |
| SubSector: Staffing & Outsourcing Services | |
| MarketCap: 587.228 Millions | |
| Recent Price: 22.89 Smart Investing & Trading Score: 32 | |
| Day Percent Change: 0.31% Day Change: 0.07 | |
| Week Change: -1.38% Year-to-date Change: 5.9% | |
| KELYA Links: Profile News Message Board | |
| Charts:- Daily , Weekly | |
| Add KELYA to Watchlist: View: Get Complete KELYA Trend Analysis ➞ | |
 | CENTA Central Garden & Pet Company |
| Sector: Materials | |
| SubSector: Agricultural Chemicals | |
| MarketCap: 953 Millions | |
| Recent Price: 39.60 Smart Investing & Trading Score: 68 | |
| Day Percent Change: -3.04% Day Change: -1.24 | |
| Week Change: -1.57% Year-to-date Change: -10.1% | |
| CENTA Links: Profile News Message Board | |
| Charts:- Daily , Weekly | |
| Add CENTA to Watchlist: View: Get Complete CENTA Trend Analysis ➞ | |
 | ROAD Construction Partners, Inc. |
| Sector: Industrials | |
| SubSector: Heavy Construction | |
| MarketCap: 903.095 Millions | |
| Recent Price: 54.80 Smart Investing & Trading Score: 61 | |
| Day Percent Change: -4.26% Day Change: -2.44 | |
| Week Change: -1.6% Year-to-date Change: 25.9% | |
| ROAD Links: Profile News Message Board | |
| Charts:- Daily , Weekly | |
| Add ROAD to Watchlist: View: Get Complete ROAD Trend Analysis ➞ | |
 | APOG Apogee Enterprises, Inc. |
| Sector: Industrials | |
| SubSector: General Building Materials | |
| MarketCap: 510.653 Millions | |
| Recent Price: 65.78 Smart Investing & Trading Score: 76 | |
| Day Percent Change: -1.91% Day Change: -1.28 | |
| Week Change: -1.64% Year-to-date Change: 23.2% | |
| APOG Links: Profile News Message Board | |
| Charts:- Daily , Weekly | |
| Add APOG to Watchlist: View: Get Complete APOG Trend Analysis ➞ | |
 | HMST HomeStreet, Inc. |
| Sector: Financials | |
| SubSector: Savings & Loans | |
| MarketCap: 535.33 Millions | |
| Recent Price: 10.16 Smart Investing & Trading Score: 23 | |
| Day Percent Change: 0.10% Day Change: 0.01 | |
| Week Change: -1.65% Year-to-date Change: -1.4% | |
| HMST Links: Profile News Message Board | |
| Charts:- Daily , Weekly | |
| Add HMST to Watchlist: View: Get Complete HMST Trend Analysis ➞ | |
 | NPO EnPro Industries, Inc. |
| Sector: Industrials | |
| SubSector: Industrial Equipment & Components | |
| MarketCap: 734.309 Millions | |
| Recent Price: 149.51 Smart Investing & Trading Score: 15 | |
| Day Percent Change: -2.66% Day Change: -4.09 | |
| Week Change: -1.68% Year-to-date Change: -4.6% | |
| NPO Links: Profile News Message Board | |
| Charts:- Daily , Weekly | |
| Add NPO to Watchlist: View: Get Complete NPO Trend Analysis ➞ | |
 | COOK Traeger, Inc. |
| Sector: Services & Goods | |
| SubSector: Furnishings, Fixtures & Appliances | |
| MarketCap: 524 Millions | |
| Recent Price: 2.29 Smart Investing & Trading Score: 51 | |
| Day Percent Change: -2.97% Day Change: -0.07 | |
| Week Change: -1.72% Year-to-date Change: -18.9% | |
| COOK Links: Profile News Message Board | |
| Charts:- Daily , Weekly | |
| Add COOK to Watchlist: View: Get Complete COOK Trend Analysis ➞ | |
 | TCMD Tactile Systems Technology, Inc. |
| Sector: Health Care | |
| SubSector: Medical Instruments & Supplies | |
| MarketCap: 655.96 Millions | |
| Recent Price: 13.66 Smart Investing & Trading Score: 10 | |
| Day Percent Change: -0.22% Day Change: -0.03 | |
| Week Change: -1.73% Year-to-date Change: -4.5% | |
| TCMD Links: Profile News Message Board | |
| Charts:- Daily , Weekly | |
| Add TCMD to Watchlist: View: Get Complete TCMD Trend Analysis ➞ | |
 | OXM Oxford Industries, Inc. |
| Sector: Consumer Staples | |
| SubSector: Textile - Apparel Clothing | |
| MarketCap: 647.665 Millions | |
| Recent Price: 107.33 Smart Investing & Trading Score: 44 | |
| Day Percent Change: 0.71% Day Change: 0.76 | |
| Week Change: -1.75% Year-to-date Change: 7.3% | |
| OXM Links: Profile News Message Board | |
| Charts:- Daily , Weekly | |
| Add OXM to Watchlist: View: Get Complete OXM Trend Analysis ➞ | |
 | ANDE The Andersons, Inc. |
| Sector: Consumer Staples | |
| SubSector: Farm Products | |
| MarketCap: 630.887 Millions | |
| Recent Price: 52.46 Smart Investing & Trading Score: 32 | |
| Day Percent Change: 0.65% Day Change: 0.34 | |
| Week Change: -1.76% Year-to-date Change: -8.8% | |
| ANDE Links: Profile News Message Board | |
| Charts:- Daily , Weekly | |
| Add ANDE to Watchlist: View: Get Complete ANDE Trend Analysis ➞ | |
 | SMP Standard Motor Products, Inc. |
| Sector: Consumer Staples | |
| SubSector: Auto Parts | |
| MarketCap: 909.939 Millions | |
| Recent Price: 31.95 Smart Investing & Trading Score: 30 | |
| Day Percent Change: 0.73% Day Change: 0.23 | |
| Week Change: -1.81% Year-to-date Change: -19.7% | |
| SMP Links: Profile News Message Board | |
| Charts:- Daily , Weekly | |
| Add SMP to Watchlist: View: Get Complete SMP Trend Analysis ➞ | |
 | SST System1, Inc. |
| Sector: Industrials | |
| SubSector: Specialty Business Services | |
| MarketCap: 504 Millions | |
| Recent Price: 1.57 Smart Investing & Trading Score: 15 | |
| Day Percent Change: 0.64% Day Change: 0.01 | |
| Week Change: -1.88% Year-to-date Change: -34.9% | |
| SST Links: Profile News Message Board | |
| Charts:- Daily , Weekly | |
| Add SST to Watchlist: View: Get Complete SST Trend Analysis ➞ | |
 | ARCB ArcBest Corporation |
| Sector: Transports | |
| SubSector: Trucking | |
| MarketCap: 515.415 Millions | |
| Recent Price: 115.17 Smart Investing & Trading Score: 17 | |
| Day Percent Change: -2.26% Day Change: -2.66 | |
| Week Change: -1.9% Year-to-date Change: -4.2% | |
| ARCB Links: Profile News Message Board | |
| Charts:- Daily , Weekly | |
| Add ARCB to Watchlist: View: Get Complete ARCB Trend Analysis ➞ | |
 | YMAB Y-mAbs Therapeutics, Inc. |
| Sector: Health Care | |
| SubSector: Biotechnology | |
| MarketCap: 899.585 Millions | |
| Recent Price: 11.85 Smart Investing & Trading Score: 10 | |
| Day Percent Change: -2.71% Day Change: -0.33 | |
| Week Change: -1.9% Year-to-date Change: 73.8% | |
| YMAB Links: Profile News Message Board | |
| Charts:- Daily , Weekly | |
| Add YMAB to Watchlist: View: Get Complete YMAB Trend Analysis ➞ | |
 | CSWI CSW Industrials, Inc. |
| Sector: Industrials | |
| SubSector: Diversified Machinery | |
| MarketCap: 985.616 Millions | |
| Recent Price: 242.79 Smart Investing & Trading Score: 54 | |
| Day Percent Change: -1.43% Day Change: -3.53 | |
| Week Change: -1.95% Year-to-date Change: 17.1% | |
| CSWI Links: Profile News Message Board | |
| Charts:- Daily , Weekly | |
| Add CSWI to Watchlist: View: Get Complete CSWI Trend Analysis ➞ | |
 | DY Dycom Industries, Inc. |
| Sector: Industrials | |
| SubSector: Heavy Construction | |
| MarketCap: 576.295 Millions | |
| Recent Price: 147.48 Smart Investing & Trading Score: 58 | |
| Day Percent Change: -1.67% Day Change: -2.50 | |
| Week Change: -2.05% Year-to-date Change: 28.1% | |
| DY Links: Profile News Message Board | |
| Charts:- Daily , Weekly | |
| Add DY to Watchlist: View: Get Complete DY Trend Analysis ➞ | |
 | PATK Patrick Industries, Inc. |
| Sector: Industrials | |
| SubSector: Lumber, Wood Production | |
| MarketCap: 565.838 Millions | |
| Recent Price: 112.49 Smart Investing & Trading Score: 40 | |
| Day Percent Change: -2.50% Day Change: -2.88 | |
| Week Change: -2.08% Year-to-date Change: 12.1% | |
| PATK Links: Profile News Message Board | |
| Charts:- Daily , Weekly | |
| Add PATK to Watchlist: View: Get Complete PATK Trend Analysis ➞ | |
 | CDNA CareDx, Inc |
| Sector: Services & Goods | |
| SubSector: Research Services | |
| MarketCap: 828.194 Millions | |
| Recent Price: 14.52 Smart Investing & Trading Score: 68 | |
| Day Percent Change: -2.22% Day Change: -0.33 | |
| Week Change: -2.09% Year-to-date Change: 21.0% | |
| CDNA Links: Profile News Message Board | |
| Charts:- Daily , Weekly | |
| Add CDNA to Watchlist: View: Get Complete CDNA Trend Analysis ➞ | |
 | XPER Xperi Corporation |
| Sector: Technology | |
| SubSector: Semiconductor Equipment & Materials | |
| MarketCap: 631.618 Millions | |
| Recent Price: 9.78 Smart Investing & Trading Score: 8 | |
| Day Percent Change: -2.30% Day Change: -0.23 | |
| Week Change: -2.1% Year-to-date Change: -11.3% | |
| XPER Links: Profile News Message Board | |
| Charts:- Daily , Weekly | |
| Add XPER to Watchlist: View: Get Complete XPER Trend Analysis ➞ | |
 | IHRT iHeartMedia, Inc. |
| Sector: Services & Goods | |
| SubSector: Broadcasting - Radio | |
| MarketCap: 694 Millions | |
| Recent Price: 1.29 Smart Investing & Trading Score: 32 | |
| Day Percent Change: 4.03% Day Change: 0.05 | |
| Week Change: -2.27% Year-to-date Change: -51.7% | |
| IHRT Links: Profile News Message Board | |
| Charts:- Daily , Weekly | |
| Add IHRT to Watchlist: View: Get Complete IHRT Trend Analysis ➞ | |
 | MUR Murphy Oil Corporation |
| Sector: Energy | |
| SubSector: Independent Oil & Gas | |
| MarketCap: 985.993 Millions | |
| Recent Price: 43.21 Smart Investing & Trading Score: 33 | |
| Day Percent Change: -1.53% Day Change: -0.67 | |
| Week Change: -2.33% Year-to-date Change: 1.3% | |
| MUR Links: Profile News Message Board | |
| Charts:- Daily , Weekly | |
| Add MUR to Watchlist: View: Get Complete MUR Trend Analysis ➞ | |
 | NRDY Nerdy, Inc. |
| Sector: Technology | |
| SubSector: Software - Application | |
| MarketCap: 683 Millions | |
| Recent Price: 2.08 Smart Investing & Trading Score: 10 | |
| Day Percent Change: -2.35% Day Change: -0.05 | |
| Week Change: -2.35% Year-to-date Change: -39.5% | |
| NRDY Links: Profile News Message Board | |
| Charts:- Daily , Weekly | |
| Add NRDY to Watchlist: View: Get Complete NRDY Trend Analysis ➞ | |
 | ARIS Aris Water Solutions, Inc. |
| Sector: Utilities | |
| SubSector: Utilities - Regulated Water | |
| MarketCap: 575 Millions | |
| Recent Price: 16.42 Smart Investing & Trading Score: 73 | |
| Day Percent Change: -1.68% Day Change: -0.28 | |
| Week Change: -2.49% Year-to-date Change: 95.7% | |
| ARIS Links: Profile News Message Board | |
| Charts:- Daily , Weekly | |
| Add ARIS to Watchlist: View: Get Complete ARIS Trend Analysis ➞ | |
 | GRC The Gorman-Rupp Company |
| Sector: Industrials | |
| SubSector: Diversified Machinery | |
| MarketCap: 729.616 Millions | |
| Recent Price: 32.54 Smart Investing & Trading Score: 0 | |
| Day Percent Change: -1.24% Day Change: -0.41 | |
| Week Change: -2.55% Year-to-date Change: -8.4% | |
| GRC Links: Profile News Message Board | |
| Charts:- Daily , Weekly | |
| Add GRC to Watchlist: View: Get Complete GRC Trend Analysis ➞ | |
| For tabular summary view of above stock list: Summary View ➞ 0 - 25 , 25 - 50 , 50 - 75 , 75 - 100 , 100 - 125 , 125 - 150 , 150 - 175 , 175 - 200 , 200 - 225 , 225 - 250 , 250 - 275 , 275 - 300 , 300 - 325 , 325 - 350 | ||
| Click To Change The Sort Order: By Market Cap or Company Size Performance: Year-to-date, Week and Day | |
| Select Chart Type: | ||
| Too many stocks? View smallcap stocks filtered by marketcap & sector |
| Marketcap: All SmallCap Stocks (default-no microcap), Large, Mid-Range, Small & MicroCap |
| Sector: Tech, Finance, Energy, Staples, Retail, Industrial, Materials, Utilities & Medical |
|
Best Stocks Today 12Stocks.com |
© 2024 12Stocks.com Terms & Conditions Privacy Contact Us
All Information Provided Only For Education And Not To Be Used For Investing or Trading. See Terms & Conditions


One More Thing ... Get Best Stocks Delivered Daily!
Never Ever Miss A Move With Our Top Ten Stocks Lists
Find Best Stocks In Any Market - Bull or Bear Market
Take A Peek At Our Top Ten Stocks Lists: Daily, Weekly, Year-to-Date & Top Trends
Find Best Stocks In Any Market - Bull or Bear Market
Take A Peek At Our Top Ten Stocks Lists: Daily, Weekly, Year-to-Date & Top Trends
Smallcap Stocks With Best Up Trends [0-bearish to 100-bullish]: Trupanion [100], Zura Bio[100], SilverBow Resources[100], Novavax [100], Third Harmonic[100], Hawkins [100], BRP Group[100], Kura Sushi[100], Aurinia [100], Heron [100], Cadiz [100]
Best Smallcap Stocks Year-to-Date:
CareMax [471.13%], Bakkt [370.4%], Janux [342.16%], Viking [304.73%], Alpine Immune[241.18%], Longboard [235.68%], Super Micro[218.16%], Avidity Biosciences[217.7%], Novavax [200%], Arcutis Bio[182.35%], Sweetgreen [181.24%] Best Smallcap Stocks This Week:
Novavax [62.16%], MacroGenics [54.68%], Maxeon Solar[49.31%], SunPower [43.04%], Harrow Health[39.31%], Workhorse Group[39.06%], Humacyte [36.6%], ProKidney [34.88%], Allbirds [33.47%], Cadiz [28.76%], Fossil Group[28.72%] Best Smallcap Stocks Daily:
Maxeon Solar[26.56%], Allakos [22.36%], Ventyx Biosciences[18.85%], Trupanion [15.85%], Zura Bio[15.61%], Beyond Air[15.42%], SilverBow Resources[13.20%], Children s[13.09%], Comtech Tele[12.92%], Aceto [12.14%], Novavax [11.63%]