
 Login Sign Up


| |||||
 |  | ||||

| 12Stocks.com Market Intelligence |
Best SmallCap Stocks
|
| In a hurry? Small Cap Stock Lists: Performance Trends Table, Stock Charts
Sort Small Cap stocks: Daily, Weekly, Year-to-Date, Market Cap & Trends. Filter Small Cap stocks list by sector: Show all, Tech, Finance, Energy, Staples, Retail, Industrial, Materials, Utilities and HealthCare Filter Small Cap stocks list by size: All Large Medium Small and MicroCap |
| 12Stocks.com Small Cap Stocks Performances & Trends Daily | |||||||||
|
|  The overall Smart Investing & Trading Score is 90 (0-bearish to 100-bullish) which puts Small Cap index in short term bullish trend. The Smart Investing & Trading Score from previous trading session is 100 and hence a deterioration of trend.
| ||||||||
Here are the Smart Investing & Trading Scores of the most requested small cap stocks at 12Stocks.com (click stock name for detailed review):
|


| 12Stocks.com: Investing in Smallcap Index with Stocks | |
|
The following table helps investors and traders sort through current performance and trends (as measured by Smart Investing & Trading Score) of various
stocks in the Smallcap Index. Quick View: Move mouse or cursor over stock symbol (ticker) to view short-term technical chart and over stock name to view long term chart. Click on  to add stock symbol to your watchlist and to add stock symbol to your watchlist and  to view watchlist. Click on any ticker or stock name for detailed market intelligence report for that stock. to view watchlist. Click on any ticker or stock name for detailed market intelligence report for that stock. |
12Stocks.com Performance of Stocks in Smallcap Index
| Ticker | Stock Name | Watchlist | Category | Recent Price | Smart Investing & Trading Score | Change % | Weekly Change% |
| COOP | Mr. Cooper |   | Financials | 84.22 | 100 | 1.34% | 0.53% |
| DTC | Solo Brands | | Services & Goods | 2.04 | 57 | 2.00% | 0.49% |
| UCTT | Ultra Clean | | Technology | 44.37 | 90 | -1.94% | 0.48% |
| TROX | Tronox | | Materials | 19.20 | 71 | -1.54% | 0.47% |
| SBSI | Southside Bancshares | | Financials | 28.09 | 62 | 0.25% | 0.43% |
| PLUS | ePlus | | Technology | 80.19 | 54 | 0.07% | 0.41% |
| PRIM | Primoris Services | | Industrials | 50.44 | 85 | -1.62% | 0.40% |
| AXNX | Axonics Modulation | | Health Care | 67.67 | 58 | -0.03% | 0.40% |
| WIRE | Encore Wire | | Technology | 282.00 | 54 | 0.00% | 0.39% |
| CTS | CTS | | Technology | 51.78 | 83 | -0.40% | 0.37% |
| CASH | Meta Financial | | Financials | 54.17 | 83 | 0.30% | 0.37% |
| YORW | York Water | | Utilities | 38.58 | 83 | 0.34% | 0.34% |
| UTL | Unitil | | Utilities | 54.67 | 90 | 0.61% | 0.33% |
| WINA | Winmark | | Services & Goods | 373.90 | 40 | 0.37% | 0.32% |
| UPWK | Upwork | | Technology | 11.99 | 33 | -2.28% | 0.29% |
| ARDX | Ardelyx | | Health Care | 7.79 | 32 | -0.76% | 0.26% |
| SKT | Tanger Factory | | Financials | 27.89 | 25 | -1.41% | 0.25% |
| CHCT | Community Healthcare | | Financials | 24.05 | 28 | 0.12% | 0.25% |
| BUSE | First Busey | | Financials | 23.85 | 90 | 0.00% | 0.21% |
| OFLX | Omega Flex | | Industrials | 67.14 | 53 | 0.27% | 0.21% |
| HURN | Huron Consulting | | Services & Goods | 87.72 | 35 | 1.29% | 0.18% |
| CADE | Cadence Ban | | Financials | 29.29 | 83 | -1.51% | 0.17% |
| OFG | OFG Bancorp | | Financials | 37.91 | 78 | -0.60% | 0.16% |
| PLOW | Douglas Dynamics | | Consumer Staples | 25.37 | 76 | -0.63% | 0.16% |
| NWLI | National Western | | Financials | 491.23 | 70 | -0.01% | 0.12% |
| For chart view version of above stock list: Chart View ➞ 0 - 25 , 25 - 50 , 50 - 75 , 75 - 100 , 100 - 125 , 125 - 150 , 150 - 175 , 175 - 200 , 200 - 225 , 225 - 250 , 250 - 275 , 275 - 300 , 300 - 325 , 325 - 350 | ||
 | Click To Change The Sort Order: By Market Cap or Company Size Performance: Year-to-date, Week and Day |  |
| Too many stocks? View smallcap stocks filtered by marketcap & sector |
| Marketcap: All SmallCap Stocks (default-no microcap), Large, Mid-Range, Small |
| Smallcap Sector: Tech, Finance, Energy, Staples, Retail, Industrial, Materials, & Medical |
|
Get the most comprehensive stock market coverage daily at 12Stocks.com ➞ Best Stocks Today ➞ Best Stocks Weekly ➞ Best Stocks Year-to-Date ➞ Best Stocks Trends ➞  Best Stocks Today 12Stocks.com Best Nasdaq Stocks ➞ Best S&P 500 Stocks ➞ Best Tech Stocks ➞ Best Biotech Stocks ➞ |
| Detailed Overview of SmallCap Stocks |
| SmallCap Technical Overview, Leaders & Laggards, Top SmallCap ETF Funds & Detailed SmallCap Stocks List, Charts, Trends & More |
| Smallcap: Technical Analysis, Trends & YTD Performance | |
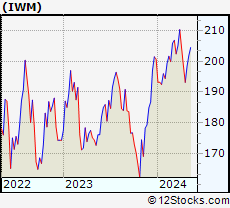
| SmallCap segment as represented by
IWM, an exchange-traded fund [ETF], holds basket of thousands of smallcap stocks from across all major sectors of the US stock market. The smallcap index (contains stocks like Riverbed & Sotheby's) is up by 3.6% and is currently underperforming the overall market by -6.82% year-to-date. Below is a quick view of technical charts and trends: | |
 IWM Weekly Chart |
|
| Long Term Trend: Very Good | |
| Medium Term Trend: Very Good | |
 IWM Daily Chart |
|
| Short Term Trend: Good | |
| Overall Trend Score: 90 | |
| YTD Performance: 3.6% | |
| **Trend Scores & Views Are Only For Educational Purposes And Not For Investing | |
| 12Stocks.com: Top Performing Small Cap Index Stocks | ||||||||||||||||||||||||||||||||||||||||||||||||
 The top performing Small Cap Index stocks year to date are
Now, more recently, over last week, the top performing Small Cap Index stocks on the move are


|
||||||||||||||||||||||||||||||||||||||||||||||||
| 12Stocks.com: Investing in Smallcap Index using Exchange Traded Funds | |
|
The following table shows list of key exchange traded funds (ETF) that
help investors track Smallcap index. The following list also includes leveraged ETF funds that track twice or thrice the daily returns of Smallcap indices. Short or inverse ETF funds move in the opposite direction to the index they track and are useful during market pullbacks or during bear markets. Quick View: Move mouse or cursor over ETF symbol (ticker) to view short-term technical chart and over ETF name to view long term chart. Click on ticker or stock name for detailed view. Click on to add stock symbol to your watchlist and to view watchlist. |
12Stocks.com List of ETFs that track Smallcap Index
| Ticker | ETF Name | Watchlist | Recent Price | Smart Investing & Trading Score | Change % | Week % | Year-to-date % |
| IWM | iShares Russell 2000 | | 207.93 | 90 | -0.72 | 1.77 | 3.6% |
| VTWO | Vanguard Russell 2000 ETF | | 84.11 | 85 | -0.61 | 1.8 | 3.71% |
| IJR | iShares Core S&P Small-Cap | | 110.63 | 83 | -0.14 | 1.51 | 2.2% |
| IWN | iShares Russell 2000 Value | | 158.82 | 88 | 0.06 | 1.68 | 2.25% |
| IJT | iShares S&P Small-Cap 600 Growth | | 131.29 | 78 | -0.69 | 1.1 | 4.91% |
| IJS | iShares S&P Small-Cap 600 Value | | 102.02 | 83 | -0.11 | 1.49 | -1.02% |
| IWO | iShares Russell 2000 Growth | | 267.15 | 95 | 0.21 | 2.78 | 5.92% |
| XSLV | PowerShares S&P SmallCap Low Volatil ETF | | 44.48 | 76 | -0.02 | 0.57 | 0.75% |
| SBB | ProShares Short SmallCap600 | | 15.71 | 17 | 0.32 | -1.54 | -1.38% |
| SAA | ProShares Ultra SmallCap600 | | 24.78 | 71 | -1.69 | 1.77 | -0.68% |
| SMLV | SPDR SSGA US Small Cap Low Volatil ETF | | 112.79 | 95 | 0.22 | 1.41 | 0.24% |
| SDD | ProShares UltraShort SmallCap600 | | 17.67 | 27 | 0.00 | -3.34 | -4.11% |
| 12Stocks.com: Charts, Trends, Fundamental Data and Performances of SmallCap Stocks | |
|
We now take in-depth look at all SmallCap stocks including charts, multi-period performances and overall trends (as measured by Smart Investing & Trading Score). One can sort SmallCap stocks (click link to choose) by Daily, Weekly and by Year-to-Date performances. Also, one can sort by size of the company or by market capitalization. |
| Select Your Default Chart Type: | |||||
| |||||
| Click on stock symbol or name for detailed view. Click on to add stock symbol to your watchlist and to view watchlist. Quick View: Move mouse or cursor over "Daily" to quickly view daily technical stock chart and over "Weekly" to view weekly technical stock chart. | |||||

 | COOP Mr. Cooper Group Inc. |
| Sector: Financials | |
| SubSector: Savings & Loans | |
| MarketCap: 648.33 Millions | |
| Recent Price: 84.22 Smart Investing & Trading Score: 100 | |
| Day Percent Change: 1.34% Day Change: 1.11 | |
| Week Change: 0.53% Year-to-date Change: 29.3% | |
| COOP Links: Profile News Message Board | |
| Charts:- Daily , Weekly | |
| Add COOP to Watchlist: View: Get Complete COOP Trend Analysis ➞ | |
 | DTC Solo Brands, Inc. |
| Sector: Services & Goods | |
| SubSector: Internet Retail | |
| MarketCap: 525 Millions | |
| Recent Price: 2.04 Smart Investing & Trading Score: 57 | |
| Day Percent Change: 2.00% Day Change: 0.04 | |
| Week Change: 0.49% Year-to-date Change: -67.1% | |
| DTC Links: Profile News Message Board | |
| Charts:- Daily , Weekly | |
| Add DTC to Watchlist: View: Get Complete DTC Trend Analysis ➞ | |
 | UCTT Ultra Clean Holdings, Inc. |
| Sector: Technology | |
| SubSector: Semiconductor Equipment & Materials | |
| MarketCap: 528.518 Millions | |
| Recent Price: 44.37 Smart Investing & Trading Score: 90 | |
| Day Percent Change: -1.94% Day Change: -0.88 | |
| Week Change: 0.48% Year-to-date Change: 30.0% | |
| UCTT Links: Profile News Message Board | |
| Charts:- Daily , Weekly | |
| Add UCTT to Watchlist: View: Get Complete UCTT Trend Analysis ➞ | |
 | TROX Tronox Holdings plc |
| Sector: Materials | |
| SubSector: Chemicals - Major Diversified | |
| MarketCap: 807 Millions | |
| Recent Price: 19.20 Smart Investing & Trading Score: 71 | |
| Day Percent Change: -1.54% Day Change: -0.30 | |
| Week Change: 0.47% Year-to-date Change: 35.6% | |
| TROX Links: Profile News Message Board | |
| Charts:- Daily , Weekly | |
| Add TROX to Watchlist: View: Get Complete TROX Trend Analysis ➞ | |
 | SBSI Southside Bancshares, Inc. |
| Sector: Financials | |
| SubSector: Regional - Mid-Atlantic Banks | |
| MarketCap: 971.259 Millions | |
| Recent Price: 28.09 Smart Investing & Trading Score: 62 | |
| Day Percent Change: 0.25% Day Change: 0.07 | |
| Week Change: 0.43% Year-to-date Change: -10.3% | |
| SBSI Links: Profile News Message Board | |
| Charts:- Daily , Weekly | |
| Add SBSI to Watchlist: View: Get Complete SBSI Trend Analysis ➞ | |
 | PLUS ePlus inc. |
| Sector: Technology | |
| SubSector: Application Software | |
| MarketCap: 728.262 Millions | |
| Recent Price: 80.19 Smart Investing & Trading Score: 54 | |
| Day Percent Change: 0.07% Day Change: 0.06 | |
| Week Change: 0.41% Year-to-date Change: 0.4% | |
| PLUS Links: Profile News Message Board | |
| Charts:- Daily , Weekly | |
| Add PLUS to Watchlist: View: Get Complete PLUS Trend Analysis ➞ | |
 | PRIM Primoris Services Corporation |
| Sector: Industrials | |
| SubSector: Heavy Construction | |
| MarketCap: 931.895 Millions | |
| Recent Price: 50.44 Smart Investing & Trading Score: 85 | |
| Day Percent Change: -1.62% Day Change: -0.83 | |
| Week Change: 0.4% Year-to-date Change: 51.9% | |
| PRIM Links: Profile News Message Board | |
| Charts:- Daily , Weekly | |
| Add PRIM to Watchlist: View: Get Complete PRIM Trend Analysis ➞ | |
 | AXNX Axonics Modulation Technologies, Inc. |
| Sector: Health Care | |
| SubSector: Medical Appliances & Equipment | |
| MarketCap: 692.48 Millions | |
| Recent Price: 67.67 Smart Investing & Trading Score: 58 | |
| Day Percent Change: -0.03% Day Change: -0.02 | |
| Week Change: 0.4% Year-to-date Change: 8.7% | |
| AXNX Links: Profile News Message Board | |
| Charts:- Daily , Weekly | |
| Add AXNX to Watchlist: View: Get Complete AXNX Trend Analysis ➞ | |
 | WIRE Encore Wire Corporation |
| Sector: Technology | |
| SubSector: Diversified Electronics | |
| MarketCap: 898.896 Millions | |
| Recent Price: 282.00 Smart Investing & Trading Score: 54 | |
| Day Percent Change: 0.00% Day Change: 0.00 | |
| Week Change: 0.39% Year-to-date Change: 32.0% | |
| WIRE Links: Profile News Message Board | |
| Charts:- Daily , Weekly | |
| Add WIRE to Watchlist: View: Get Complete WIRE Trend Analysis ➞ | |
 | CTS CTS Corporation |
| Sector: Technology | |
| SubSector: Diversified Electronics | |
| MarketCap: 645.896 Millions | |
| Recent Price: 51.78 Smart Investing & Trading Score: 83 | |
| Day Percent Change: -0.40% Day Change: -0.21 | |
| Week Change: 0.37% Year-to-date Change: 18.4% | |
| CTS Links: Profile News Message Board | |
| Charts:- Daily , Weekly | |
| Add CTS to Watchlist: View: Get Complete CTS Trend Analysis ➞ | |
 | CASH Meta Financial Group, Inc. |
| Sector: Financials | |
| SubSector: Savings & Loans | |
| MarketCap: 849.33 Millions | |
| Recent Price: 54.17 Smart Investing & Trading Score: 83 | |
| Day Percent Change: 0.30% Day Change: 0.16 | |
| Week Change: 0.37% Year-to-date Change: 2.3% | |
| CASH Links: Profile News Message Board | |
| Charts:- Daily , Weekly | |
| Add CASH to Watchlist: View: Get Complete CASH Trend Analysis ➞ | |
 | YORW The York Water Company |
| Sector: Utilities | |
| SubSector: Water Utilities | |
| MarketCap: 539.502 Millions | |
| Recent Price: 38.58 Smart Investing & Trading Score: 83 | |
| Day Percent Change: 0.34% Day Change: 0.13 | |
| Week Change: 0.34% Year-to-date Change: -0.1% | |
| YORW Links: Profile News Message Board | |
| Charts:- Daily , Weekly | |
| Add YORW to Watchlist: View: Get Complete YORW Trend Analysis ➞ | |
 | UTL Unitil Corporation |
| Sector: Utilities | |
| SubSector: Diversified Utilities | |
| MarketCap: 756.98 Millions | |
| Recent Price: 54.67 Smart Investing & Trading Score: 90 | |
| Day Percent Change: 0.61% Day Change: 0.33 | |
| Week Change: 0.33% Year-to-date Change: 4.0% | |
| UTL Links: Profile News Message Board | |
| Charts:- Daily , Weekly | |
| Add UTL to Watchlist: View: Get Complete UTL Trend Analysis ➞ | |
 | WINA Winmark Corporation |
| Sector: Services & Goods | |
| SubSector: Specialty Retail, Other | |
| MarketCap: 520.444 Millions | |
| Recent Price: 373.90 Smart Investing & Trading Score: 40 | |
| Day Percent Change: 0.37% Day Change: 1.39 | |
| Week Change: 0.32% Year-to-date Change: -10.5% | |
| WINA Links: Profile News Message Board | |
| Charts:- Daily , Weekly | |
| Add WINA to Watchlist: View: Get Complete WINA Trend Analysis ➞ | |
 | UPWK Upwork Inc. |
| Sector: Technology | |
| SubSector: Internet Information Providers | |
| MarketCap: 815.98 Millions | |
| Recent Price: 11.99 Smart Investing & Trading Score: 33 | |
| Day Percent Change: -2.28% Day Change: -0.28 | |
| Week Change: 0.29% Year-to-date Change: -19.4% | |
| UPWK Links: Profile News Message Board | |
| Charts:- Daily , Weekly | |
| Add UPWK to Watchlist: View: Get Complete UPWK Trend Analysis ➞ | |
 | ARDX Ardelyx, Inc. |
| Sector: Health Care | |
| SubSector: Biotechnology | |
| MarketCap: 541.985 Millions | |
| Recent Price: 7.79 Smart Investing & Trading Score: 32 | |
| Day Percent Change: -0.76% Day Change: -0.06 | |
| Week Change: 0.26% Year-to-date Change: 25.7% | |
| ARDX Links: Profile News Message Board | |
| Charts:- Daily , Weekly | |
| Add ARDX to Watchlist: View: Get Complete ARDX Trend Analysis ➞ | |
 | SKT Tanger Factory Outlet Centers, Inc. |
| Sector: Financials | |
| SubSector: REIT - Retail | |
| MarketCap: 720.214 Millions | |
| Recent Price: 27.89 Smart Investing & Trading Score: 25 | |
| Day Percent Change: -1.41% Day Change: -0.40 | |
| Week Change: 0.25% Year-to-date Change: 0.6% | |
| SKT Links: Profile News Message Board | |
| Charts:- Daily , Weekly | |
| Add SKT to Watchlist: View: Get Complete SKT Trend Analysis ➞ | |
 | CHCT Community Healthcare Trust Incorporated |
| Sector: Financials | |
| SubSector: REIT - Healthcare Facilities | |
| MarketCap: 698.614 Millions | |
| Recent Price: 24.05 Smart Investing & Trading Score: 28 | |
| Day Percent Change: 0.12% Day Change: 0.03 | |
| Week Change: 0.25% Year-to-date Change: -9.7% | |
| CHCT Links: Profile News Message Board | |
| Charts:- Daily , Weekly | |
| Add CHCT to Watchlist: View: Get Complete CHCT Trend Analysis ➞ | |
 | BUSE First Busey Corporation |
| Sector: Financials | |
| SubSector: Regional - Midwest Banks | |
| MarketCap: 876.97 Millions | |
| Recent Price: 23.85 Smart Investing & Trading Score: 90 | |
| Day Percent Change: 0.00% Day Change: 0.00 | |
| Week Change: 0.21% Year-to-date Change: -3.9% | |
| BUSE Links: Profile News Message Board | |
| Charts:- Daily , Weekly | |
| Add BUSE to Watchlist: View: Get Complete BUSE Trend Analysis ➞ | |
 | OFLX Omega Flex, Inc. |
| Sector: Industrials | |
| SubSector: Industrial Equipment & Components | |
| MarketCap: 590.609 Millions | |
| Recent Price: 67.14 Smart Investing & Trading Score: 53 | |
| Day Percent Change: 0.27% Day Change: 0.18 | |
| Week Change: 0.21% Year-to-date Change: -4.8% | |
| OFLX Links: Profile News Message Board | |
| Charts:- Daily , Weekly | |
| Add OFLX to Watchlist: View: Get Complete OFLX Trend Analysis ➞ | |
 | HURN Huron Consulting Group Inc. |
| Sector: Services & Goods | |
| SubSector: Management Services | |
| MarketCap: 968.645 Millions | |
| Recent Price: 87.72 Smart Investing & Trading Score: 35 | |
| Day Percent Change: 1.29% Day Change: 1.12 | |
| Week Change: 0.18% Year-to-date Change: -14.7% | |
| HURN Links: Profile News Message Board | |
| Charts:- Daily , Weekly | |
| Add HURN to Watchlist: View: Get Complete HURN Trend Analysis ➞ | |
 | CADE Cadence Bancorporation |
| Sector: Financials | |
| SubSector: Regional - Southeast Banks | |
| MarketCap: 756.335 Millions | |
| Recent Price: 29.29 Smart Investing & Trading Score: 83 | |
| Day Percent Change: -1.51% Day Change: -0.45 | |
| Week Change: 0.17% Year-to-date Change: -1.0% | |
| CADE Links: Profile News Message Board | |
| Charts:- Daily , Weekly | |
| Add CADE to Watchlist: View: Get Complete CADE Trend Analysis ➞ | |
 | OFG OFG Bancorp |
| Sector: Financials | |
| SubSector: Money Center Banks | |
| MarketCap: 537.599 Millions | |
| Recent Price: 37.91 Smart Investing & Trading Score: 78 | |
| Day Percent Change: -0.60% Day Change: -0.23 | |
| Week Change: 0.16% Year-to-date Change: 1.2% | |
| OFG Links: Profile News Message Board | |
| Charts:- Daily , Weekly | |
| Add OFG to Watchlist: View: Get Complete OFG Trend Analysis ➞ | |
 | PLOW Douglas Dynamics, Inc. |
| Sector: Consumer Staples | |
| SubSector: Auto Parts | |
| MarketCap: 654.739 Millions | |
| Recent Price: 25.37 Smart Investing & Trading Score: 76 | |
| Day Percent Change: -0.63% Day Change: -0.16 | |
| Week Change: 0.16% Year-to-date Change: -14.5% | |
| PLOW Links: Profile News Message Board | |
| Charts:- Daily , Weekly | |
| Add PLOW to Watchlist: View: Get Complete PLOW Trend Analysis ➞ | |
 | NWLI National Western Life Group, Inc. |
| Sector: Financials | |
| SubSector: Life Insurance | |
| MarketCap: 529 Millions | |
| Recent Price: 491.23 Smart Investing & Trading Score: 70 | |
| Day Percent Change: -0.01% Day Change: -0.06 | |
| Week Change: 0.12% Year-to-date Change: 1.7% | |
| NWLI Links: Profile News Message Board | |
| Charts:- Daily , Weekly | |
| Add NWLI to Watchlist: View: Get Complete NWLI Trend Analysis ➞ | |
| For tabular summary view of above stock list: Summary View ➞ 0 - 25 , 25 - 50 , 50 - 75 , 75 - 100 , 100 - 125 , 125 - 150 , 150 - 175 , 175 - 200 , 200 - 225 , 225 - 250 , 250 - 275 , 275 - 300 , 300 - 325 , 325 - 350 | ||
| Click To Change The Sort Order: By Market Cap or Company Size Performance: Year-to-date, Week and Day | |
| Select Chart Type: | ||
| Too many stocks? View smallcap stocks filtered by marketcap & sector |
| Marketcap: All SmallCap Stocks (default-no microcap), Large, Mid-Range, Small & MicroCap |
| Sector: Tech, Finance, Energy, Staples, Retail, Industrial, Materials, Utilities & Medical |
|
Best Stocks Today 12Stocks.com |
© 2024 12Stocks.com Terms & Conditions Privacy Contact Us
All Information Provided Only For Education And Not To Be Used For Investing or Trading. See Terms & Conditions


One More Thing ... Get Best Stocks Delivered Daily!
Never Ever Miss A Move With Our Top Ten Stocks Lists
Find Best Stocks In Any Market - Bull or Bear Market
Take A Peek At Our Top Ten Stocks Lists: Daily, Weekly, Year-to-Date & Top Trends
Find Best Stocks In Any Market - Bull or Bear Market
Take A Peek At Our Top Ten Stocks Lists: Daily, Weekly, Year-to-Date & Top Trends
Smallcap Stocks With Best Up Trends [0-bearish to 100-bullish]: Trupanion [100], Zura Bio[100], SilverBow Resources[100], Novavax [100], Third Harmonic[100], Hawkins [100], BRP Group[100], Kura Sushi[100], Aurinia [100], Heron [100], Cadiz [100]
Best Smallcap Stocks Year-to-Date:
CareMax [471.13%], Bakkt [370.4%], Janux [342.16%], Viking [304.73%], Alpine Immune[241.18%], Longboard [235.68%], Super Micro[218.16%], Avidity Biosciences[217.7%], Novavax [200%], Arcutis Bio[182.35%], Sweetgreen [181.24%] Best Smallcap Stocks This Week:
Novavax [62.16%], MacroGenics [54.68%], Maxeon Solar[49.31%], SunPower [43.04%], Harrow Health[39.31%], Workhorse Group[39.06%], Humacyte [36.6%], ProKidney [34.88%], Allbirds [33.47%], Cadiz [28.76%], Fossil Group[28.72%] Best Smallcap Stocks Daily:
Maxeon Solar[26.56%], Allakos [22.36%], Ventyx Biosciences[18.85%], Trupanion [15.85%], Zura Bio[15.61%], Beyond Air[15.42%], SilverBow Resources[13.20%], Children s[13.09%], Comtech Tele[12.92%], Aceto [12.14%], Novavax [11.63%]