
 Login Sign Up


| |||||
 |  | ||||

| 12Stocks.com Market Intelligence |
Best SmallCap Stocks
|
| In a hurry? Small Cap Stock Lists: Performance Trends Table, Stock Charts
Sort Small Cap stocks: Daily, Weekly, Year-to-Date, Market Cap & Trends. Filter Small Cap stocks list by sector: Show all, Tech, Finance, Energy, Staples, Retail, Industrial, Materials, Utilities and HealthCare Filter Small Cap stocks list by size: All Large Medium Small and MicroCap |
| 12Stocks.com Small Cap Stocks Performances & Trends Daily | |||||||||
|
|  The overall Smart Investing & Trading Score is 87 (0-bearish to 100-bullish) which puts Small Cap index in short term bullish trend. The Smart Investing & Trading Score from previous trading session is 82 and hence an improvement of trend.
| ||||||||
Here are the Smart Investing & Trading Scores of the most requested small cap stocks at 12Stocks.com (click stock name for detailed review):
|


| 12Stocks.com: Investing in Smallcap Index with Stocks | |
|
The following table helps investors and traders sort through current performance and trends (as measured by Smart Investing & Trading Score) of various
stocks in the Smallcap Index. Quick View: Move mouse or cursor over stock symbol (ticker) to view short-term technical chart and over stock name to view long term chart. Click on  to add stock symbol to your watchlist and to add stock symbol to your watchlist and  to view watchlist. Click on any ticker or stock name for detailed market intelligence report for that stock. to view watchlist. Click on any ticker or stock name for detailed market intelligence report for that stock. |
12Stocks.com Performance of Stocks in Smallcap Index
| Ticker | Stock Name | Watchlist | Category | Recent Price | Smart Investing & Trading Score | Change % | YTD Change% |
| FEAM | 5E Advanced |   | Materials | 1.38 | 69 | -4.83% | -2.13% |
| PMT | PennyMac Mortgage | | Financials | 14.63 | 78 | -1.35% | -2.14% |
| NBN | Northeast Bank | | Financials | 54.00 | 51 | -1.87% | -2.16% |
| MBWM | Mercantile Bank | | Financials | 39.50 | 100 | 0.30% | -2.18% |
| NTST | NetSTREIT | | Financials | 17.47 | 100 | 0.52% | -2.18% |
| PDM | Piedmont Office | | Financials | 6.95 | 83 | -1.14% | -2.25% |
| PLAY | Dave & Buster s Entertainment | | Services & Goods | 52.59 | 25 | -2.16% | -2.34% |
| PHR | Phreesia | | Technology | 22.60 | 67 | -0.35% | -2.38% |
| PJT | PJT Partners | | Financials | 99.43 | 59 | 0.07% | -2.40% |
| BATRA | Liberty Braves | | Services & Goods | 41.75 | 70 | 0.70% | -2.41% |
| ANDE | Andersons | | Consumer Staples | 56.14 | 44 | -0.67% | -2.43% |
| HOMB | Home Bancshares | | Financials | 24.70 | 90 | -0.76% | -2.49% |
| HCKT | Hackett Group | | Technology | 22.20 | 49 | -0.49% | -2.50% |
| ABG | Asbury Automotive | | Services & Goods | 219.30 | 95 | -1.04% | -2.52% |
| VMD | Viemed Healthcare | | Health Care | 7.65 | 0 | -6.82% | -2.55% |
| ARCB | ArcBest | | Transports | 117.10 | 32 | -0.75% | -2.59% |
| GPI | Group 1 | | Services & Goods | 296.74 | 73 | -1.20% | -2.63% |
| TPIC | TPI Composites | | Industrials | 4.03 | 100 | 1.00% | -2.66% |
| MD | MEDNAX | | Health Care | 9.05 | 32 | -2.48% | -2.69% |
| FUL | H.B. Fuller | | Materials | 79.20 | 87 | 0.96% | -2.71% |
| OB | Outbrain | | Services & Goods | 4.26 | 63 | -2.52% | -2.74% |
| IBCP | Independent Bank | | Financials | 25.30 | 80 | 0.20% | -2.77% |
| DX | Dynex Capital | | Financials | 12.17 | 69 | -0.49% | -2.80% |
| PRTH | Priority | | Industrials | 3.46 | 100 | 6.79% | -2.81% |
| CAKE | Cheesecake Factory | | Services & Goods | 34.02 | 23 | -1.76% | -2.83% |


| Too many stocks? View smallcap stocks filtered by marketcap & sector |
| Marketcap: All SmallCap Stocks (default-no microcap), Large, Mid-Range, Small |
| Smallcap Sector: Tech, Finance, Energy, Staples, Retail, Industrial, Materials, & Medical |
|
Get the most comprehensive stock market coverage daily at 12Stocks.com ➞ Best Stocks Today ➞ Best Stocks Weekly ➞ Best Stocks Year-to-Date ➞ Best Stocks Trends ➞  Best Stocks Today 12Stocks.com Best Nasdaq Stocks ➞ Best S&P 500 Stocks ➞ Best Tech Stocks ➞ Best Biotech Stocks ➞ |
| Detailed Overview of SmallCap Stocks |
| SmallCap Technical Overview, Leaders & Laggards, Top SmallCap ETF Funds & Detailed SmallCap Stocks List, Charts, Trends & More |
| Smallcap: Technical Analysis, Trends & YTD Performance | |
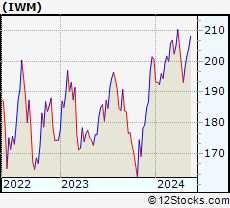
| SmallCap segment as represented by
IWM, an exchange-traded fund [ETF], holds basket of thousands of smallcap stocks from across all major sectors of the US stock market. The smallcap index (contains stocks like Riverbed & Sotheby's) is up by 2.12% and is currently underperforming the overall market by -6% year-to-date. Below is a quick view of technical charts and trends: | |
 IWM Weekly Chart |
|
| Long Term Trend: Very Good | |
| Medium Term Trend: Very Good | |
 IWM Daily Chart |
|
| Short Term Trend: Very Good | |
| Overall Trend Score: 87 | |
| YTD Performance: 2.12% | |
| **Trend Scores & Views Are Only For Educational Purposes And Not For Investing | |
| 12Stocks.com: Top Performing Small Cap Index Stocks | ||||||||||||||||||||||||||||||||||||||||||||||||
 The top performing Small Cap Index stocks year to date are
Now, more recently, over last week, the top performing Small Cap Index stocks on the move are


|
||||||||||||||||||||||||||||||||||||||||||||||||
| 12Stocks.com: Investing in Smallcap Index using Exchange Traded Funds | |
|
The following table shows list of key exchange traded funds (ETF) that
help investors track Smallcap index. The following list also includes leveraged ETF funds that track twice or thrice the daily returns of Smallcap indices. Short or inverse ETF funds move in the opposite direction to the index they track and are useful during market pullbacks or during bear markets. Quick View: Move mouse or cursor over ETF symbol (ticker) to view short-term technical chart and over ETF name to view long term chart. Click on ticker or stock name for detailed view. Click on to add stock symbol to your watchlist and to view watchlist. |
12Stocks.com List of ETFs that track Smallcap Index
| Ticker | ETF Name | Watchlist | Recent Price | Smart Investing & Trading Score | Change % | Week % | Year-to-date % |
| IWM | iShares Russell 2000 | | 204.97 | 87 | 0.22 | 1.52 | 2.12% |
| IJR | iShares Core S&P Small-Cap | | 108.62 | 100 | 0.33 | 1.39 | 0.34% |
| VTWO | Vanguard Russell 2000 ETF | | 82.84 | 82 | 0.22 | 1.51 | 2.15% |
| IWN | iShares Russell 2000 Value | | 155.63 | 100 | -0.01 | 0.92 | 0.19% |
| IWO | iShares Russell 2000 Growth | | 262.30 | 82 | 0.49 | 2.11 | 4% |
| IJS | iShares S&P Small-Cap 600 Value | | 99.68 | 69 | -0.07 | 0.97 | -3.29% |
| IJT | iShares S&P Small-Cap 600 Growth | | 129.84 | 95 | 0.56 | 1.63 | 3.76% |
| XSLV | PowerShares S&P SmallCap Low Volatil ETF | | 44.00 | 100 | 0.96 | 1.8 | -0.34% |
| SAA | ProShares Ultra SmallCap600 | | 24.39 | 95 | 1.16 | 3.39 | -2.24% |
| SMLV | SPDR SSGA US Small Cap Low Volatil ETF | | 110.48 | 100 | -0.10 | 0.72 | -1.81% |
| SBB | ProShares Short SmallCap600 | | 15.97 | 0 | -0.50 | -1.18 | 0.25% |
| SDD | ProShares UltraShort SmallCap600 | | 18.22 | 10 | -1.10 | -3.33 | -1.13% |
| 12Stocks.com: Charts, Trends, Fundamental Data and Performances of SmallCap Stocks | |
|
We now take in-depth look at all SmallCap stocks including charts, multi-period performances and overall trends (as measured by Smart Investing & Trading Score). One can sort SmallCap stocks (click link to choose) by Daily, Weekly and by Year-to-Date performances. Also, one can sort by size of the company or by market capitalization. |
| Select Your Default Chart Type: | |||||
| |||||
| Click on stock symbol or name for detailed view. Click on to add stock symbol to your watchlist and to view watchlist. Quick View: Move mouse or cursor over "Daily" to quickly view daily technical stock chart and over "Weekly" to view weekly technical stock chart. | |||||

 | FEAM 5E Advanced Materials Inc. |
| Sector: Materials | |
| SubSector: Specialty Chemicals | |
| MarketCap: 247 Millions | |
| Recent Price: 1.38 Smart Investing & Trading Score: 69 | |
| Day Percent Change: -4.83% Day Change: -0.07 | |
| Week Change: 8.66% Year-to-date Change: -2.1% | |
| FEAM Links: Profile News Message Board | |
| Charts:- Daily , Weekly | |
| Add FEAM to Watchlist: View: Get Complete FEAM Trend Analysis ➞ | |
 | PMT PennyMac Mortgage Investment Trust |
| Sector: Financials | |
| SubSector: Mortgage Investment | |
| MarketCap: 917.639 Millions | |
| Recent Price: 14.63 Smart Investing & Trading Score: 78 | |
| Day Percent Change: -1.35% Day Change: -0.20 | |
| Week Change: -0.48% Year-to-date Change: -2.1% | |
| PMT Links: Profile News Message Board | |
| Charts:- Daily , Weekly | |
| Add PMT to Watchlist: View: Get Complete PMT Trend Analysis ➞ | |
 | NBN Northeast Bank |
| Sector: Financials | |
| SubSector: Regional - Northeast Banks | |
| MarketCap: 114.199 Millions | |
| Recent Price: 54.00 Smart Investing & Trading Score: 51 | |
| Day Percent Change: -1.87% Day Change: -1.03 | |
| Week Change: -1.78% Year-to-date Change: -2.2% | |
| NBN Links: Profile News Message Board | |
| Charts:- Daily , Weekly | |
| Add NBN to Watchlist: View: Get Complete NBN Trend Analysis ➞ | |
 | MBWM Mercantile Bank Corporation |
| Sector: Financials | |
| SubSector: Regional - Midwest Banks | |
| MarketCap: 372.77 Millions | |
| Recent Price: 39.50 Smart Investing & Trading Score: 100 | |
| Day Percent Change: 0.30% Day Change: 0.12 | |
| Week Change: 2.68% Year-to-date Change: -2.2% | |
| MBWM Links: Profile News Message Board | |
| Charts:- Daily , Weekly | |
| Add MBWM to Watchlist: View: Get Complete MBWM Trend Analysis ➞ | |
 | NTST NetSTREIT Corp. |
| Sector: Financials | |
| SubSector: REIT Retail | |
| MarketCap: 51267 Millions | |
| Recent Price: 17.47 Smart Investing & Trading Score: 100 | |
| Day Percent Change: 0.52% Day Change: 0.09 | |
| Week Change: 0.63% Year-to-date Change: -2.2% | |
| NTST Links: Profile News Message Board | |
| Charts:- Daily , Weekly | |
| Add NTST to Watchlist: View: Get Complete NTST Trend Analysis ➞ | |
 | PDM Piedmont Office Realty Trust, Inc. |
| Sector: Financials | |
| SubSector: REIT - Office | |
| MarketCap: 2097.46 Millions | |
| Recent Price: 6.95 Smart Investing & Trading Score: 83 | |
| Day Percent Change: -1.14% Day Change: -0.08 | |
| Week Change: 0.58% Year-to-date Change: -2.3% | |
| PDM Links: Profile News Message Board | |
| Charts:- Daily , Weekly | |
| Add PDM to Watchlist: View: Get Complete PDM Trend Analysis ➞ | |
 | PLAY Dave & Buster s Entertainment, Inc. |
| Sector: Services & Goods | |
| SubSector: Restaurants | |
| MarketCap: 283.07 Millions | |
| Recent Price: 52.59 Smart Investing & Trading Score: 25 | |
| Day Percent Change: -2.16% Day Change: -1.16 | |
| Week Change: -0.44% Year-to-date Change: -2.3% | |
| PLAY Links: Profile News Message Board | |
| Charts:- Daily , Weekly | |
| Add PLAY to Watchlist: View: Get Complete PLAY Trend Analysis ➞ | |
 | PHR Phreesia, Inc. |
| Sector: Technology | |
| SubSector: Healthcare Information Services | |
| MarketCap: 810.255 Millions | |
| Recent Price: 22.60 Smart Investing & Trading Score: 67 | |
| Day Percent Change: -0.35% Day Change: -0.08 | |
| Week Change: 1.25% Year-to-date Change: -2.4% | |
| PHR Links: Profile News Message Board | |
| Charts:- Daily , Weekly | |
| Add PHR to Watchlist: View: Get Complete PHR Trend Analysis ➞ | |
 | PJT PJT Partners Inc. |
| Sector: Financials | |
| SubSector: Asset Management | |
| MarketCap: 1100.93 Millions | |
| Recent Price: 99.43 Smart Investing & Trading Score: 59 | |
| Day Percent Change: 0.07% Day Change: 0.07 | |
| Week Change: -0.1% Year-to-date Change: -2.4% | |
| PJT Links: Profile News Message Board | |
| Charts:- Daily , Weekly | |
| Add PJT to Watchlist: View: Get Complete PJT Trend Analysis ➞ | |
 | BATRA The Liberty Braves Group |
| Sector: Services & Goods | |
| SubSector: Broadcasting - TV | |
| MarketCap: 18873.5 Millions | |
| Recent Price: 41.75 Smart Investing & Trading Score: 70 | |
| Day Percent Change: 0.70% Day Change: 0.29 | |
| Week Change: -0.05% Year-to-date Change: -2.4% | |
| BATRA Links: Profile News Message Board | |
| Charts:- Daily , Weekly | |
| Add BATRA to Watchlist: View: Get Complete BATRA Trend Analysis ➞ | |
 | ANDE The Andersons, Inc. |
| Sector: Consumer Staples | |
| SubSector: Farm Products | |
| MarketCap: 630.887 Millions | |
| Recent Price: 56.14 Smart Investing & Trading Score: 44 | |
| Day Percent Change: -0.67% Day Change: -0.38 | |
| Week Change: -0.65% Year-to-date Change: -2.4% | |
| ANDE Links: Profile News Message Board | |
| Charts:- Daily , Weekly | |
| Add ANDE to Watchlist: View: Get Complete ANDE Trend Analysis ➞ | |
 | HOMB Home Bancshares, Inc. (Conway, AR) |
| Sector: Financials | |
| SubSector: Money Center Banks | |
| MarketCap: 2090.49 Millions | |
| Recent Price: 24.70 Smart Investing & Trading Score: 90 | |
| Day Percent Change: -0.76% Day Change: -0.19 | |
| Week Change: 0.32% Year-to-date Change: -2.5% | |
| HOMB Links: Profile News Message Board | |
| Charts:- Daily , Weekly | |
| Add HOMB to Watchlist: View: Get Complete HOMB Trend Analysis ➞ | |
 | HCKT The Hackett Group, Inc. |
| Sector: Technology | |
| SubSector: Information Technology Services | |
| MarketCap: 334.468 Millions | |
| Recent Price: 22.20 Smart Investing & Trading Score: 49 | |
| Day Percent Change: -0.49% Day Change: -0.11 | |
| Week Change: 0.27% Year-to-date Change: -2.5% | |
| HCKT Links: Profile News Message Board | |
| Charts:- Daily , Weekly | |
| Add HCKT to Watchlist: View: Get Complete HCKT Trend Analysis ➞ | |
 | ABG Asbury Automotive Group, Inc. |
| Sector: Services & Goods | |
| SubSector: Auto Dealerships | |
| MarketCap: 1203.21 Millions | |
| Recent Price: 219.30 Smart Investing & Trading Score: 95 | |
| Day Percent Change: -1.04% Day Change: -2.30 | |
| Week Change: 2.6% Year-to-date Change: -2.5% | |
| ABG Links: Profile News Message Board | |
| Charts:- Daily , Weekly | |
| Add ABG to Watchlist: View: Get Complete ABG Trend Analysis ➞ | |
 | VMD Viemed Healthcare, Inc. |
| Sector: Health Care | |
| SubSector: Medical Appliances & Equipment | |
| MarketCap: 177.28 Millions | |
| Recent Price: 7.65 Smart Investing & Trading Score: 0 | |
| Day Percent Change: -6.82% Day Change: -0.56 | |
| Week Change: -6.48% Year-to-date Change: -2.6% | |
| VMD Links: Profile News Message Board | |
| Charts:- Daily , Weekly | |
| Add VMD to Watchlist: View: Get Complete VMD Trend Analysis ➞ | |
 | ARCB ArcBest Corporation |
| Sector: Transports | |
| SubSector: Trucking | |
| MarketCap: 515.415 Millions | |
| Recent Price: 117.10 Smart Investing & Trading Score: 32 | |
| Day Percent Change: -0.75% Day Change: -0.89 | |
| Week Change: 1.96% Year-to-date Change: -2.6% | |
| ARCB Links: Profile News Message Board | |
| Charts:- Daily , Weekly | |
| Add ARCB to Watchlist: View: Get Complete ARCB Trend Analysis ➞ | |
 | GPI Group 1 Automotive, Inc. |
| Sector: Services & Goods | |
| SubSector: Auto Dealerships | |
| MarketCap: 921.021 Millions | |
| Recent Price: 296.74 Smart Investing & Trading Score: 73 | |
| Day Percent Change: -1.20% Day Change: -3.60 | |
| Week Change: 0.58% Year-to-date Change: -2.6% | |
| GPI Links: Profile News Message Board | |
| Charts:- Daily , Weekly | |
| Add GPI to Watchlist: View: Get Complete GPI Trend Analysis ➞ | |
 | TPIC TPI Composites, Inc. |
| Sector: Industrials | |
| SubSector: Diversified Machinery | |
| MarketCap: 451.016 Millions | |
| Recent Price: 4.03 Smart Investing & Trading Score: 100 | |
| Day Percent Change: 1.00% Day Change: 0.04 | |
| Week Change: 7.75% Year-to-date Change: -2.7% | |
| TPIC Links: Profile News Message Board | |
| Charts:- Daily , Weekly | |
| Add TPIC to Watchlist: View: Get Complete TPIC Trend Analysis ➞ | |
 | MD MEDNAX, Inc. |
| Sector: Health Care | |
| SubSector: Specialized Health Services | |
| MarketCap: 913.656 Millions | |
| Recent Price: 9.05 Smart Investing & Trading Score: 32 | |
| Day Percent Change: -2.48% Day Change: -0.23 | |
| Week Change: -3% Year-to-date Change: -2.7% | |
| MD Links: Profile News Message Board | |
| Charts:- Daily , Weekly | |
| Add MD to Watchlist: View: Get Complete MD Trend Analysis ➞ | |
 | FUL H.B. Fuller Company |
| Sector: Materials | |
| SubSector: Specialty Chemicals | |
| MarketCap: 1655.67 Millions | |
| Recent Price: 79.20 Smart Investing & Trading Score: 87 | |
| Day Percent Change: 0.96% Day Change: 0.75 | |
| Week Change: 2.95% Year-to-date Change: -2.7% | |
| FUL Links: Profile News Message Board | |
| Charts:- Daily , Weekly | |
| Add FUL to Watchlist: View: Get Complete FUL Trend Analysis ➞ | |
 | OB Outbrain Inc. |
| Sector: Services & Goods | |
| SubSector: Internet Content & Information | |
| MarketCap: 250 Millions | |
| Recent Price: 4.26 Smart Investing & Trading Score: 63 | |
| Day Percent Change: -2.52% Day Change: -0.11 | |
| Week Change: -3.4% Year-to-date Change: -2.7% | |
| OB Links: Profile News Message Board | |
| Charts:- Daily , Weekly | |
| Add OB to Watchlist: View: Get Complete OB Trend Analysis ➞ | |
 | IBCP Independent Bank Corporation |
| Sector: Financials | |
| SubSector: Regional - Midwest Banks | |
| MarketCap: 273.67 Millions | |
| Recent Price: 25.30 Smart Investing & Trading Score: 80 | |
| Day Percent Change: 0.20% Day Change: 0.05 | |
| Week Change: 0.4% Year-to-date Change: -2.8% | |
| IBCP Links: Profile News Message Board | |
| Charts:- Daily , Weekly | |
| Add IBCP to Watchlist: View: Get Complete IBCP Trend Analysis ➞ | |
 | DX Dynex Capital, Inc. |
| Sector: Financials | |
| SubSector: Mortgage Investment | |
| MarketCap: 327.839 Millions | |
| Recent Price: 12.17 Smart Investing & Trading Score: 69 | |
| Day Percent Change: -0.49% Day Change: -0.06 | |
| Week Change: 0.75% Year-to-date Change: -2.8% | |
| DX Links: Profile News Message Board | |
| Charts:- Daily , Weekly | |
| Add DX to Watchlist: View: Get Complete DX Trend Analysis ➞ | |
 | PRTH Priority Technology Holdings, Inc. |
| Sector: Industrials | |
| SubSector: Conglomerates | |
| MarketCap: 116.548 Millions | |
| Recent Price: 3.46 Smart Investing & Trading Score: 100 | |
| Day Percent Change: 6.79% Day Change: 0.22 | |
| Week Change: 8.46% Year-to-date Change: -2.8% | |
| PRTH Links: Profile News Message Board | |
| Charts:- Daily , Weekly | |
| Add PRTH to Watchlist: View: Get Complete PRTH Trend Analysis ➞ | |
 | CAKE The Cheesecake Factory Incorporated |
| Sector: Services & Goods | |
| SubSector: Restaurants | |
| MarketCap: 829 Millions | |
| Recent Price: 34.02 Smart Investing & Trading Score: 23 | |
| Day Percent Change: -1.76% Day Change: -0.61 | |
| Week Change: 1.04% Year-to-date Change: -2.8% | |
| CAKE Links: Profile News Message Board | |
| Charts:- Daily , Weekly | |
| Add CAKE to Watchlist: View: Get Complete CAKE Trend Analysis ➞ | |
| Too many stocks? View smallcap stocks filtered by marketcap & sector |
| Marketcap: All SmallCap Stocks (default-no microcap), Large, Mid-Range, Small & MicroCap |
| Sector: Tech, Finance, Energy, Staples, Retail, Industrial, Materials, Utilities & Medical |
|
Best Stocks Today 12Stocks.com |
© 2024 12Stocks.com Terms & Conditions Privacy Contact Us
All Information Provided Only For Education And Not To Be Used For Investing or Trading. See Terms & Conditions


One More Thing ... Get Best Stocks Delivered Daily!
Never Ever Miss A Move With Our Top Ten Stocks Lists
Find Best Stocks In Any Market - Bull or Bear Market
Take A Peek At Our Top Ten Stocks Lists: Daily, Weekly, Year-to-Date & Top Trends
Find Best Stocks In Any Market - Bull or Bear Market
Take A Peek At Our Top Ten Stocks Lists: Daily, Weekly, Year-to-Date & Top Trends
Smallcap Stocks With Best Up Trends [0-bearish to 100-bullish]: Design [100], Ambac Financial[100], Summit [100], EverQuote [100], Zeta Global[100], Coca-Cola Consolidated[100], J & J Snack Foods[100], Sterling Construction[100], Vanda [100], CPI Card[100], Semrush [100]
Best Smallcap Stocks Year-to-Date:
CareMax [570.1%], Janux [472.36%], Viking [327.78%], Longboard [260.8%], Alpine Immune[239.34%], Bakkt [226.91%], Vera [190.7%], Super Micro[188.22%], Cullinan Oncology[187.89%], Avidity Biosciences[180.86%], Y-mAbs [152.49%] Best Smallcap Stocks This Week:
Perficient [52.32%], Thoughtworks Holding[34.22%], Trupanion [28.72%], DASAN Zhone[26.29%], Great Lakes[25.72%], Workhorse Group[24.5%], Design [23.42%], Ambac Financial[22.97%], P3 Health[22.36%], Outset Medical[21.09%], Summit [20.96%] Best Smallcap Stocks Daily:
Design [28.85%], Great Lakes[24.29%], Thoughtworks Holding[19.84%], Ambac Financial[19.31%], Summit [18.79%], EverQuote [18.40%], Origin Materials[18.38%], Zeta Global[18.35%], FibroGen [18.10%], Coca-Cola Consolidated[17.65%], Children s[16.44%]