
 Login Sign Up


| |||||
 |  | ||||

| 12Stocks.com Market Intelligence |
Best SmallCap Stocks
|
| In a hurry? Small Cap Stock Lists: Performance Trends Table, Stock Charts
Sort Small Cap stocks: Daily, Weekly, Year-to-Date, Market Cap & Trends. Filter Small Cap stocks list by sector: Show all, Tech, Finance, Energy, Staples, Retail, Industrial, Materials, Utilities and HealthCare Filter Small Cap stocks list by size: All Large Medium Small and MicroCap |
| 12Stocks.com Small Cap Stocks Performances & Trends Daily | |||||||||
|
|  The overall Smart Investing & Trading Score is 13 (0-bearish to 100-bullish) which puts Small Cap index in short term bearish trend. The Smart Investing & Trading Score from previous trading session is 26 and hence a deterioration of trend.
| ||||||||
Here are the Smart Investing & Trading Scores of the most requested small cap stocks at 12Stocks.com (click stock name for detailed review):
|


| 12Stocks.com: Investing in Smallcap Index with Stocks | |
|
The following table helps investors and traders sort through current performance and trends (as measured by Smart Investing & Trading Score) of various
stocks in the Smallcap Index. Quick View: Move mouse or cursor over stock symbol (ticker) to view short-term technical chart and over stock name to view long term chart. Click on  to add stock symbol to your watchlist and to add stock symbol to your watchlist and  to view watchlist. Click on any ticker or stock name for detailed market intelligence report for that stock. to view watchlist. Click on any ticker or stock name for detailed market intelligence report for that stock. |
12Stocks.com Performance of Stocks in Smallcap Index
| Ticker | Stock Name | Watchlist | Category | Recent Price | Smart Investing & Trading Score | Change % | YTD Change% |
| MYE | Myers Industries |   | Consumer Staples | 20.97 | 43 | -2.28% | 7.26% |
| HGV | Hilton Grand | | Services & Goods | 43.06 | 43 | -0.37% | 7.17% |
| SENEA | Seneca Foods | | Consumer Staples | 56.18 | 63 | -1.04% | 7.13% |
| BECN | Beacon Roofing | | Industrials | 93.18 | 36 | -1.53% | 7.08% |
| ITCI | Intra-Cellular Therapies | | Health Care | 76.69 | 100 | -3.95% | 7.08% |
| GFF | Griffon | | Industrials | 65.26 | 26 | -1.89% | 7.07% |
| KRT | Karat Packaging | | Services & Goods | 26.67 | 26 | -0.74% | 7.07% |
| AIT | Applied Industrial | | Services & Goods | 184.40 | 26 | -1.85% | 6.78% |
| HCC | Warrior Met | | Materials | 65.05 | 85 | -4.65% | 6.69% |
| NHI | National Health | | Financials | 59.55 | 68 | 1.26% | 6.62% |
| CIVI | Civitas Solutions | | Health Care | 72.91 | 22 | -1.43% | 6.62% |
| BDC | Belden | | Industrials | 82.33 | 26 | -2.59% | 6.58% |
| ENVA | Enova | | Financials | 58.99 | 51 | 0.65% | 6.56% |
| NNI | Nelnet | | Financials | 94.00 | 63 | 0.89% | 6.55% |
| MWA | Mueller Water | | Industrials | 15.34 | 68 | -0.45% | 6.53% |
| BCC | Boise Cascade | | Industrials | 137.80 | 26 | -0.80% | 6.52% |
| GLRE | Greenlight Capital | | Financials | 12.16 | 46 | -1.22% | 6.48% |
| IIIV | i3 Verticals | | Technology | 22.54 | 43 | -0.18% | 6.47% |
| RSVR | Reservoir Media | | Services & Goods | 7.58 | 43 | 0.66% | 6.46% |
| OUT | Outfront Media | | Services & Goods | 14.86 | 43 | -1.78% | 6.45% |
| ATKR | Atkore | | Industrials | 170.12 | 41 | -1.18% | 6.32% |
| ALIT | Alight | | Technology | 9.04 | 36 | 0.00% | 6.23% |
| ORIC | ORIC | | Health Care | 9.79 | 25 | 3.60% | 6.18% |
| STRA | Strategic Education | | Services & Goods | 98.07 | 51 | 1.41% | 6.17% |
| MUR | Murphy Oil | | Energy | 45.28 | 36 | -1.46% | 6.14% |


| Too many stocks? View smallcap stocks filtered by marketcap & sector |
| Marketcap: All SmallCap Stocks (default-no microcap), Large, Mid-Range, Small |
| Smallcap Sector: Tech, Finance, Energy, Staples, Retail, Industrial, Materials, & Medical |
|
Get the most comprehensive stock market coverage daily at 12Stocks.com ➞ Best Stocks Today ➞ Best Stocks Weekly ➞ Best Stocks Year-to-Date ➞ Best Stocks Trends ➞  Best Stocks Today 12Stocks.com Best Nasdaq Stocks ➞ Best S&P 500 Stocks ➞ Best Tech Stocks ➞ Best Biotech Stocks ➞ |
| Detailed Overview of SmallCap Stocks |
| SmallCap Technical Overview, Leaders & Laggards, Top SmallCap ETF Funds & Detailed SmallCap Stocks List, Charts, Trends & More |
| Smallcap: Technical Analysis, Trends & YTD Performance | |
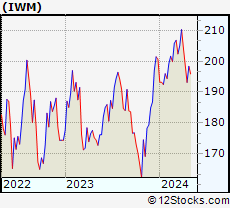
| SmallCap segment as represented by
IWM, an exchange-traded fund [ETF], holds basket of thousands of smallcap stocks from across all major sectors of the US stock market. The smallcap index (contains stocks like Riverbed & Sotheby's) is down by -3.84% and is currently underperforming the overall market by -8.25% year-to-date. Below is a quick view of technical charts and trends: | |
 IWM Weekly Chart |
|
| Long Term Trend: Good | |
| Medium Term Trend: Not Good | |
 IWM Daily Chart |
|
| Short Term Trend: Not Good | |
| Overall Trend Score: 13 | |
| YTD Performance: -3.84% | |
| **Trend Scores & Views Are Only For Educational Purposes And Not For Investing | |
| 12Stocks.com: Top Performing Small Cap Index Stocks | ||||||||||||||||||||||||||||||||||||||||||||||||
 The top performing Small Cap Index stocks year to date are
Now, more recently, over last week, the top performing Small Cap Index stocks on the move are


|
||||||||||||||||||||||||||||||||||||||||||||||||
| 12Stocks.com: Investing in Smallcap Index using Exchange Traded Funds | |
|
The following table shows list of key exchange traded funds (ETF) that
help investors track Smallcap index. The following list also includes leveraged ETF funds that track twice or thrice the daily returns of Smallcap indices. Short or inverse ETF funds move in the opposite direction to the index they track and are useful during market pullbacks or during bear markets. Quick View: Move mouse or cursor over ETF symbol (ticker) to view short-term technical chart and over ETF name to view long term chart. Click on ticker or stock name for detailed view. Click on to add stock symbol to your watchlist and to view watchlist. |
12Stocks.com List of ETFs that track Smallcap Index
| Ticker | ETF Name | Watchlist | Recent Price | Smart Investing & Trading Score | Change % | Week % | Year-to-date % |
| IWM | iShares Russell 2000 | | 193.00 | 13 | -1.06 | -2.86 | -3.84% |
| IJR | iShares Core S&P Small-Cap | | 102.13 | 7 | -0.58 | -2.28 | -5.65% |
| VTWO | Vanguard Russell 2000 ETF | | 78.05 | 13 | -1.04 | -2.83 | -3.76% |
| IWN | iShares Russell 2000 Value | | 146.03 | 0 | -0.77 | -2.89 | -5.99% |
| IWO | iShares Russell 2000 Growth | | 248.02 | 26 | -0.90 | -2.87 | -1.67% |
| IJS | iShares S&P Small-Cap 600 Value | | 94.12 | 7 | -0.57 | -2.13 | -8.68% |
| IJT | iShares S&P Small-Cap 600 Growth | | 121.84 | 13 | -1.02 | -2.36 | -2.64% |
| XSLV | PowerShares S&P SmallCap Low Volatil ETF | | 41.42 | 0 | -0.38 | -1.59 | -6.18% |
| SAA | ProShares Ultra SmallCap600 | | 21.66 | 0 | -1.19 | -3.99 | -13.19% |
| SMLV | SPDR SSGA US Small Cap Low Volatil ETF | | 103.66 | 10 | -0.17 | -1.29 | -7.87% |
| SBB | ProShares Short SmallCap600 | | 16.85 | 93 | 0.42 | 1.83 | 5.78% |
| SDD | ProShares UltraShort SmallCap600 | | 20.60 | 93 | 1.23 | 3.88 | 11.8% |
| 12Stocks.com: Charts, Trends, Fundamental Data and Performances of SmallCap Stocks | |
|
We now take in-depth look at all SmallCap stocks including charts, multi-period performances and overall trends (as measured by Smart Investing & Trading Score). One can sort SmallCap stocks (click link to choose) by Daily, Weekly and by Year-to-Date performances. Also, one can sort by size of the company or by market capitalization. |
| Select Your Default Chart Type: | |||||
| |||||
| Click on stock symbol or name for detailed view. Click on to add stock symbol to your watchlist and to view watchlist. Quick View: Move mouse or cursor over "Daily" to quickly view daily technical stock chart and over "Weekly" to view weekly technical stock chart. | |||||

 | MYE Myers Industries, Inc. |
| Sector: Consumer Staples | |
| SubSector: Rubber & Plastics | |
| MarketCap: 347.57 Millions | |
| Recent Price: 20.97 Smart Investing & Trading Score: 43 | |
| Day Percent Change: -2.28% Day Change: -0.49 | |
| Week Change: -3.54% Year-to-date Change: 7.3% | |
| MYE Links: Profile News Message Board | |
| Charts:- Daily , Weekly | |
| Add MYE to Watchlist: View: Get Complete MYE Trend Analysis ➞ | |
 | HGV Hilton Grand Vacations Inc. |
| Sector: Services & Goods | |
| SubSector: Resorts & Casinos | |
| MarketCap: 1333.04 Millions | |
| Recent Price: 43.06 Smart Investing & Trading Score: 43 | |
| Day Percent Change: -0.37% Day Change: -0.16 | |
| Week Change: -1.08% Year-to-date Change: 7.2% | |
| HGV Links: Profile News Message Board | |
| Charts:- Daily , Weekly | |
| Add HGV to Watchlist: View: Get Complete HGV Trend Analysis ➞ | |
 | SENEA Seneca Foods Corporation |
| Sector: Consumer Staples | |
| SubSector: Processed & Packaged Goods | |
| MarketCap: 326.348 Millions | |
| Recent Price: 56.18 Smart Investing & Trading Score: 63 | |
| Day Percent Change: -1.04% Day Change: -0.59 | |
| Week Change: 0.97% Year-to-date Change: 7.1% | |
| SENEA Links: Profile News Message Board | |
| Charts:- Daily , Weekly | |
| Add SENEA to Watchlist: View: Get Complete SENEA Trend Analysis ➞ | |
 | BECN Beacon Roofing Supply, Inc. |
| Sector: Industrials | |
| SubSector: General Building Materials | |
| MarketCap: 1210.13 Millions | |
| Recent Price: 93.18 Smart Investing & Trading Score: 36 | |
| Day Percent Change: -1.53% Day Change: -1.45 | |
| Week Change: -4.08% Year-to-date Change: 7.1% | |
| BECN Links: Profile News Message Board | |
| Charts:- Daily , Weekly | |
| Add BECN to Watchlist: View: Get Complete BECN Trend Analysis ➞ | |
 | ITCI Intra-Cellular Therapies, Inc. |
| Sector: Health Care | |
| SubSector: Biotechnology | |
| MarketCap: 991.885 Millions | |
| Recent Price: 76.69 Smart Investing & Trading Score: 100 | |
| Day Percent Change: -3.95% Day Change: -3.15 | |
| Week Change: 16.41% Year-to-date Change: 7.1% | |
| ITCI Links: Profile News Message Board | |
| Charts:- Daily , Weekly | |
| Add ITCI to Watchlist: View: Get Complete ITCI Trend Analysis ➞ | |
 | GFF Griffon Corporation |
| Sector: Industrials | |
| SubSector: General Building Materials | |
| MarketCap: 616 Millions | |
| Recent Price: 65.26 Smart Investing & Trading Score: 26 | |
| Day Percent Change: -1.89% Day Change: -1.26 | |
| Week Change: -3.45% Year-to-date Change: 7.1% | |
| GFF Links: Profile News Message Board | |
| Charts:- Daily , Weekly | |
| Add GFF to Watchlist: View: Get Complete GFF Trend Analysis ➞ | |
 | KRT Karat Packaging Inc. |
| Sector: Services & Goods | |
| SubSector: Packaging & Containers | |
| MarketCap: 357 Millions | |
| Recent Price: 26.67 Smart Investing & Trading Score: 26 | |
| Day Percent Change: -0.74% Day Change: -0.20 | |
| Week Change: -3.82% Year-to-date Change: 7.1% | |
| KRT Links: Profile News Message Board | |
| Charts:- Daily , Weekly | |
| Add KRT to Watchlist: View: Get Complete KRT Trend Analysis ➞ | |
 | AIT Applied Industrial Technologies, Inc. |
| Sector: Services & Goods | |
| SubSector: Industrial Equipment Wholesale | |
| MarketCap: 1531.58 Millions | |
| Recent Price: 184.40 Smart Investing & Trading Score: 26 | |
| Day Percent Change: -1.85% Day Change: -3.48 | |
| Week Change: -3.5% Year-to-date Change: 6.8% | |
| AIT Links: Profile News Message Board | |
| Charts:- Daily , Weekly | |
| Add AIT to Watchlist: View: Get Complete AIT Trend Analysis ➞ | |
 | HCC Warrior Met Coal, Inc. |
| Sector: Materials | |
| SubSector: Industrial Metals & Minerals | |
| MarketCap: 748.81 Millions | |
| Recent Price: 65.05 Smart Investing & Trading Score: 85 | |
| Day Percent Change: -4.65% Day Change: -3.17 | |
| Week Change: 4.06% Year-to-date Change: 6.7% | |
| HCC Links: Profile News Message Board | |
| Charts:- Daily , Weekly | |
| Add HCC to Watchlist: View: Get Complete HCC Trend Analysis ➞ | |
 | NHI National Health Investors, Inc. |
| Sector: Financials | |
| SubSector: REIT - Healthcare Facilities | |
| MarketCap: 2156.54 Millions | |
| Recent Price: 59.55 Smart Investing & Trading Score: 68 | |
| Day Percent Change: 1.26% Day Change: 0.74 | |
| Week Change: 1.93% Year-to-date Change: 6.6% | |
| NHI Links: Profile News Message Board | |
| Charts:- Daily , Weekly | |
| Add NHI to Watchlist: View: Get Complete NHI Trend Analysis ➞ | |
 | CIVI Civitas Solutions, Inc. |
| Sector: Health Care | |
| SubSector: Long-Term Care Facilities | |
| MarketCap: 625.74 Millions | |
| Recent Price: 72.91 Smart Investing & Trading Score: 22 | |
| Day Percent Change: -1.43% Day Change: -1.06 | |
| Week Change: -1.82% Year-to-date Change: 6.6% | |
| CIVI Links: Profile News Message Board | |
| Charts:- Daily , Weekly | |
| Add CIVI to Watchlist: View: Get Complete CIVI Trend Analysis ➞ | |
 | BDC Belden Inc. |
| Sector: Industrials | |
| SubSector: Industrial Electrical Equipment | |
| MarketCap: 1490.59 Millions | |
| Recent Price: 82.33 Smart Investing & Trading Score: 26 | |
| Day Percent Change: -2.59% Day Change: -2.19 | |
| Week Change: -3.44% Year-to-date Change: 6.6% | |
| BDC Links: Profile News Message Board | |
| Charts:- Daily , Weekly | |
| Add BDC to Watchlist: View: Get Complete BDC Trend Analysis ➞ | |
 | ENVA Enova International, Inc. |
| Sector: Financials | |
| SubSector: Credit Services | |
| MarketCap: 345.508 Millions | |
| Recent Price: 58.99 Smart Investing & Trading Score: 51 | |
| Day Percent Change: 0.65% Day Change: 0.38 | |
| Week Change: -0.64% Year-to-date Change: 6.6% | |
| ENVA Links: Profile News Message Board | |
| Charts:- Daily , Weekly | |
| Add ENVA to Watchlist: View: Get Complete ENVA Trend Analysis ➞ | |
 | NNI Nelnet, Inc. |
| Sector: Financials | |
| SubSector: Credit Services | |
| MarketCap: 1664.38 Millions | |
| Recent Price: 94.00 Smart Investing & Trading Score: 63 | |
| Day Percent Change: 0.89% Day Change: 0.83 | |
| Week Change: -0.58% Year-to-date Change: 6.6% | |
| NNI Links: Profile News Message Board | |
| Charts:- Daily , Weekly | |
| Add NNI to Watchlist: View: Get Complete NNI Trend Analysis ➞ | |
 | MWA Mueller Water Products, Inc. |
| Sector: Industrials | |
| SubSector: Industrial Equipment & Components | |
| MarketCap: 1321.09 Millions | |
| Recent Price: 15.34 Smart Investing & Trading Score: 68 | |
| Day Percent Change: -0.45% Day Change: -0.07 | |
| Week Change: 1.12% Year-to-date Change: 6.5% | |
| MWA Links: Profile News Message Board | |
| Charts:- Daily , Weekly | |
| Add MWA to Watchlist: View: Get Complete MWA Trend Analysis ➞ | |
 | BCC Boise Cascade Company |
| Sector: Industrials | |
| SubSector: Lumber, Wood Production | |
| MarketCap: 963.938 Millions | |
| Recent Price: 137.80 Smart Investing & Trading Score: 26 | |
| Day Percent Change: -0.80% Day Change: -1.11 | |
| Week Change: -8.13% Year-to-date Change: 6.5% | |
| BCC Links: Profile News Message Board | |
| Charts:- Daily , Weekly | |
| Add BCC to Watchlist: View: Get Complete BCC Trend Analysis ➞ | |
 | GLRE Greenlight Capital Re, Ltd. |
| Sector: Financials | |
| SubSector: Accident & Health Insurance | |
| MarketCap: 228.66 Millions | |
| Recent Price: 12.16 Smart Investing & Trading Score: 46 | |
| Day Percent Change: -1.22% Day Change: -0.15 | |
| Week Change: 0.41% Year-to-date Change: 6.5% | |
| GLRE Links: Profile News Message Board | |
| Charts:- Daily , Weekly | |
| Add GLRE to Watchlist: View: Get Complete GLRE Trend Analysis ➞ | |
 | IIIV i3 Verticals, Inc. |
| Sector: Technology | |
| SubSector: Business Software & Services | |
| MarketCap: 448.458 Millions | |
| Recent Price: 22.54 Smart Investing & Trading Score: 43 | |
| Day Percent Change: -0.18% Day Change: -0.04 | |
| Week Change: -1.91% Year-to-date Change: 6.5% | |
| IIIV Links: Profile News Message Board | |
| Charts:- Daily , Weekly | |
| Add IIIV to Watchlist: View: Get Complete IIIV Trend Analysis ➞ | |
 | RSVR Reservoir Media, Inc. |
| Sector: Services & Goods | |
| SubSector: Entertainment | |
| MarketCap: 389 Millions | |
| Recent Price: 7.58 Smart Investing & Trading Score: 43 | |
| Day Percent Change: 0.66% Day Change: 0.05 | |
| Week Change: -2.45% Year-to-date Change: 6.5% | |
| RSVR Links: Profile News Message Board | |
| Charts:- Daily , Weekly | |
| Add RSVR to Watchlist: View: Get Complete RSVR Trend Analysis ➞ | |
 | OUT Outfront Media Inc. |
| Sector: Services & Goods | |
| SubSector: Marketing Services | |
| MarketCap: 1388.15 Millions | |
| Recent Price: 14.86 Smart Investing & Trading Score: 43 | |
| Day Percent Change: -1.78% Day Change: -0.27 | |
| Week Change: -4.93% Year-to-date Change: 6.5% | |
| OUT Links: Profile News Message Board | |
| Charts:- Daily , Weekly | |
| Add OUT to Watchlist: View: Get Complete OUT Trend Analysis ➞ | |
 | ATKR Atkore International Group Inc. |
| Sector: Industrials | |
| SubSector: Industrial Electrical Equipment | |
| MarketCap: 1086.79 Millions | |
| Recent Price: 170.12 Smart Investing & Trading Score: 41 | |
| Day Percent Change: -1.18% Day Change: -2.03 | |
| Week Change: -0.85% Year-to-date Change: 6.3% | |
| ATKR Links: Profile News Message Board | |
| Charts:- Daily , Weekly | |
| Add ATKR to Watchlist: View: Get Complete ATKR Trend Analysis ➞ | |
 | ALIT Alight, Inc. |
| Sector: Technology | |
| SubSector: Software - Application | |
| MarketCap: 5130 Millions | |
| Recent Price: 9.04 Smart Investing & Trading Score: 36 | |
| Day Percent Change: 0.00% Day Change: 0.00 | |
| Week Change: -1.95% Year-to-date Change: 6.2% | |
| ALIT Links: Profile News Message Board | |
| Charts:- Daily , Weekly | |
| Add ALIT to Watchlist: View: Get Complete ALIT Trend Analysis ➞ | |
 | ORIC ORIC Pharmaceuticals, Inc. |
| Sector: Health Care | |
| SubSector: Biotechnology | |
| MarketCap: 12787 Millions | |
| Recent Price: 9.79 Smart Investing & Trading Score: 25 | |
| Day Percent Change: 3.60% Day Change: 0.34 | |
| Week Change: -0.1% Year-to-date Change: 6.2% | |
| ORIC Links: Profile News Message Board | |
| Charts:- Daily , Weekly | |
| Add ORIC to Watchlist: View: Get Complete ORIC Trend Analysis ➞ | |
 | STRA Strategic Education, Inc. |
| Sector: Services & Goods | |
| SubSector: Education & Training Services | |
| MarketCap: 2621.56 Millions | |
| Recent Price: 98.07 Smart Investing & Trading Score: 51 | |
| Day Percent Change: 1.41% Day Change: 1.36 | |
| Week Change: -0.39% Year-to-date Change: 6.2% | |
| STRA Links: Profile News Message Board | |
| Charts:- Daily , Weekly | |
| Add STRA to Watchlist: View: Get Complete STRA Trend Analysis ➞ | |
 | MUR Murphy Oil Corporation |
| Sector: Energy | |
| SubSector: Independent Oil & Gas | |
| MarketCap: 985.993 Millions | |
| Recent Price: 45.28 Smart Investing & Trading Score: 36 | |
| Day Percent Change: -1.46% Day Change: -0.67 | |
| Week Change: -3.74% Year-to-date Change: 6.1% | |
| MUR Links: Profile News Message Board | |
| Charts:- Daily , Weekly | |
| Add MUR to Watchlist: View: Get Complete MUR Trend Analysis ➞ | |
| Too many stocks? View smallcap stocks filtered by marketcap & sector |
| Marketcap: All SmallCap Stocks (default-no microcap), Large, Mid-Range, Small & MicroCap |
| Sector: Tech, Finance, Energy, Staples, Retail, Industrial, Materials, Utilities & Medical |
|
Best Stocks Today 12Stocks.com |
© 2024 12Stocks.com Terms & Conditions Privacy Contact Us
All Information Provided Only For Education And Not To Be Used For Investing or Trading. See Terms & Conditions


One More Thing ... Get Best Stocks Delivered Daily!
Never Ever Miss A Move With Our Top Ten Stocks Lists
Find Best Stocks In Any Market - Bull or Bear Market
Take A Peek At Our Top Ten Stocks Lists: Daily, Weekly, Year-to-Date & Top Trends
Find Best Stocks In Any Market - Bull or Bear Market
Take A Peek At Our Top Ten Stocks Lists: Daily, Weekly, Year-to-Date & Top Trends
Smallcap Stocks With Best Up Trends [0-bearish to 100-bullish]: Vanda [100], Zuora [100], ALX Oncology[100], ProKidney [100], PrimeEnergy Resources[100], IMAX [100], Envestnet [100], Intra-Cellular Therapies[100], Dorian LPG[95], Victory Capital[95], Oscar Health[95]
Best Smallcap Stocks Year-to-Date:
Agenus [552.25%], CareMax [416.49%], Janux [346.07%], Viking [257.17%], Alpine Immune[238.55%], Super Micro[237.75%], Arcutis Bio[217.34%], Longboard [177.91%], Avidity Biosciences[160.56%], Vera [158.46%], Stoke [122.81%] Best Smallcap Stocks This Week:
ProKidney [61.71%], Macatawa Bank[42.75%], Snap One[29.85%], Vanda [27.18%], ALX Oncology[23.41%], Intra-Cellular Therapies[16.41%], Escalade [13.71%], Karyopharm [13.11%], Encore Wire[10.06%], Zuora [10%], Direxion Daily[8.81%] Best Smallcap Stocks Daily:
Vanda [29.38%], Karyopharm [25.45%], Cutera [18.41%], Children s[16.46%], WW [14.10%], Lineage Cell[12.17%], Zuora [11.69%], ALX Oncology[10.97%], Marinus [10.77%], Acrivon [9.19%], Cue Biopharma[9.03%]