
 Login Sign Up


| |||||
 |  | ||||

| 12Stocks.com Market Intelligence |
Best SmallCap Stocks
|
| In a hurry? Small Cap Stock Lists: Performance Trends Table, Stock Charts
Sort Small Cap stocks: Daily, Weekly, Year-to-Date, Market Cap & Trends. Filter Small Cap stocks list by sector: Show all, Tech, Finance, Energy, Staples, Retail, Industrial, Materials, Utilities and HealthCare Filter Small Cap stocks list by size: All Large Medium Small and MicroCap |
| 12Stocks.com Small Cap Stocks Performances & Trends Daily | |||||||||
|
|  The overall Smart Investing & Trading Score is 44 (0-bearish to 100-bullish) which puts Small Cap index in short term neutral trend. The Smart Investing & Trading Score from previous trading session is 58 and hence a deterioration of trend.
| ||||||||
Here are the Smart Investing & Trading Scores of the most requested small cap stocks at 12Stocks.com (click stock name for detailed review):
|


| 12Stocks.com: Investing in Smallcap Index with Stocks | |
|
The following table helps investors and traders sort through current performance and trends (as measured by Smart Investing & Trading Score) of various
stocks in the Smallcap Index. Quick View: Move mouse or cursor over stock symbol (ticker) to view short-term technical chart and over stock name to view long term chart. Click on  to add stock symbol to your watchlist and to add stock symbol to your watchlist and  to view watchlist. Click on any ticker or stock name for detailed market intelligence report for that stock. to view watchlist. Click on any ticker or stock name for detailed market intelligence report for that stock. |
12Stocks.com Performance of Stocks in Smallcap Index
| Ticker | Stock Name | Watchlist | Category | Recent Price | Smart Investing & Trading Score | Change % | YTD Change% |
| PRDO | Perdoceo Education |   | Services & Goods | 18.63 | 77 | 1.11% | 6.06% |
| PFBC | Preferred Bank | | Financials | 77.47 | 93 | 0.75% | 6.05% |
| SKWD | Skyward Specialty | | Financials | 35.96 | 56 | -0.72% | 5.92% |
| PSMT | PriceSmart | | Services & Goods | 80.17 | 53 | -0.91% | 5.79% |
| EOLS | Evolus | | Health Care | 11.14 | 18 | -3.13% | 5.79% |
| SCSC | ScanSource | | Technology | 41.90 | 93 | -2.26% | 5.78% |
| LMND | Lemonade | | Financials | 17.06 | 83 | -2.01% | 5.77% |
| OXM | Oxford Industries | | Consumer Staples | 105.75 | 83 | -1.40% | 5.75% |
| FCFS | FirstCash | | Financials | 114.61 | 71 | -13.19% | 5.74% |
| CVCO | Cavco Industries | | Industrials | 366.41 | 63 | -0.02% | 5.71% |
| LICY | Li-Cycle | | Industrials | 0.66 | 54 | -1.54% | 5.67% |
| HAYN | Haynes | | Industrials | 60.28 | 61 | -0.13% | 5.66% |
| CMCO | Columbus McKinnon | | Industrials | 41.21 | 56 | -1.32% | 5.61% |
| DORM | Dorman Products | | Consumer Staples | 88.08 | 61 | -1.93% | 5.60% |
| TPB | Turning Point | | Consumer Staples | 27.78 | 83 | -1.24% | 5.55% |
| SXT | Sensient | | Materials | 69.64 | 88 | -0.56% | 5.52% |
| CPF | Central Pacific | | Financials | 20.76 | 100 | 4.06% | 5.49% |
| TMHC | Taylor Morrison | | Industrials | 56.28 | 58 | -0.12% | 5.49% |
| DBI | Designer Brands | | Services & Goods | 9.33 | 68 | -1.17% | 5.42% |
| LAUR | Laureate Education | | Services & Goods | 14.45 | 48 | 0.91% | 5.40% |
| BOX | Box | | Technology | 26.98 | 76 | -1.10% | 5.35% |
| ATRI | Atrion | | Health Care | 398.97 | 68 | -5.95% | 5.33% |
| VRRM | Verra Mobility | | Services & Goods | 24.25 | 49 | -0.14% | 5.28% |
| REZI | Resideo | | Services & Goods | 19.80 | 36 | -0.05% | 5.21% |
| BHR | Braemar Hotels | | Financials | 2.63 | 93 | -4.36% | 5.20% |


| Too many stocks? View smallcap stocks filtered by marketcap & sector |
| Marketcap: All SmallCap Stocks (default-no microcap), Large, Mid-Range, Small |
| Smallcap Sector: Tech, Finance, Energy, Staples, Retail, Industrial, Materials, & Medical |
|
Get the most comprehensive stock market coverage daily at 12Stocks.com ➞ Best Stocks Today ➞ Best Stocks Weekly ➞ Best Stocks Year-to-Date ➞ Best Stocks Trends ➞  Best Stocks Today 12Stocks.com Best Nasdaq Stocks ➞ Best S&P 500 Stocks ➞ Best Tech Stocks ➞ Best Biotech Stocks ➞ |
| Detailed Overview of SmallCap Stocks |
| SmallCap Technical Overview, Leaders & Laggards, Top SmallCap ETF Funds & Detailed SmallCap Stocks List, Charts, Trends & More |
| Smallcap: Technical Analysis, Trends & YTD Performance | |
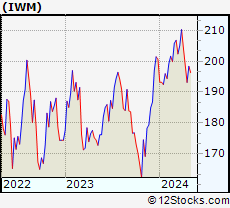
| SmallCap segment as represented by
IWM, an exchange-traded fund [ETF], holds basket of thousands of smallcap stocks from across all major sectors of the US stock market. The smallcap index (contains stocks like Riverbed & Sotheby's) is down by -2.11% and is currently underperforming the overall market by -7.27% year-to-date. Below is a quick view of technical charts and trends: | |
 IWM Weekly Chart |
|
| Long Term Trend: Good | |
| Medium Term Trend: Not Good | |
 IWM Daily Chart |
|
| Short Term Trend: Very Good | |
| Overall Trend Score: 44 | |
| YTD Performance: -2.11% | |
| **Trend Scores & Views Are Only For Educational Purposes And Not For Investing | |
| 12Stocks.com: Top Performing Small Cap Index Stocks | ||||||||||||||||||||||||||||||||||||||||||||||||
 The top performing Small Cap Index stocks year to date are
Now, more recently, over last week, the top performing Small Cap Index stocks on the move are


|
||||||||||||||||||||||||||||||||||||||||||||||||
| 12Stocks.com: Investing in Smallcap Index using Exchange Traded Funds | |
|
The following table shows list of key exchange traded funds (ETF) that
help investors track Smallcap index. The following list also includes leveraged ETF funds that track twice or thrice the daily returns of Smallcap indices. Short or inverse ETF funds move in the opposite direction to the index they track and are useful during market pullbacks or during bear markets. Quick View: Move mouse or cursor over ETF symbol (ticker) to view short-term technical chart and over ETF name to view long term chart. Click on ticker or stock name for detailed view. Click on to add stock symbol to your watchlist and to view watchlist. |
12Stocks.com List of ETFs that track Smallcap Index
| Ticker | ETF Name | Watchlist | Recent Price | Smart Investing & Trading Score | Change % | Week % | Year-to-date % |
| IWM | iShares Russell 2000 | | 196.48 | 44 | -0.61 | 1.73 | -2.11% |
| IJR | iShares Core S&P Small-Cap | | 104.86 | 78 | -0.80 | 1.59 | -3.13% |
| VTWO | Vanguard Russell 2000 ETF | | 79.45 | 63 | -0.60 | 1.75 | -2.03% |
| IWN | iShares Russell 2000 Value | | 150.18 | 68 | -0.73 | 1.62 | -3.32% |
| IWO | iShares Russell 2000 Growth | | 249.86 | 51 | -0.56 | 1.86 | -0.94% |
| IJS | iShares S&P Small-Cap 600 Value | | 96.69 | 60 | -1.04 | 1.13 | -6.19% |
| IJT | iShares S&P Small-Cap 600 Growth | | 125.06 | 63 | -0.25 | 2.33 | -0.06% |
| XSLV | PowerShares S&P SmallCap Low Volatil ETF | | 42.54 | 73 | -0.93 | 0.85 | -3.65% |
| SDD | ProShares UltraShort SmallCap600 | | 19.58 | 42 | 0.46 | -3.74 | 6.26% |
| SBB | ProShares Short SmallCap600 | | 16.50 | 40 | 0.79 | -2.02 | 3.58% |
| SMLV | SPDR SSGA US Small Cap Low Volatil ETF | | 107.33 | 73 | -1.01 | 1.17 | -4.61% |
| SAA | ProShares Ultra SmallCap600 | | 22.66 | 58 | -1.52 | 3.94 | -9.18% |
| 12Stocks.com: Charts, Trends, Fundamental Data and Performances of SmallCap Stocks | |
|
We now take in-depth look at all SmallCap stocks including charts, multi-period performances and overall trends (as measured by Smart Investing & Trading Score). One can sort SmallCap stocks (click link to choose) by Daily, Weekly and by Year-to-Date performances. Also, one can sort by size of the company or by market capitalization. |
| Select Your Default Chart Type: | |||||
| |||||
| Click on stock symbol or name for detailed view. Click on to add stock symbol to your watchlist and to view watchlist. Quick View: Move mouse or cursor over "Daily" to quickly view daily technical stock chart and over "Weekly" to view weekly technical stock chart. | |||||

 | PRDO Perdoceo Education Corporation |
| Sector: Services & Goods | |
| SubSector: Education & Training Services | |
| MarketCap: 631.006 Millions | |
| Recent Price: 18.63 Smart Investing & Trading Score: 77 | |
| Day Percent Change: 1.11% Day Change: 0.20 | |
| Week Change: 7.53% Year-to-date Change: 6.1% | |
| PRDO Links: Profile News Message Board | |
| Charts:- Daily , Weekly | |
| Add PRDO to Watchlist: View: Get Complete PRDO Trend Analysis ➞ | |
 | PFBC Preferred Bank |
| Sector: Financials | |
| SubSector: Regional - Pacific Banks | |
| MarketCap: 559.629 Millions | |
| Recent Price: 77.47 Smart Investing & Trading Score: 93 | |
| Day Percent Change: 0.75% Day Change: 0.58 | |
| Week Change: 4.27% Year-to-date Change: 6.1% | |
| PFBC Links: Profile News Message Board | |
| Charts:- Daily , Weekly | |
| Add PFBC to Watchlist: View: Get Complete PFBC Trend Analysis ➞ | |
 | SKWD Skyward Specialty Insurance Group, Inc. |
| Sector: Financials | |
| SubSector: Insurance - Property & Casualty | |
| MarketCap: 936 Millions | |
| Recent Price: 35.96 Smart Investing & Trading Score: 56 | |
| Day Percent Change: -0.72% Day Change: -0.26 | |
| Week Change: -0.77% Year-to-date Change: 5.9% | |
| SKWD Links: Profile News Message Board | |
| Charts:- Daily , Weekly | |
| Add SKWD to Watchlist: View: Get Complete SKWD Trend Analysis ➞ | |
 | PSMT PriceSmart, Inc. |
| Sector: Services & Goods | |
| SubSector: Discount, Variety Stores | |
| MarketCap: 1655.72 Millions | |
| Recent Price: 80.17 Smart Investing & Trading Score: 53 | |
| Day Percent Change: -0.91% Day Change: -0.74 | |
| Week Change: -3.23% Year-to-date Change: 5.8% | |
| PSMT Links: Profile News Message Board | |
| Charts:- Daily , Weekly | |
| Add PSMT to Watchlist: View: Get Complete PSMT Trend Analysis ➞ | |
 | EOLS Evolus, Inc. |
| Sector: Health Care | |
| SubSector: Drugs - Generic | |
| MarketCap: 145.885 Millions | |
| Recent Price: 11.14 Smart Investing & Trading Score: 18 | |
| Day Percent Change: -3.13% Day Change: -0.36 | |
| Week Change: -3.05% Year-to-date Change: 5.8% | |
| EOLS Links: Profile News Message Board | |
| Charts:- Daily , Weekly | |
| Add EOLS to Watchlist: View: Get Complete EOLS Trend Analysis ➞ | |
 | SCSC ScanSource, Inc. |
| Sector: Technology | |
| SubSector: Technical & System Software | |
| MarketCap: 541 Millions | |
| Recent Price: 41.90 Smart Investing & Trading Score: 93 | |
| Day Percent Change: -2.26% Day Change: -0.97 | |
| Week Change: 1.26% Year-to-date Change: 5.8% | |
| SCSC Links: Profile News Message Board | |
| Charts:- Daily , Weekly | |
| Add SCSC to Watchlist: View: Get Complete SCSC Trend Analysis ➞ | |
 | LMND Lemonade, Inc. |
| Sector: Financials | |
| SubSector: Insurance Property & Casualty | |
| MarketCap: 56457 Millions | |
| Recent Price: 17.06 Smart Investing & Trading Score: 83 | |
| Day Percent Change: -2.01% Day Change: -0.35 | |
| Week Change: 6.09% Year-to-date Change: 5.8% | |
| LMND Links: Profile News Message Board | |
| Charts:- Daily , Weekly | |
| Add LMND to Watchlist: View: Get Complete LMND Trend Analysis ➞ | |
 | OXM Oxford Industries, Inc. |
| Sector: Consumer Staples | |
| SubSector: Textile - Apparel Clothing | |
| MarketCap: 647.665 Millions | |
| Recent Price: 105.75 Smart Investing & Trading Score: 83 | |
| Day Percent Change: -1.40% Day Change: -1.50 | |
| Week Change: 0.98% Year-to-date Change: 5.8% | |
| OXM Links: Profile News Message Board | |
| Charts:- Daily , Weekly | |
| Add OXM to Watchlist: View: Get Complete OXM Trend Analysis ➞ | |
 | FCFS FirstCash, Inc. |
| Sector: Financials | |
| SubSector: Credit Services | |
| MarketCap: 2795.48 Millions | |
| Recent Price: 114.61 Smart Investing & Trading Score: 71 | |
| Day Percent Change: -13.19% Day Change: -17.42 | |
| Week Change: -12.12% Year-to-date Change: 5.7% | |
| FCFS Links: Profile News Message Board | |
| Charts:- Daily , Weekly | |
| Add FCFS to Watchlist: View: Get Complete FCFS Trend Analysis ➞ | |
 | CVCO Cavco Industries, Inc. |
| Sector: Industrials | |
| SubSector: Residential Construction | |
| MarketCap: 1375.86 Millions | |
| Recent Price: 366.41 Smart Investing & Trading Score: 63 | |
| Day Percent Change: -0.02% Day Change: -0.09 | |
| Week Change: 2.29% Year-to-date Change: 5.7% | |
| CVCO Links: Profile News Message Board | |
| Charts:- Daily , Weekly | |
| Add CVCO to Watchlist: View: Get Complete CVCO Trend Analysis ➞ | |
 | LICY Li-Cycle Holdings Corp. |
| Sector: Industrials | |
| SubSector: Waste Management | |
| MarketCap: 959 Millions | |
| Recent Price: 0.66 Smart Investing & Trading Score: 54 | |
| Day Percent Change: -1.54% Day Change: -0.01 | |
| Week Change: -1.48% Year-to-date Change: 5.7% | |
| LICY Links: Profile News Message Board | |
| Charts:- Daily , Weekly | |
| Add LICY to Watchlist: View: Get Complete LICY Trend Analysis ➞ | |
 | HAYN Haynes International, Inc. |
| Sector: Industrials | |
| SubSector: Metal Fabrication | |
| MarketCap: 245.75 Millions | |
| Recent Price: 60.28 Smart Investing & Trading Score: 61 | |
| Day Percent Change: -0.13% Day Change: -0.08 | |
| Week Change: 0.05% Year-to-date Change: 5.7% | |
| HAYN Links: Profile News Message Board | |
| Charts:- Daily , Weekly | |
| Add HAYN to Watchlist: View: Get Complete HAYN Trend Analysis ➞ | |
 | CMCO Columbus McKinnon Corporation |
| Sector: Industrials | |
| SubSector: Farm & Construction Machinery | |
| MarketCap: 598.807 Millions | |
| Recent Price: 41.21 Smart Investing & Trading Score: 56 | |
| Day Percent Change: -1.32% Day Change: -0.55 | |
| Week Change: 0.59% Year-to-date Change: 5.6% | |
| CMCO Links: Profile News Message Board | |
| Charts:- Daily , Weekly | |
| Add CMCO to Watchlist: View: Get Complete CMCO Trend Analysis ➞ | |
 | DORM Dorman Products, Inc. |
| Sector: Consumer Staples | |
| SubSector: Auto Parts | |
| MarketCap: 2028.79 Millions | |
| Recent Price: 88.08 Smart Investing & Trading Score: 61 | |
| Day Percent Change: -1.93% Day Change: -1.73 | |
| Week Change: -0.36% Year-to-date Change: 5.6% | |
| DORM Links: Profile News Message Board | |
| Charts:- Daily , Weekly | |
| Add DORM to Watchlist: View: Get Complete DORM Trend Analysis ➞ | |
 | TPB Turning Point Brands, Inc. |
| Sector: Consumer Staples | |
| SubSector: Tobacco Products, Other | |
| MarketCap: 381.97 Millions | |
| Recent Price: 27.78 Smart Investing & Trading Score: 83 | |
| Day Percent Change: -1.24% Day Change: -0.35 | |
| Week Change: 0.36% Year-to-date Change: 5.6% | |
| TPB Links: Profile News Message Board | |
| Charts:- Daily , Weekly | |
| Add TPB to Watchlist: View: Get Complete TPB Trend Analysis ➞ | |
 | SXT Sensient Technologies Corporation |
| Sector: Materials | |
| SubSector: Specialty Chemicals | |
| MarketCap: 1961.37 Millions | |
| Recent Price: 69.64 Smart Investing & Trading Score: 88 | |
| Day Percent Change: -0.56% Day Change: -0.39 | |
| Week Change: 0.72% Year-to-date Change: 5.5% | |
| SXT Links: Profile News Message Board | |
| Charts:- Daily , Weekly | |
| Add SXT to Watchlist: View: Get Complete SXT Trend Analysis ➞ | |
 | CPF Central Pacific Financial Corp. |
| Sector: Financials | |
| SubSector: Regional - Pacific Banks | |
| MarketCap: 407.429 Millions | |
| Recent Price: 20.76 Smart Investing & Trading Score: 100 | |
| Day Percent Change: 4.06% Day Change: 0.81 | |
| Week Change: 7.62% Year-to-date Change: 5.5% | |
| CPF Links: Profile News Message Board | |
| Charts:- Daily , Weekly | |
| Add CPF to Watchlist: View: Get Complete CPF Trend Analysis ➞ | |
 | TMHC Taylor Morrison Home Corporation |
| Sector: Industrials | |
| SubSector: Residential Construction | |
| MarketCap: 1336.76 Millions | |
| Recent Price: 56.28 Smart Investing & Trading Score: 58 | |
| Day Percent Change: -0.12% Day Change: -0.07 | |
| Week Change: 3.8% Year-to-date Change: 5.5% | |
| TMHC Links: Profile News Message Board | |
| Charts:- Daily , Weekly | |
| Add TMHC to Watchlist: View: Get Complete TMHC Trend Analysis ➞ | |
 | DBI Designer Brands Inc. |
| Sector: Services & Goods | |
| SubSector: Apparel Stores | |
| MarketCap: 467.308 Millions | |
| Recent Price: 9.33 Smart Investing & Trading Score: 68 | |
| Day Percent Change: -1.17% Day Change: -0.11 | |
| Week Change: 6.14% Year-to-date Change: 5.4% | |
| DBI Links: Profile News Message Board | |
| Charts:- Daily , Weekly | |
| Add DBI to Watchlist: View: Get Complete DBI Trend Analysis ➞ | |
 | LAUR Laureate Education, Inc. |
| Sector: Services & Goods | |
| SubSector: Education & Training Services | |
| MarketCap: 2258.56 Millions | |
| Recent Price: 14.45 Smart Investing & Trading Score: 48 | |
| Day Percent Change: 0.91% Day Change: 0.13 | |
| Week Change: 2.92% Year-to-date Change: 5.4% | |
| LAUR Links: Profile News Message Board | |
| Charts:- Daily , Weekly | |
| Add LAUR to Watchlist: View: Get Complete LAUR Trend Analysis ➞ | |
 | BOX Box, Inc. |
| Sector: Technology | |
| SubSector: Application Software | |
| MarketCap: 2154.42 Millions | |
| Recent Price: 26.98 Smart Investing & Trading Score: 76 | |
| Day Percent Change: -1.10% Day Change: -0.30 | |
| Week Change: 1.16% Year-to-date Change: 5.4% | |
| BOX Links: Profile News Message Board | |
| Charts:- Daily , Weekly | |
| Add BOX to Watchlist: View: Get Complete BOX Trend Analysis ➞ | |
 | ATRI Atrion Corporation |
| Sector: Health Care | |
| SubSector: Medical Instruments & Supplies | |
| MarketCap: 1234.6 Millions | |
| Recent Price: 398.97 Smart Investing & Trading Score: 68 | |
| Day Percent Change: -5.95% Day Change: -25.22 | |
| Week Change: -0.84% Year-to-date Change: 5.3% | |
| ATRI Links: Profile News Message Board | |
| Charts:- Daily , Weekly | |
| Add ATRI to Watchlist: View: Get Complete ATRI Trend Analysis ➞ | |
 | VRRM Verra Mobility Corporation |
| Sector: Services & Goods | |
| SubSector: Security & Protection Services | |
| MarketCap: 1265.03 Millions | |
| Recent Price: 24.25 Smart Investing & Trading Score: 49 | |
| Day Percent Change: -0.14% Day Change: -0.04 | |
| Week Change: 3.13% Year-to-date Change: 5.3% | |
| VRRM Links: Profile News Message Board | |
| Charts:- Daily , Weekly | |
| Add VRRM to Watchlist: View: Get Complete VRRM Trend Analysis ➞ | |
 | REZI Resideo Technologies, Inc. |
| Sector: Services & Goods | |
| SubSector: Security & Protection Services | |
| MarketCap: 712.603 Millions | |
| Recent Price: 19.80 Smart Investing & Trading Score: 36 | |
| Day Percent Change: -0.05% Day Change: -0.01 | |
| Week Change: 2.75% Year-to-date Change: 5.2% | |
| REZI Links: Profile News Message Board | |
| Charts:- Daily , Weekly | |
| Add REZI to Watchlist: View: Get Complete REZI Trend Analysis ➞ | |
 | BHR Braemar Hotels & Resorts, Inc. |
| Sector: Financials | |
| SubSector: REIT - Hotel/Motel | |
| MarketCap: 88.9434 Millions | |
| Recent Price: 2.63 Smart Investing & Trading Score: 93 | |
| Day Percent Change: -4.36% Day Change: -0.12 | |
| Week Change: 14.35% Year-to-date Change: 5.2% | |
| BHR Links: Profile News Message Board | |
| Charts:- Daily , Weekly | |
| Add BHR to Watchlist: View: Get Complete BHR Trend Analysis ➞ | |
| Too many stocks? View smallcap stocks filtered by marketcap & sector |
| Marketcap: All SmallCap Stocks (default-no microcap), Large, Mid-Range, Small & MicroCap |
| Sector: Tech, Finance, Energy, Staples, Retail, Industrial, Materials, Utilities & Medical |
|
Best Stocks Today 12Stocks.com |
© 2024 12Stocks.com Terms & Conditions Privacy Contact Us
All Information Provided Only For Education And Not To Be Used For Investing or Trading. See Terms & Conditions


One More Thing ... Get Best Stocks Delivered Daily!
Never Ever Miss A Move With Our Top Ten Stocks Lists
Find Best Stocks In Any Market - Bull or Bear Market
Take A Peek At Our Top Ten Stocks Lists: Daily, Weekly, Year-to-Date & Top Trends
Find Best Stocks In Any Market - Bull or Bear Market
Take A Peek At Our Top Ten Stocks Lists: Daily, Weekly, Year-to-Date & Top Trends
Smallcap Stocks With Best Up Trends [0-bearish to 100-bullish]: B. Riley[100], Central Pacific[100], California Water[100], Cricut [100], Carpenter [100], Haemonetics [100], Sanmina [100], Trustmark [100], Comstock Resources[100], EchoStar [100], Mueller Industries[100]
Best Smallcap Stocks Year-to-Date:
CareMax [490.72%], Janux [338.34%], Viking [270.02%], Alpine Immune[239.52%], Longboard [218%], Super Micro[177%], Arcutis Bio[166.56%], Avidity Biosciences[159.79%], Vera [149.94%], Hippo [128.87%], Stoke [122.15%] Best Smallcap Stocks This Week:
Matterport [168.97%], B. Riley[73.54%], Impinj [33.73%], ProKidney [32.84%], Seres [32.65%], Riot Blockchain[32.64%], Ribbon [25.58%], Cullinan Oncology[22.92%], P.A.M. Transportation[22.85%], NuScale Power[21.44%], Hibbett Sports[21.03%] Best Smallcap Stocks Daily:
Impinj [28.65%], P.A.M. Transportation[17.95%], B. Riley[16.61%], Strategic Education[16.28%], OptiNose [14.56%], JELD-WEN Holding[11.54%], Sonic Automotive[10.86%], Intevac [10.54%], SiTime [8.84%], Noodles & [8.08%], ProKidney [7.75%]