
 Login Sign Up


| |||||
 |  | ||||

| 12Stocks.com Market Intelligence |
Best SmallCap Stocks
|
| In a hurry? Small Cap Stock Lists: Performance Trends Table, Stock Charts
Sort Small Cap stocks: Daily, Weekly, Year-to-Date, Market Cap & Trends. Filter Small Cap stocks list by sector: Show all, Tech, Finance, Energy, Staples, Retail, Industrial, Materials, Utilities and HealthCare Filter Small Cap stocks list by size: All Large Medium Small and MicroCap |
| 12Stocks.com Small Cap Stocks Performances & Trends Daily | |||||||||
|
|  The overall Smart Investing & Trading Score is 58 (0-bearish to 100-bullish) which puts Small Cap index in short term neutral trend. The Smart Investing & Trading Score from previous trading session is 63 and hence a deterioration of trend.
| ||||||||
Here are the Smart Investing & Trading Scores of the most requested small cap stocks at 12Stocks.com (click stock name for detailed review):
|


| 12Stocks.com: Investing in Smallcap Index with Stocks | |
|
The following table helps investors and traders sort through current performance and trends (as measured by Smart Investing & Trading Score) of various
stocks in the Smallcap Index. Quick View: Move mouse or cursor over stock symbol (ticker) to view short-term technical chart and over stock name to view long term chart. Click on  to add stock symbol to your watchlist and to add stock symbol to your watchlist and  to view watchlist. Click on any ticker or stock name for detailed market intelligence report for that stock. to view watchlist. Click on any ticker or stock name for detailed market intelligence report for that stock. |
12Stocks.com Performance of Stocks in Smallcap Index
| Ticker | Stock Name | Watchlist | Category | Recent Price | Smart Investing & Trading Score | Change % | YTD Change% |
| PSTL | Postal Realty |   | Financials | 13.82 | 60 | -0.43% | -5.08% |
| SSB | South State | | Financials | 80.14 | 47 | 0.38% | -5.10% |
| KFRC | Kforce | | Services & Goods | 64.09 | 18 | -0.15% | -5.13% |
| FFBC | First Financial | | Financials | 22.53 | 87 | -0.31% | -5.14% |
| MFA | MFA Financial | | Financials | 10.69 | 32 | -0.65% | -5.15% |
| EVTC | EVERTEC | | Technology | 38.83 | 67 | 0.49% | -5.15% |
| BRT | BRT Apartments | | Financials | 17.63 | 93 | -1.73% | -5.16% |
| ALTG | Alta Equipment | | Transports | 11.73 | 61 | -0.17% | -5.17% |
| WDFC | WD-40 | | Materials | 226.56 | 10 | 0.17% | -5.23% |
| PHR | Phreesia | | Technology | 21.94 | 42 | -5.19% | -5.23% |
| ALLO | Allogene | | Health Care | 3.04 | 15 | -9.79% | -5.30% |
| NXT | Nextracker | | Technology | 44.25 | 18 | -0.36% | -5.31% |
| SFBS | ServisFirst Bancshares | | Financials | 63.04 | 52 | 0.67% | -5.39% |
| DLX | Deluxe | | Services & Goods | 20.29 | 95 | -0.93% | -5.41% |
| AAT | American Assets | | Financials | 21.29 | 67 | -1.53% | -5.42% |
| BCPC | Balchem | | Materials | 140.59 | 44 | -3.09% | -5.49% |
| PRAA | PRA Group | | Services & Goods | 24.76 | 68 | -0.64% | -5.50% |
| JOE | St. Joe | | Financials | 56.86 | 76 | -0.30% | -5.52% |
| INVA | Innoviva | | Health Care | 15.15 | 69 | -0.13% | -5.55% |
| ATRO | Astronics | | Industrials | 16.45 | 32 | -2.03% | -5.57% |
| MEC | Mayville Engineering | | Industrials | 13.61 | 53 | -1.52% | -5.62% |
| FRME | First Merchants | | Financials | 34.99 | 100 | 0.78% | -5.64% |
| FULT | Fulton Financial | | Financials | 15.53 | 74 | 1.24% | -5.65% |
| AVTE | Aerovate | | Health Care | 21.27 | 61 | -8.46% | -5.76% |
| FOR | Forestar Group | | Financials | 31.15 | 30 | -1.02% | -5.81% |


| Too many stocks? View smallcap stocks filtered by marketcap & sector |
| Marketcap: All SmallCap Stocks (default-no microcap), Large, Mid-Range, Small |
| Smallcap Sector: Tech, Finance, Energy, Staples, Retail, Industrial, Materials, & Medical |
|
Get the most comprehensive stock market coverage daily at 12Stocks.com ➞ Best Stocks Today ➞ Best Stocks Weekly ➞ Best Stocks Year-to-Date ➞ Best Stocks Trends ➞  Best Stocks Today 12Stocks.com Best Nasdaq Stocks ➞ Best S&P 500 Stocks ➞ Best Tech Stocks ➞ Best Biotech Stocks ➞ |
| Detailed Overview of SmallCap Stocks |
| SmallCap Technical Overview, Leaders & Laggards, Top SmallCap ETF Funds & Detailed SmallCap Stocks List, Charts, Trends & More |
| Smallcap: Technical Analysis, Trends & YTD Performance | |
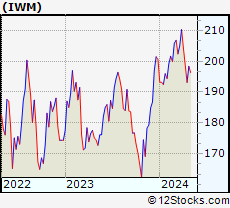
| SmallCap segment as represented by
IWM, an exchange-traded fund [ETF], holds basket of thousands of smallcap stocks from across all major sectors of the US stock market. The smallcap index (contains stocks like Riverbed & Sotheby's) is down by -1.51% and is currently underperforming the overall market by -7.17% year-to-date. Below is a quick view of technical charts and trends: | |
 IWM Weekly Chart |
|
| Long Term Trend: Good | |
| Medium Term Trend: Not Good | |
 IWM Daily Chart |
|
| Short Term Trend: Very Good | |
| Overall Trend Score: 58 | |
| YTD Performance: -1.51% | |
| **Trend Scores & Views Are Only For Educational Purposes And Not For Investing | |
| 12Stocks.com: Top Performing Small Cap Index Stocks | ||||||||||||||||||||||||||||||||||||||||||||||||
 The top performing Small Cap Index stocks year to date are
Now, more recently, over last week, the top performing Small Cap Index stocks on the move are


|
||||||||||||||||||||||||||||||||||||||||||||||||
| 12Stocks.com: Investing in Smallcap Index using Exchange Traded Funds | |
|
The following table shows list of key exchange traded funds (ETF) that
help investors track Smallcap index. The following list also includes leveraged ETF funds that track twice or thrice the daily returns of Smallcap indices. Short or inverse ETF funds move in the opposite direction to the index they track and are useful during market pullbacks or during bear markets. Quick View: Move mouse or cursor over ETF symbol (ticker) to view short-term technical chart and over ETF name to view long term chart. Click on ticker or stock name for detailed view. Click on to add stock symbol to your watchlist and to view watchlist. |
12Stocks.com List of ETFs that track Smallcap Index
| Ticker | ETF Name | Watchlist | Recent Price | Smart Investing & Trading Score | Change % | Week % | Year-to-date % |
| IWM | iShares Russell 2000 | | 197.68 | 58 | -0.45 | 2.35 | -1.51% |
| IJR | iShares Core S&P Small-Cap | | 105.71 | 85 | -0.24 | 2.41 | -2.35% |
| VTWO | Vanguard Russell 2000 ETF | | 79.95 | 48 | -0.42 | 2.39 | -1.42% |
| IWN | iShares Russell 2000 Value | | 151.28 | 75 | -0.30 | 2.37 | -2.61% |
| IWO | iShares Russell 2000 Growth | | 251.27 | 58 | -0.44 | 2.44 | -0.38% |
| IJS | iShares S&P Small-Cap 600 Value | | 97.71 | 45 | -0.43 | 2.2 | -5.2% |
| IJT | iShares S&P Small-Cap 600 Growth | | 125.60 | 48 | -0.10 | 2.77 | 0.37% |
| XSLV | PowerShares S&P SmallCap Low Volatil ETF | | 42.81 | 48 | -0.57 | 1.48 | -3.05% |
| SBB | ProShares Short SmallCap600 | | 16.37 | 33 | -0.02 | -2.79 | 2.76% |
| SMLV | SPDR SSGA US Small Cap Low Volatil ETF | | 108.43 | 73 | -0.31 | 2.21 | -3.63% |
| SAA | ProShares Ultra SmallCap600 | | 23.01 | 58 | -0.60 | 5.55 | -7.78% |
| SDD | ProShares UltraShort SmallCap600 | | 19.49 | 42 | 1.35 | -4.18 | 5.77% |
| 12Stocks.com: Charts, Trends, Fundamental Data and Performances of SmallCap Stocks | |
|
We now take in-depth look at all SmallCap stocks including charts, multi-period performances and overall trends (as measured by Smart Investing & Trading Score). One can sort SmallCap stocks (click link to choose) by Daily, Weekly and by Year-to-Date performances. Also, one can sort by size of the company or by market capitalization. |
| Select Your Default Chart Type: | |||||
| |||||
| Click on stock symbol or name for detailed view. Click on to add stock symbol to your watchlist and to view watchlist. Quick View: Move mouse or cursor over "Daily" to quickly view daily technical stock chart and over "Weekly" to view weekly technical stock chart. | |||||

 | PSTL Postal Realty Trust, Inc. |
| Sector: Financials | |
| SubSector: REIT - Office | |
| MarketCap: 82.9866 Millions | |
| Recent Price: 13.82 Smart Investing & Trading Score: 60 | |
| Day Percent Change: -0.43% Day Change: -0.06 | |
| Week Change: 0.44% Year-to-date Change: -5.1% | |
| PSTL Links: Profile News Message Board | |
| Charts:- Daily , Weekly | |
| Add PSTL to Watchlist: View: Get Complete PSTL Trend Analysis ➞ | |
 | SSB South State Corporation |
| Sector: Financials | |
| SubSector: Regional - Mid-Atlantic Banks | |
| MarketCap: 2113.49 Millions | |
| Recent Price: 80.14 Smart Investing & Trading Score: 47 | |
| Day Percent Change: 0.38% Day Change: 0.30 | |
| Week Change: 2.31% Year-to-date Change: -5.1% | |
| SSB Links: Profile News Message Board | |
| Charts:- Daily , Weekly | |
| Add SSB to Watchlist: View: Get Complete SSB Trend Analysis ➞ | |
 | KFRC Kforce Inc. |
| Sector: Services & Goods | |
| SubSector: Staffing & Outsourcing Services | |
| MarketCap: 622.828 Millions | |
| Recent Price: 64.09 Smart Investing & Trading Score: 18 | |
| Day Percent Change: -0.15% Day Change: -0.09 | |
| Week Change: 0.84% Year-to-date Change: -5.1% | |
| KFRC Links: Profile News Message Board | |
| Charts:- Daily , Weekly | |
| Add KFRC to Watchlist: View: Get Complete KFRC Trend Analysis ➞ | |
 | FFBC First Financial Bancorp. |
| Sector: Financials | |
| SubSector: Regional - Midwest Banks | |
| MarketCap: 1363.7 Millions | |
| Recent Price: 22.53 Smart Investing & Trading Score: 87 | |
| Day Percent Change: -0.31% Day Change: -0.07 | |
| Week Change: 2.92% Year-to-date Change: -5.1% | |
| FFBC Links: Profile News Message Board | |
| Charts:- Daily , Weekly | |
| Add FFBC to Watchlist: View: Get Complete FFBC Trend Analysis ➞ | |
 | MFA MFA Financial, Inc. |
| Sector: Financials | |
| SubSector: Mortgage Investment | |
| MarketCap: 1869.69 Millions | |
| Recent Price: 10.69 Smart Investing & Trading Score: 32 | |
| Day Percent Change: -0.65% Day Change: -0.07 | |
| Week Change: 2.49% Year-to-date Change: -5.2% | |
| MFA Links: Profile News Message Board | |
| Charts:- Daily , Weekly | |
| Add MFA to Watchlist: View: Get Complete MFA Trend Analysis ➞ | |
 | EVTC EVERTEC, Inc. |
| Sector: Technology | |
| SubSector: Business Software & Services | |
| MarketCap: 1646.08 Millions | |
| Recent Price: 38.83 Smart Investing & Trading Score: 67 | |
| Day Percent Change: 0.49% Day Change: 0.19 | |
| Week Change: 2.75% Year-to-date Change: -5.2% | |
| EVTC Links: Profile News Message Board | |
| Charts:- Daily , Weekly | |
| Add EVTC to Watchlist: View: Get Complete EVTC Trend Analysis ➞ | |
 | BRT BRT Apartments Corp. |
| Sector: Financials | |
| SubSector: Mortgage Investment | |
| MarketCap: 163.239 Millions | |
| Recent Price: 17.63 Smart Investing & Trading Score: 93 | |
| Day Percent Change: -1.73% Day Change: -0.31 | |
| Week Change: 1.5% Year-to-date Change: -5.2% | |
| BRT Links: Profile News Message Board | |
| Charts:- Daily , Weekly | |
| Add BRT to Watchlist: View: Get Complete BRT Trend Analysis ➞ | |
 | ALTG Alta Equipment Group Inc. |
| Sector: Transports | |
| SubSector: Rental & Leasing Services | |
| MarketCap: 86.9044 Millions | |
| Recent Price: 11.73 Smart Investing & Trading Score: 61 | |
| Day Percent Change: -0.17% Day Change: -0.02 | |
| Week Change: 1.21% Year-to-date Change: -5.2% | |
| ALTG Links: Profile News Message Board | |
| Charts:- Daily , Weekly | |
| Add ALTG to Watchlist: View: Get Complete ALTG Trend Analysis ➞ | |
 | WDFC WD-40 Company |
| Sector: Materials | |
| SubSector: Specialty Chemicals | |
| MarketCap: 2900.57 Millions | |
| Recent Price: 226.56 Smart Investing & Trading Score: 10 | |
| Day Percent Change: 0.17% Day Change: 0.39 | |
| Week Change: -1.43% Year-to-date Change: -5.2% | |
| WDFC Links: Profile News Message Board | |
| Charts:- Daily , Weekly | |
| Add WDFC to Watchlist: View: Get Complete WDFC Trend Analysis ➞ | |
 | PHR Phreesia, Inc. |
| Sector: Technology | |
| SubSector: Healthcare Information Services | |
| MarketCap: 810.255 Millions | |
| Recent Price: 21.94 Smart Investing & Trading Score: 42 | |
| Day Percent Change: -5.19% Day Change: -1.20 | |
| Week Change: 1.11% Year-to-date Change: -5.2% | |
| PHR Links: Profile News Message Board | |
| Charts:- Daily , Weekly | |
| Add PHR to Watchlist: View: Get Complete PHR Trend Analysis ➞ | |
 | ALLO Allogene Therapeutics, Inc. |
| Sector: Health Care | |
| SubSector: Biotechnology | |
| MarketCap: 2858.65 Millions | |
| Recent Price: 3.04 Smart Investing & Trading Score: 15 | |
| Day Percent Change: -9.79% Day Change: -0.33 | |
| Week Change: -12.64% Year-to-date Change: -5.3% | |
| ALLO Links: Profile News Message Board | |
| Charts:- Daily , Weekly | |
| Add ALLO to Watchlist: View: Get Complete ALLO Trend Analysis ➞ | |
 | NXT Nextracker Inc. |
| Sector: Technology | |
| SubSector: Solar | |
| MarketCap: 5590 Millions | |
| Recent Price: 44.25 Smart Investing & Trading Score: 18 | |
| Day Percent Change: -0.36% Day Change: -0.16 | |
| Week Change: 0.57% Year-to-date Change: -5.3% | |
| NXT Links: Profile News Message Board | |
| Charts:- Daily , Weekly | |
| Add NXT to Watchlist: View: Get Complete NXT Trend Analysis ➞ | |
 | SFBS ServisFirst Bancshares, Inc. |
| Sector: Financials | |
| SubSector: Foreign Money Center Banks | |
| MarketCap: 1596.71 Millions | |
| Recent Price: 63.04 Smart Investing & Trading Score: 52 | |
| Day Percent Change: 0.67% Day Change: 0.42 | |
| Week Change: 4.68% Year-to-date Change: -5.4% | |
| SFBS Links: Profile News Message Board | |
| Charts:- Daily , Weekly | |
| Add SFBS to Watchlist: View: Get Complete SFBS Trend Analysis ➞ | |
 | DLX Deluxe Corporation |
| Sector: Services & Goods | |
| SubSector: Business Services | |
| MarketCap: 1025.82 Millions | |
| Recent Price: 20.29 Smart Investing & Trading Score: 95 | |
| Day Percent Change: -0.93% Day Change: -0.19 | |
| Week Change: 2.94% Year-to-date Change: -5.4% | |
| DLX Links: Profile News Message Board | |
| Charts:- Daily , Weekly | |
| Add DLX to Watchlist: View: Get Complete DLX Trend Analysis ➞ | |
 | AAT American Assets Trust, Inc. |
| Sector: Financials | |
| SubSector: REIT - Retail | |
| MarketCap: 1580.54 Millions | |
| Recent Price: 21.29 Smart Investing & Trading Score: 67 | |
| Day Percent Change: -1.53% Day Change: -0.33 | |
| Week Change: 1.43% Year-to-date Change: -5.4% | |
| AAT Links: Profile News Message Board | |
| Charts:- Daily , Weekly | |
| Add AAT to Watchlist: View: Get Complete AAT Trend Analysis ➞ | |
 | BCPC Balchem Corporation |
| Sector: Materials | |
| SubSector: Specialty Chemicals | |
| MarketCap: 3330.17 Millions | |
| Recent Price: 140.59 Smart Investing & Trading Score: 44 | |
| Day Percent Change: -3.09% Day Change: -4.48 | |
| Week Change: -2.02% Year-to-date Change: -5.5% | |
| BCPC Links: Profile News Message Board | |
| Charts:- Daily , Weekly | |
| Add BCPC to Watchlist: View: Get Complete BCPC Trend Analysis ➞ | |
 | PRAA PRA Group, Inc. |
| Sector: Services & Goods | |
| SubSector: Business Services | |
| MarketCap: 1290.32 Millions | |
| Recent Price: 24.76 Smart Investing & Trading Score: 68 | |
| Day Percent Change: -0.64% Day Change: -0.16 | |
| Week Change: 1.6% Year-to-date Change: -5.5% | |
| PRAA Links: Profile News Message Board | |
| Charts:- Daily , Weekly | |
| Add PRAA to Watchlist: View: Get Complete PRAA Trend Analysis ➞ | |
 | JOE The St. Joe Company |
| Sector: Financials | |
| SubSector: Real Estate Development | |
| MarketCap: 1029.39 Millions | |
| Recent Price: 56.86 Smart Investing & Trading Score: 76 | |
| Day Percent Change: -0.30% Day Change: -0.17 | |
| Week Change: 3.61% Year-to-date Change: -5.5% | |
| JOE Links: Profile News Message Board | |
| Charts:- Daily , Weekly | |
| Add JOE to Watchlist: View: Get Complete JOE Trend Analysis ➞ | |
 | INVA Innoviva, Inc. |
| Sector: Health Care | |
| SubSector: Biotechnology | |
| MarketCap: 1023.15 Millions | |
| Recent Price: 15.15 Smart Investing & Trading Score: 69 | |
| Day Percent Change: -0.13% Day Change: -0.02 | |
| Week Change: 1.34% Year-to-date Change: -5.6% | |
| INVA Links: Profile News Message Board | |
| Charts:- Daily , Weekly | |
| Add INVA to Watchlist: View: Get Complete INVA Trend Analysis ➞ | |
 | ATRO Astronics Corporation |
| Sector: Industrials | |
| SubSector: Aerospace/Defense Products & Services | |
| MarketCap: 287.201 Millions | |
| Recent Price: 16.45 Smart Investing & Trading Score: 32 | |
| Day Percent Change: -2.03% Day Change: -0.34 | |
| Week Change: 2.68% Year-to-date Change: -5.6% | |
| ATRO Links: Profile News Message Board | |
| Charts:- Daily , Weekly | |
| Add ATRO to Watchlist: View: Get Complete ATRO Trend Analysis ➞ | |
 | MEC Mayville Engineering Company, Inc. |
| Sector: Industrials | |
| SubSector: Metal Fabrication | |
| MarketCap: 143.55 Millions | |
| Recent Price: 13.61 Smart Investing & Trading Score: 53 | |
| Day Percent Change: -1.52% Day Change: -0.21 | |
| Week Change: -1.95% Year-to-date Change: -5.6% | |
| MEC Links: Profile News Message Board | |
| Charts:- Daily , Weekly | |
| Add MEC to Watchlist: View: Get Complete MEC Trend Analysis ➞ | |
 | FRME First Merchants Corporation |
| Sector: Financials | |
| SubSector: Regional - Midwest Banks | |
| MarketCap: 1490.4 Millions | |
| Recent Price: 34.99 Smart Investing & Trading Score: 100 | |
| Day Percent Change: 0.78% Day Change: 0.27 | |
| Week Change: 2.7% Year-to-date Change: -5.6% | |
| FRME Links: Profile News Message Board | |
| Charts:- Daily , Weekly | |
| Add FRME to Watchlist: View: Get Complete FRME Trend Analysis ➞ | |
 | FULT Fulton Financial Corporation |
| Sector: Financials | |
| SubSector: Regional - Northeast Banks | |
| MarketCap: 2030.89 Millions | |
| Recent Price: 15.53 Smart Investing & Trading Score: 74 | |
| Day Percent Change: 1.24% Day Change: 0.19 | |
| Week Change: 3.6% Year-to-date Change: -5.7% | |
| FULT Links: Profile News Message Board | |
| Charts:- Daily , Weekly | |
| Add FULT to Watchlist: View: Get Complete FULT Trend Analysis ➞ | |
 | AVTE Aerovate Therapeutics, Inc. |
| Sector: Health Care | |
| SubSector: Biotechnology | |
| MarketCap: 478 Millions | |
| Recent Price: 21.27 Smart Investing & Trading Score: 61 | |
| Day Percent Change: -8.46% Day Change: -1.96 | |
| Week Change: -3.54% Year-to-date Change: -5.8% | |
| AVTE Links: Profile News Message Board | |
| Charts:- Daily , Weekly | |
| Add AVTE to Watchlist: View: Get Complete AVTE Trend Analysis ➞ | |
 | FOR Forestar Group Inc. |
| Sector: Financials | |
| SubSector: Real Estate Development | |
| MarketCap: 661.019 Millions | |
| Recent Price: 31.15 Smart Investing & Trading Score: 30 | |
| Day Percent Change: -1.02% Day Change: -0.32 | |
| Week Change: -1.46% Year-to-date Change: -5.8% | |
| FOR Links: Profile News Message Board | |
| Charts:- Daily , Weekly | |
| Add FOR to Watchlist: View: Get Complete FOR Trend Analysis ➞ | |
| Too many stocks? View smallcap stocks filtered by marketcap & sector |
| Marketcap: All SmallCap Stocks (default-no microcap), Large, Mid-Range, Small & MicroCap |
| Sector: Tech, Finance, Energy, Staples, Retail, Industrial, Materials, Utilities & Medical |
|
Best Stocks Today 12Stocks.com |
© 2024 12Stocks.com Terms & Conditions Privacy Contact Us
All Information Provided Only For Education And Not To Be Used For Investing or Trading. See Terms & Conditions


One More Thing ... Get Best Stocks Delivered Daily!
Never Ever Miss A Move With Our Top Ten Stocks Lists
Find Best Stocks In Any Market - Bull or Bear Market
Take A Peek At Our Top Ten Stocks Lists: Daily, Weekly, Year-to-Date & Top Trends
Find Best Stocks In Any Market - Bull or Bear Market
Take A Peek At Our Top Ten Stocks Lists: Daily, Weekly, Year-to-Date & Top Trends
Smallcap Stocks With Best Up Trends [0-bearish to 100-bullish]: B. Riley[100], Ribbon [100], Group 1[100], Trustmark [100], MBIA [100], Integer [100], EchoStar [100], Vishay Inter[100], Comstock Resources[100], Jamf Holding[100], SunOpta [100]
Best Smallcap Stocks Year-to-Date:
CareMax [574.23%], Janux [352.07%], Viking [249.44%], Alpine Immune[239.13%], Longboard [223.4%], Avidity Biosciences[177.71%], Arcutis Bio[171.21%], Super Micro[165.69%], Vera [149.61%], Hippo [130.79%], Y-mAbs [123.75%] Best Smallcap Stocks This Week:
Matterport [166.09%], B. Riley[49.37%], Seres [30.29%], Riot Blockchain[30.07%], CareMax [27.24%], Ribbon [25.78%], ProKidney [23.28%], SoundHound AI[22.54%], Cipher Mining[22.14%], Hibbett Sports[21.56%], Cullinan Oncology[20.69%] Best Smallcap Stocks Daily:
B. Riley[37.48%], Ribbon [26.26%], Babcock & Wilcox Enterprises[15.57%], Cullinan Oncology[13.55%], Amneal [12.41%], Gritstone Oncology[11.01%], Comtech Tele[10.76%], Innodata [9.76%], Navitas Semiconductor[8.83%], Eyenovia [8.68%], K12 [8.64%]