
 Login Sign Up


| |||||
 |  | ||||

| 12Stocks.com Market Intelligence |
Best SmallCap Stocks
|
| In a hurry? Small Cap Stock Lists: Performance Trends Table, Stock Charts
Sort Small Cap stocks: Daily, Weekly, Year-to-Date, Market Cap & Trends. Filter Small Cap stocks list by sector: Show all, Tech, Finance, Energy, Staples, Retail, Industrial, Materials, Utilities and HealthCare Filter Small Cap stocks list by size: All Large Medium Small and MicroCap |
| 12Stocks.com Small Cap Stocks Performances & Trends Daily | |||||||||
|
|  The overall Smart Investing & Trading Score is 63 (0-bearish to 100-bullish) which puts Small Cap index in short term neutral to bullish trend. The Smart Investing & Trading Score from previous trading session is 58 and hence an improvement of trend.
| ||||||||
Here are the Smart Investing & Trading Scores of the most requested small cap stocks at 12Stocks.com (click stock name for detailed review):
|


| 12Stocks.com: Investing in Smallcap Index with Stocks | |
|
The following table helps investors and traders sort through current performance and trends (as measured by Smart Investing & Trading Score) of various
stocks in the Smallcap Index. Quick View: Move mouse or cursor over stock symbol (ticker) to view short-term technical chart and over stock name to view long term chart. Click on  to add stock symbol to your watchlist and to add stock symbol to your watchlist and  to view watchlist. Click on any ticker or stock name for detailed market intelligence report for that stock. to view watchlist. Click on any ticker or stock name for detailed market intelligence report for that stock. |
12Stocks.com Performance of Stocks in Smallcap Index
| Ticker | Stock Name | Watchlist | Category | Recent Price | Smart Investing & Trading Score | Change % | YTD Change% |
| NHC | National HealthCare |   | Health Care | 91.18 | 49 | 1.32% | -1.34% |
| MATX | Matson | | Transports | 108.13 | 42 | 0.57% | -1.34% |
| DGICA | Donegal Group | | Financials | 13.80 | 60 | -0.22% | -1.36% |
| MPX | Marine Products | | Consumer Staples | 11.24 | 75 | 0.99% | -1.40% |
| GLUE | Monte Rosa | | Health Care | 5.55 | 41 | 0.91% | -1.42% |
| ESGR | Enstar Group | | Financials | 290.10 | 65 | 0.90% | -1.44% |
| VVI | Viad Corp | | Services & Goods | 35.67 | 63 | 1.16% | -1.46% |
| SNBR | Sleep Number | | Consumer Staples | 14.60 | 95 | 10.52% | -1.55% |
| FA | First Advantage | | Industrials | 16.42 | 82 | 5.94% | -1.56% |
| BL | BlackLine | | Technology | 61.46 | 68 | 5.26% | -1.57% |
| NWN | Northwest Natural | | Utilities | 38.31 | 100 | 0.82% | -1.62% |
| CMPX | Compass | | Health Care | 1.51 | 46 | 1.34% | -1.63% |
| RHP | Ryman Hospitality | | Financials | 108.24 | 32 | 1.59% | -1.65% |
| WMK | Weis Markets | | Services & Goods | 62.89 | 66 | 0.50% | -1.67% |
| APAM | Artisan Partners | | Financials | 43.43 | 63 | 2.07% | -1.70% |
| ARR | ARMOUR Residential | | Financials | 18.99 | 62 | 3.38% | -1.71% |
| EPM | Evolution | | Energy | 5.71 | 68 | -0.52% | -1.72% |
| VHI | Valhi | | Materials | 14.91 | 46 | -0.53% | -1.84% |
| WEST | Westrock Coffee | | Consumer Staples | 9.97 | 17 | -1.29% | -1.87% |
| SR | Spire | | Utilities | 61.17 | 93 | -0.34% | -1.88% |
| AFRI | Forafric Global | | Consumer Staples | 10.39 | 63 | -0.95% | -1.89% |
| OFIX | Orthofix Medical | | Health Care | 13.22 | 42 | 1.07% | -1.93% |
| SHO | Sunstone Hotel | | Financials | 10.52 | 32 | 1.25% | -1.96% |
| LRN | K12 | | Services & Goods | 58.20 | 32 | 0.17% | -1.97% |
| PDM | Piedmont Office | | Financials | 6.97 | 100 | 4.19% | -1.97% |


| Too many stocks? View smallcap stocks filtered by marketcap & sector |
| Marketcap: All SmallCap Stocks (default-no microcap), Large, Mid-Range, Small |
| Smallcap Sector: Tech, Finance, Energy, Staples, Retail, Industrial, Materials, & Medical |
|
Get the most comprehensive stock market coverage daily at 12Stocks.com ➞ Best Stocks Today ➞ Best Stocks Weekly ➞ Best Stocks Year-to-Date ➞ Best Stocks Trends ➞  Best Stocks Today 12Stocks.com Best Nasdaq Stocks ➞ Best S&P 500 Stocks ➞ Best Tech Stocks ➞ Best Biotech Stocks ➞ |
| Detailed Overview of SmallCap Stocks |
| SmallCap Technical Overview, Leaders & Laggards, Top SmallCap ETF Funds & Detailed SmallCap Stocks List, Charts, Trends & More |
| Smallcap: Technical Analysis, Trends & YTD Performance | |
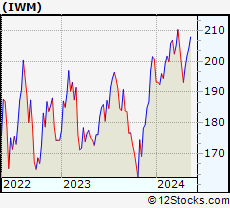
| SmallCap segment as represented by
IWM, an exchange-traded fund [ETF], holds basket of thousands of smallcap stocks from across all major sectors of the US stock market. The smallcap index (contains stocks like Riverbed & Sotheby's) is down by -1.07% and is currently underperforming the overall market by -6.71% year-to-date. Below is a quick view of technical charts and trends: | |
 IWM Weekly Chart |
|
| Long Term Trend: Good | |
| Medium Term Trend: Not Good | |
 IWM Daily Chart |
|
| Short Term Trend: Very Good | |
| Overall Trend Score: 63 | |
| YTD Performance: -1.07% | |
| **Trend Scores & Views Are Only For Educational Purposes And Not For Investing | |
| 12Stocks.com: Top Performing Small Cap Index Stocks | ||||||||||||||||||||||||||||||||||||||||||||||||
 The top performing Small Cap Index stocks year to date are
Now, more recently, over last week, the top performing Small Cap Index stocks on the move are


|
||||||||||||||||||||||||||||||||||||||||||||||||
| 12Stocks.com: Investing in Smallcap Index using Exchange Traded Funds | |
|
The following table shows list of key exchange traded funds (ETF) that
help investors track Smallcap index. The following list also includes leveraged ETF funds that track twice or thrice the daily returns of Smallcap indices. Short or inverse ETF funds move in the opposite direction to the index they track and are useful during market pullbacks or during bear markets. Quick View: Move mouse or cursor over ETF symbol (ticker) to view short-term technical chart and over ETF name to view long term chart. Click on ticker or stock name for detailed view. Click on to add stock symbol to your watchlist and to view watchlist. |
12Stocks.com List of ETFs that track Smallcap Index
| Ticker | ETF Name | Watchlist | Recent Price | Smart Investing & Trading Score | Change % | Week % | Year-to-date % |
| IWM | iShares Russell 2000 | | 198.57 | 63 | 1.67 | 2.81 | -1.07% |
| IJR | iShares Core S&P Small-Cap | | 105.96 | 85 | 2.41 | 2.65 | -2.12% |
| VTWO | Vanguard Russell 2000 ETF | | 80.29 | 70 | 1.74 | 2.83 | -1% |
| IWN | iShares Russell 2000 Value | | 151.74 | 75 | 1.49 | 2.68 | -2.31% |
| IJS | iShares S&P Small-Cap 600 Value | | 98.13 | 67 | 1.76 | 2.64 | -4.79% |
| IWO | iShares Russell 2000 Growth | | 252.37 | 58 | 1.79 | 2.89 | 0.06% |
| IJT | iShares S&P Small-Cap 600 Growth | | 125.72 | 70 | 1.91 | 2.87 | 0.46% |
| XSLV | PowerShares S&P SmallCap Low Volatil ETF | | 43.05 | 80 | 1.44 | 2.06 | -2.49% |
| SMLV | SPDR SSGA US Small Cap Low Volatil ETF | | 108.77 | 93 | 1.20 | 2.52 | -3.34% |
| SAA | ProShares Ultra SmallCap600 | | 23.15 | 80 | 3.49 | 6.19 | -7.21% |
| SBB | ProShares Short SmallCap600 | | 16.37 | 20 | -1.48 | -2.77 | 2.79% |
| SDD | ProShares UltraShort SmallCap600 | | 19.23 | 30 | -2.63 | -5.46 | 4.36% |
| 12Stocks.com: Charts, Trends, Fundamental Data and Performances of SmallCap Stocks | |
|
We now take in-depth look at all SmallCap stocks including charts, multi-period performances and overall trends (as measured by Smart Investing & Trading Score). One can sort SmallCap stocks (click link to choose) by Daily, Weekly and by Year-to-Date performances. Also, one can sort by size of the company or by market capitalization. |
| Select Your Default Chart Type: | |||||
| |||||
| Click on stock symbol or name for detailed view. Click on to add stock symbol to your watchlist and to view watchlist. Quick View: Move mouse or cursor over "Daily" to quickly view daily technical stock chart and over "Weekly" to view weekly technical stock chart. | |||||

 | NHC National HealthCare Corporation |
| Sector: Health Care | |
| SubSector: Long-Term Care Facilities | |
| MarketCap: 1164.86 Millions | |
| Recent Price: 91.18 Smart Investing & Trading Score: 49 | |
| Day Percent Change: 1.32% Day Change: 1.19 | |
| Week Change: 0.62% Year-to-date Change: -1.3% | |
| NHC Links: Profile News Message Board | |
| Charts:- Daily , Weekly | |
| Add NHC to Watchlist: View: Get Complete NHC Trend Analysis ➞ | |
 | MATX Matson, Inc. |
| Sector: Transports | |
| SubSector: Shipping | |
| MarketCap: 1509.94 Millions | |
| Recent Price: 108.13 Smart Investing & Trading Score: 42 | |
| Day Percent Change: 0.57% Day Change: 0.61 | |
| Week Change: 1.8% Year-to-date Change: -1.3% | |
| MATX Links: Profile News Message Board | |
| Charts:- Daily , Weekly | |
| Add MATX to Watchlist: View: Get Complete MATX Trend Analysis ➞ | |
 | DGICA Donegal Group Inc. |
| Sector: Financials | |
| SubSector: Property & Casualty Insurance | |
| MarketCap: 350.512 Millions | |
| Recent Price: 13.80 Smart Investing & Trading Score: 60 | |
| Day Percent Change: -0.22% Day Change: -0.03 | |
| Week Change: -1.57% Year-to-date Change: -1.4% | |
| DGICA Links: Profile News Message Board | |
| Charts:- Daily , Weekly | |
| Add DGICA to Watchlist: View: Get Complete DGICA Trend Analysis ➞ | |
 | MPX Marine Products Corporation |
| Sector: Consumer Staples | |
| SubSector: Recreational Vehicles | |
| MarketCap: 316.059 Millions | |
| Recent Price: 11.24 Smart Investing & Trading Score: 75 | |
| Day Percent Change: 0.99% Day Change: 0.11 | |
| Week Change: -0.79% Year-to-date Change: -1.4% | |
| MPX Links: Profile News Message Board | |
| Charts:- Daily , Weekly | |
| Add MPX to Watchlist: View: Get Complete MPX Trend Analysis ➞ | |
 | GLUE Monte Rosa Therapeutics, Inc. |
| Sector: Health Care | |
| SubSector: Biotechnology | |
| MarketCap: 346 Millions | |
| Recent Price: 5.55 Smart Investing & Trading Score: 41 | |
| Day Percent Change: 0.91% Day Change: 0.05 | |
| Week Change: -5.13% Year-to-date Change: -1.4% | |
| GLUE Links: Profile News Message Board | |
| Charts:- Daily , Weekly | |
| Add GLUE to Watchlist: View: Get Complete GLUE Trend Analysis ➞ | |
 | ESGR Enstar Group Limited |
| Sector: Financials | |
| SubSector: Property & Casualty Insurance | |
| MarketCap: 2886.02 Millions | |
| Recent Price: 290.10 Smart Investing & Trading Score: 65 | |
| Day Percent Change: 0.90% Day Change: 2.58 | |
| Week Change: 1.76% Year-to-date Change: -1.4% | |
| ESGR Links: Profile News Message Board | |
| Charts:- Daily , Weekly | |
| Add ESGR to Watchlist: View: Get Complete ESGR Trend Analysis ➞ | |
 | VVI Viad Corp |
| Sector: Services & Goods | |
| SubSector: Business Services | |
| MarketCap: 270.682 Millions | |
| Recent Price: 35.67 Smart Investing & Trading Score: 63 | |
| Day Percent Change: 1.16% Day Change: 0.41 | |
| Week Change: 2.74% Year-to-date Change: -1.5% | |
| VVI Links: Profile News Message Board | |
| Charts:- Daily , Weekly | |
| Add VVI to Watchlist: View: Get Complete VVI Trend Analysis ➞ | |
 | SNBR Sleep Number Corporation |
| Sector: Consumer Staples | |
| SubSector: Home Furnishings & Fixtures | |
| MarketCap: 692.735 Millions | |
| Recent Price: 14.60 Smart Investing & Trading Score: 95 | |
| Day Percent Change: 10.52% Day Change: 1.39 | |
| Week Change: 7.27% Year-to-date Change: -1.6% | |
| SNBR Links: Profile News Message Board | |
| Charts:- Daily , Weekly | |
| Add SNBR to Watchlist: View: Get Complete SNBR Trend Analysis ➞ | |
 | FA First Advantage Corporation |
| Sector: Industrials | |
| SubSector: Specialty Business Services | |
| MarketCap: 2170 Millions | |
| Recent Price: 16.42 Smart Investing & Trading Score: 82 | |
| Day Percent Change: 5.94% Day Change: 0.92 | |
| Week Change: 7.18% Year-to-date Change: -1.6% | |
| FA Links: Profile News Message Board | |
| Charts:- Daily , Weekly | |
| Add FA to Watchlist: View: Get Complete FA Trend Analysis ➞ | |
 | BL BlackLine, Inc. |
| Sector: Technology | |
| SubSector: Application Software | |
| MarketCap: 2972.62 Millions | |
| Recent Price: 61.46 Smart Investing & Trading Score: 68 | |
| Day Percent Change: 5.26% Day Change: 3.07 | |
| Week Change: 7.13% Year-to-date Change: -1.6% | |
| BL Links: Profile News Message Board | |
| Charts:- Daily , Weekly | |
| Add BL to Watchlist: View: Get Complete BL Trend Analysis ➞ | |
 | NWN Northwest Natural Holding Company |
| Sector: Utilities | |
| SubSector: Gas Utilities | |
| MarketCap: 2058.17 Millions | |
| Recent Price: 38.31 Smart Investing & Trading Score: 100 | |
| Day Percent Change: 0.82% Day Change: 0.31 | |
| Week Change: 1.67% Year-to-date Change: -1.6% | |
| NWN Links: Profile News Message Board | |
| Charts:- Daily , Weekly | |
| Add NWN to Watchlist: View: Get Complete NWN Trend Analysis ➞ | |
 | CMPX Compass Therapeutics, Inc. |
| Sector: Health Care | |
| SubSector: Biotechnology | |
| MarketCap: 406 Millions | |
| Recent Price: 1.51 Smart Investing & Trading Score: 46 | |
| Day Percent Change: 1.34% Day Change: 0.02 | |
| Week Change: 2.72% Year-to-date Change: -1.6% | |
| CMPX Links: Profile News Message Board | |
| Charts:- Daily , Weekly | |
| Add CMPX to Watchlist: View: Get Complete CMPX Trend Analysis ➞ | |
 | RHP Ryman Hospitality Properties, Inc. |
| Sector: Financials | |
| SubSector: REIT - Hotel/Motel | |
| MarketCap: 1519.74 Millions | |
| Recent Price: 108.24 Smart Investing & Trading Score: 32 | |
| Day Percent Change: 1.59% Day Change: 1.69 | |
| Week Change: 3.65% Year-to-date Change: -1.7% | |
| RHP Links: Profile News Message Board | |
| Charts:- Daily , Weekly | |
| Add RHP to Watchlist: View: Get Complete RHP Trend Analysis ➞ | |
 | WMK Weis Markets, Inc. |
| Sector: Services & Goods | |
| SubSector: Grocery Stores | |
| MarketCap: 1148.75 Millions | |
| Recent Price: 62.89 Smart Investing & Trading Score: 66 | |
| Day Percent Change: 0.50% Day Change: 0.31 | |
| Week Change: -2.48% Year-to-date Change: -1.7% | |
| WMK Links: Profile News Message Board | |
| Charts:- Daily , Weekly | |
| Add WMK to Watchlist: View: Get Complete WMK Trend Analysis ➞ | |
 | APAM Artisan Partners Asset Management Inc. |
| Sector: Financials | |
| SubSector: Asset Management | |
| MarketCap: 1688.33 Millions | |
| Recent Price: 43.43 Smart Investing & Trading Score: 63 | |
| Day Percent Change: 2.07% Day Change: 0.88 | |
| Week Change: 1.9% Year-to-date Change: -1.7% | |
| APAM Links: Profile News Message Board | |
| Charts:- Daily , Weekly | |
| Add APAM to Watchlist: View: Get Complete APAM Trend Analysis ➞ | |
 | ARR ARMOUR Residential REIT, Inc. |
| Sector: Financials | |
| SubSector: Mortgage Investment | |
| MarketCap: 578.739 Millions | |
| Recent Price: 18.99 Smart Investing & Trading Score: 62 | |
| Day Percent Change: 3.38% Day Change: 0.62 | |
| Week Change: 4.51% Year-to-date Change: -1.7% | |
| ARR Links: Profile News Message Board | |
| Charts:- Daily , Weekly | |
| Add ARR to Watchlist: View: Get Complete ARR Trend Analysis ➞ | |
 | EPM Evolution Petroleum Corporation |
| Sector: Energy | |
| SubSector: Independent Oil & Gas | |
| MarketCap: 98.0593 Millions | |
| Recent Price: 5.71 Smart Investing & Trading Score: 68 | |
| Day Percent Change: -0.52% Day Change: -0.03 | |
| Week Change: -0.35% Year-to-date Change: -1.7% | |
| EPM Links: Profile News Message Board | |
| Charts:- Daily , Weekly | |
| Add EPM to Watchlist: View: Get Complete EPM Trend Analysis ➞ | |
 | VHI Valhi, Inc. |
| Sector: Materials | |
| SubSector: Chemicals - Major Diversified | |
| MarketCap: 394.336 Millions | |
| Recent Price: 14.91 Smart Investing & Trading Score: 46 | |
| Day Percent Change: -0.53% Day Change: -0.08 | |
| Week Change: -3.81% Year-to-date Change: -1.8% | |
| VHI Links: Profile News Message Board | |
| Charts:- Daily , Weekly | |
| Add VHI to Watchlist: View: Get Complete VHI Trend Analysis ➞ | |
 | WEST Westrock Coffee Company, LLC |
| Sector: Consumer Staples | |
| SubSector: Packaged Foods | |
| MarketCap: 799 Millions | |
| Recent Price: 9.97 Smart Investing & Trading Score: 17 | |
| Day Percent Change: -1.29% Day Change: -0.13 | |
| Week Change: -2.54% Year-to-date Change: -1.9% | |
| WEST Links: Profile News Message Board | |
| Charts:- Daily , Weekly | |
| Add WEST to Watchlist: View: Get Complete WEST Trend Analysis ➞ | |
 | SR Spire Inc. |
| Sector: Utilities | |
| SubSector: Gas Utilities | |
| MarketCap: 3745.87 Millions | |
| Recent Price: 61.17 Smart Investing & Trading Score: 93 | |
| Day Percent Change: -0.34% Day Change: -0.21 | |
| Week Change: 0.43% Year-to-date Change: -1.9% | |
| SR Links: Profile News Message Board | |
| Charts:- Daily , Weekly | |
| Add SR to Watchlist: View: Get Complete SR Trend Analysis ➞ | |
 | AFRI Forafric Global PLC |
| Sector: Consumer Staples | |
| SubSector: Farm Products | |
| MarketCap: 295 Millions | |
| Recent Price: 10.39 Smart Investing & Trading Score: 63 | |
| Day Percent Change: -0.95% Day Change: -0.10 | |
| Week Change: 0% Year-to-date Change: -1.9% | |
| AFRI Links: Profile News Message Board | |
| Charts:- Daily , Weekly | |
| Add AFRI to Watchlist: View: Get Complete AFRI Trend Analysis ➞ | |
 | OFIX Orthofix Medical Inc. |
| Sector: Health Care | |
| SubSector: Medical Appliances & Equipment | |
| MarketCap: 508.18 Millions | |
| Recent Price: 13.22 Smart Investing & Trading Score: 42 | |
| Day Percent Change: 1.07% Day Change: 0.14 | |
| Week Change: 0.92% Year-to-date Change: -1.9% | |
| OFIX Links: Profile News Message Board | |
| Charts:- Daily , Weekly | |
| Add OFIX to Watchlist: View: Get Complete OFIX Trend Analysis ➞ | |
 | SHO Sunstone Hotel Investors, Inc. |
| Sector: Financials | |
| SubSector: REIT - Hotel/Motel | |
| MarketCap: 1861.04 Millions | |
| Recent Price: 10.52 Smart Investing & Trading Score: 32 | |
| Day Percent Change: 1.25% Day Change: 0.13 | |
| Week Change: 3.04% Year-to-date Change: -2.0% | |
| SHO Links: Profile News Message Board | |
| Charts:- Daily , Weekly | |
| Add SHO to Watchlist: View: Get Complete SHO Trend Analysis ➞ | |
 | LRN K12 Inc. |
| Sector: Services & Goods | |
| SubSector: Education & Training Services | |
| MarketCap: 549.606 Millions | |
| Recent Price: 58.20 Smart Investing & Trading Score: 32 | |
| Day Percent Change: 0.17% Day Change: 0.10 | |
| Week Change: 2.95% Year-to-date Change: -2.0% | |
| LRN Links: Profile News Message Board | |
| Charts:- Daily , Weekly | |
| Add LRN to Watchlist: View: Get Complete LRN Trend Analysis ➞ | |
 | PDM Piedmont Office Realty Trust, Inc. |
| Sector: Financials | |
| SubSector: REIT - Office | |
| MarketCap: 2097.46 Millions | |
| Recent Price: 6.97 Smart Investing & Trading Score: 100 | |
| Day Percent Change: 4.19% Day Change: 0.28 | |
| Week Change: 7.23% Year-to-date Change: -2.0% | |
| PDM Links: Profile News Message Board | |
| Charts:- Daily , Weekly | |
| Add PDM to Watchlist: View: Get Complete PDM Trend Analysis ➞ | |
| Too many stocks? View smallcap stocks filtered by marketcap & sector |
| Marketcap: All SmallCap Stocks (default-no microcap), Large, Mid-Range, Small & MicroCap |
| Sector: Tech, Finance, Energy, Staples, Retail, Industrial, Materials, Utilities & Medical |
|
Best Stocks Today 12Stocks.com |
© 2024 12Stocks.com Terms & Conditions Privacy Contact Us
All Information Provided Only For Education And Not To Be Used For Investing or Trading. See Terms & Conditions


One More Thing ... Get Best Stocks Delivered Daily!
Never Ever Miss A Move With Our Top Ten Stocks Lists
Find Best Stocks In Any Market - Bull or Bear Market
Take A Peek At Our Top Ten Stocks Lists: Daily, Weekly, Year-to-Date & Top Trends
Find Best Stocks In Any Market - Bull or Bear Market
Take A Peek At Our Top Ten Stocks Lists: Daily, Weekly, Year-to-Date & Top Trends
Smallcap Stocks With Best Up Trends [0-bearish to 100-bullish]: Hibbett Sports[100], Braemar Hotels[100], Akoustis [100], FTAI Infrastructure[100], Vertex Energy[100], AZZ [100], Day One[100], Oscar Health[100], Mueller Industries[100], ScanSource [100], Gannett Co[100]
Best Smallcap Stocks Year-to-Date:
Janux [364.03%], Viking [248.9%], Alpine Immune[239.02%], Longboard [231.75%], Avidity Biosciences[178.1%], Arcutis Bio[170.59%], Super Micro[168.02%], Vera [154.91%], Hippo [134.14%], Y-mAbs [124.93%], Stoke [113.88%] Best Smallcap Stocks This Week:
Matterport [164.37%], Seres [35.74%], Riot Blockchain[29.79%], Cipher Mining[25%], ProKidney [24.75%], Braemar Hotels[21.3%], Akoustis [21.29%], Hibbett Sports[21.1%], Assertio [19.28%], BigBear.ai [17.93%], Marathon Patent[17.82%] Best Smallcap Stocks Daily:
Virgin Galactic[22.38%], Seres [21.68%], Marathon Patent[20.04%], Hibbett Sports[18.84%], Generation Bio[16.01%], IGM Biosciences[14.07%], FuelCell Energy[13.07%], Braemar Hotels[12.96%], SES AI[12.17%], NuScale Power[11.16%], Cutera [10.82%]