
 Login Sign Up


| |||||
 |  | ||||

| 12Stocks.com Market Intelligence |
Best SmallCap Stocks
|
| In a hurry? Small Cap Stock Lists: Performance Trends Table, Stock Charts
Sort Small Cap stocks: Daily, Weekly, Year-to-Date, Market Cap & Trends. Filter Small Cap stocks list by sector: Show all, Tech, Finance, Energy, Staples, Retail, Industrial, Materials, Utilities and HealthCare Filter Small Cap stocks list by size: All Large Medium Small and MicroCap |
| 12Stocks.com Small Cap Stocks Performances & Trends Daily | |||||||||
|
|  The overall Smart Investing & Trading Score is 13 (0-bearish to 100-bullish) which puts Small Cap index in short term bearish trend. The Smart Investing & Trading Score from previous trading session is 26 and hence a deterioration of trend.
| ||||||||
Here are the Smart Investing & Trading Scores of the most requested small cap stocks at 12Stocks.com (click stock name for detailed review):
|


| 12Stocks.com: Investing in Smallcap Index with Stocks | |
|
The following table helps investors and traders sort through current performance and trends (as measured by Smart Investing & Trading Score) of various
stocks in the Smallcap Index. Quick View: Move mouse or cursor over stock symbol (ticker) to view short-term technical chart and over stock name to view long term chart. Click on  to add stock symbol to your watchlist and to add stock symbol to your watchlist and  to view watchlist. Click on any ticker or stock name for detailed market intelligence report for that stock. to view watchlist. Click on any ticker or stock name for detailed market intelligence report for that stock. |
12Stocks.com Performance of Stocks in Smallcap Index
| Ticker | Stock Name | Watchlist | Category | Recent Price | Smart Investing & Trading Score | Change % | YTD Change% |
| MTH | Meritage Homes |   | Industrials | 150.14 | 7 | -1.28% | -13.81% |
| KZR | Kezar Life | | Health Care | 0.82 | 20 | 4.28% | -13.81% |
| THS | TreeHouse Foods | | Consumer Staples | 35.72 | 0 | -0.64% | -13.82% |
| OSW | OneSpaWorld | | Services & Goods | 12.15 | 0 | -1.94% | -13.83% |
| SBSI | Southside Bancshares | | Financials | 26.96 | 35 | 0.19% | -13.92% |
| METCB | Ramaco Resources | | Materials | 11.40 | 25 | 1.74% | -13.92% |
| RUSHB | Rush Enterprises | | Services & Goods | 45.60 | 0 | -2.65% | -13.93% |
| CBL | CBL & Associates Properties | | Financials | 21.00 | 0 | -1.27% | -14.00% |
| CEVA | CEVA | | Technology | 19.53 | 36 | -4.31% | -14.00% |
| LXP | Lexington Realty | | Financials | 8.53 | 10 | -3.29% | -14.01% |
| BOWL | Bowlero | | Services & Goods | 12.13 | 43 | 1.42% | -14.09% |
| IPAR | Inter Parfums | | Consumer Staples | 123.64 | 10 | -1.16% | -14.14% |
| CWK | Cushman & Wakefield | | Financials | 9.27 | 10 | -1.49% | -14.17% |
| NWBI | Northwest Bancshares | | Financials | 10.71 | 17 | 0.19% | -14.18% |
| ESSA | ESSA Bancorp | | Financials | 17.18 | 52 | 2.20% | -14.19% |
| PAX | Patria s | | Financials | 13.46 | 0 | 0.45% | -14.21% |
| RBCAA | Republic Bancorp | | Financials | 47.31 | 7 | 0.64% | -14.23% |
| BXMT | Blackstone Mortgage | | Financials | 18.23 | 17 | -0.11% | -14.29% |
| WRBY | Warby Parker | | Health Care | 12.09 | 5 | -4.12% | -14.29% |
| USCB | USCB Financial | | Financials | 10.52 | 17 | -0.19% | -14.33% |
| IPSC | Century | | Health Care | 2.83 | 5 | -10.03% | -14.39% |
| VC | Visteon | | Consumer Staples | 106.83 | 10 | -0.62% | -14.47% |
| IIIN | Insteel Industries | | Materials | 32.75 | 0 | -1.24% | -14.47% |
| REPL | Replimune Group | | Health Care | 7.21 | 42 | 0.84% | -14.47% |
| DIN | Dine Brands | | Services & Goods | 42.43 | 10 | -2.21% | -14.54% |


| Too many stocks? View smallcap stocks filtered by marketcap & sector |
| Marketcap: All SmallCap Stocks (default-no microcap), Large, Mid-Range, Small |
| Smallcap Sector: Tech, Finance, Energy, Staples, Retail, Industrial, Materials, & Medical |
|
Get the most comprehensive stock market coverage daily at 12Stocks.com ➞ Best Stocks Today ➞ Best Stocks Weekly ➞ Best Stocks Year-to-Date ➞ Best Stocks Trends ➞  Best Stocks Today 12Stocks.com Best Nasdaq Stocks ➞ Best S&P 500 Stocks ➞ Best Tech Stocks ➞ Best Biotech Stocks ➞ |
| Detailed Overview of SmallCap Stocks |
| SmallCap Technical Overview, Leaders & Laggards, Top SmallCap ETF Funds & Detailed SmallCap Stocks List, Charts, Trends & More |
| Smallcap: Technical Analysis, Trends & YTD Performance | |
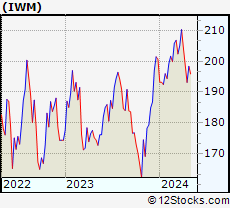
| SmallCap segment as represented by
IWM, an exchange-traded fund [ETF], holds basket of thousands of smallcap stocks from across all major sectors of the US stock market. The smallcap index (contains stocks like Riverbed & Sotheby's) is down by -3.84% and is currently underperforming the overall market by -8.25% year-to-date. Below is a quick view of technical charts and trends: | |
 IWM Weekly Chart |
|
| Long Term Trend: Good | |
| Medium Term Trend: Not Good | |
 IWM Daily Chart |
|
| Short Term Trend: Not Good | |
| Overall Trend Score: 13 | |
| YTD Performance: -3.84% | |
| **Trend Scores & Views Are Only For Educational Purposes And Not For Investing | |
| 12Stocks.com: Top Performing Small Cap Index Stocks | ||||||||||||||||||||||||||||||||||||||||||||||||
 The top performing Small Cap Index stocks year to date are
Now, more recently, over last week, the top performing Small Cap Index stocks on the move are


|
||||||||||||||||||||||||||||||||||||||||||||||||
| 12Stocks.com: Investing in Smallcap Index using Exchange Traded Funds | |
|
The following table shows list of key exchange traded funds (ETF) that
help investors track Smallcap index. The following list also includes leveraged ETF funds that track twice or thrice the daily returns of Smallcap indices. Short or inverse ETF funds move in the opposite direction to the index they track and are useful during market pullbacks or during bear markets. Quick View: Move mouse or cursor over ETF symbol (ticker) to view short-term technical chart and over ETF name to view long term chart. Click on ticker or stock name for detailed view. Click on to add stock symbol to your watchlist and to view watchlist. |
12Stocks.com List of ETFs that track Smallcap Index
| Ticker | ETF Name | Watchlist | Recent Price | Smart Investing & Trading Score | Change % | Week % | Year-to-date % |
| IWM | iShares Russell 2000 | | 193.00 | 13 | -1.06 | -2.86 | -3.84% |
| IJR | iShares Core S&P Small-Cap | | 102.13 | 7 | -0.58 | -2.28 | -5.65% |
| VTWO | Vanguard Russell 2000 ETF | | 78.05 | 13 | -1.04 | -2.83 | -3.76% |
| IWN | iShares Russell 2000 Value | | 146.03 | 0 | -0.77 | -2.89 | -5.99% |
| IWO | iShares Russell 2000 Growth | | 248.02 | 26 | -0.90 | -2.87 | -1.67% |
| IJS | iShares S&P Small-Cap 600 Value | | 94.12 | 7 | -0.57 | -2.13 | -8.68% |
| IJT | iShares S&P Small-Cap 600 Growth | | 121.84 | 13 | -1.02 | -2.36 | -2.64% |
| XSLV | PowerShares S&P SmallCap Low Volatil ETF | | 41.42 | 0 | -0.38 | -1.59 | -6.18% |
| SAA | ProShares Ultra SmallCap600 | | 21.66 | 0 | -1.19 | -3.99 | -13.19% |
| SMLV | SPDR SSGA US Small Cap Low Volatil ETF | | 103.66 | 10 | -0.17 | -1.29 | -7.87% |
| SBB | ProShares Short SmallCap600 | | 16.85 | 93 | 0.42 | 1.83 | 5.78% |
| SDD | ProShares UltraShort SmallCap600 | | 20.60 | 93 | 1.23 | 3.88 | 11.8% |
| 12Stocks.com: Charts, Trends, Fundamental Data and Performances of SmallCap Stocks | |
|
We now take in-depth look at all SmallCap stocks including charts, multi-period performances and overall trends (as measured by Smart Investing & Trading Score). One can sort SmallCap stocks (click link to choose) by Daily, Weekly and by Year-to-Date performances. Also, one can sort by size of the company or by market capitalization. |
| Select Your Default Chart Type: | |||||
| |||||
| Click on stock symbol or name for detailed view. Click on to add stock symbol to your watchlist and to view watchlist. Quick View: Move mouse or cursor over "Daily" to quickly view daily technical stock chart and over "Weekly" to view weekly technical stock chart. | |||||

 | MTH Meritage Homes Corporation |
| Sector: Industrials | |
| SubSector: Residential Construction | |
| MarketCap: 1440.36 Millions | |
| Recent Price: 150.14 Smart Investing & Trading Score: 7 | |
| Day Percent Change: -1.28% Day Change: -1.95 | |
| Week Change: -5.65% Year-to-date Change: -13.8% | |
| MTH Links: Profile News Message Board | |
| Charts:- Daily , Weekly | |
| Add MTH to Watchlist: View: Get Complete MTH Trend Analysis ➞ | |
 | KZR Kezar Life Sciences, Inc. |
| Sector: Health Care | |
| SubSector: Biotechnology | |
| MarketCap: 174.885 Millions | |
| Recent Price: 0.82 Smart Investing & Trading Score: 20 | |
| Day Percent Change: 4.28% Day Change: 0.03 | |
| Week Change: -5.34% Year-to-date Change: -13.8% | |
| KZR Links: Profile News Message Board | |
| Charts:- Daily , Weekly | |
| Add KZR to Watchlist: View: Get Complete KZR Trend Analysis ➞ | |
 | THS TreeHouse Foods, Inc. |
| Sector: Consumer Staples | |
| SubSector: Processed & Packaged Goods | |
| MarketCap: 2392.08 Millions | |
| Recent Price: 35.72 Smart Investing & Trading Score: 0 | |
| Day Percent Change: -0.64% Day Change: -0.23 | |
| Week Change: -1.65% Year-to-date Change: -13.8% | |
| THS Links: Profile News Message Board | |
| Charts:- Daily , Weekly | |
| Add THS to Watchlist: View: Get Complete THS Trend Analysis ➞ | |
 | OSW OneSpaWorld Holdings Limited |
| Sector: Services & Goods | |
| SubSector: Resorts & Casinos | |
| MarketCap: 228.394 Millions | |
| Recent Price: 12.15 Smart Investing & Trading Score: 0 | |
| Day Percent Change: -1.94% Day Change: -0.24 | |
| Week Change: -5.52% Year-to-date Change: -13.8% | |
| OSW Links: Profile News Message Board | |
| Charts:- Daily , Weekly | |
| Add OSW to Watchlist: View: Get Complete OSW Trend Analysis ➞ | |
 | SBSI Southside Bancshares, Inc. |
| Sector: Financials | |
| SubSector: Regional - Mid-Atlantic Banks | |
| MarketCap: 971.259 Millions | |
| Recent Price: 26.96 Smart Investing & Trading Score: 35 | |
| Day Percent Change: 0.19% Day Change: 0.05 | |
| Week Change: -0.19% Year-to-date Change: -13.9% | |
| SBSI Links: Profile News Message Board | |
| Charts:- Daily , Weekly | |
| Add SBSI to Watchlist: View: Get Complete SBSI Trend Analysis ➞ | |
 | METCB Ramaco Resources, Inc. |
| Sector: Materials | |
| SubSector: Coking Coal | |
| MarketCap: 469 Millions | |
| Recent Price: 11.40 Smart Investing & Trading Score: 25 | |
| Day Percent Change: 1.74% Day Change: 0.19 | |
| Week Change: -0.04% Year-to-date Change: -13.9% | |
| METCB Links: Profile News Message Board | |
| Charts:- Daily , Weekly | |
| Add METCB to Watchlist: View: Get Complete METCB Trend Analysis ➞ | |
 | RUSHB Rush Enterprises, Inc. |
| Sector: Services & Goods | |
| SubSector: Auto Dealerships | |
| MarketCap: 203.221 Millions | |
| Recent Price: 45.60 Smart Investing & Trading Score: 0 | |
| Day Percent Change: -2.65% Day Change: -1.24 | |
| Week Change: -6.19% Year-to-date Change: -13.9% | |
| RUSHB Links: Profile News Message Board | |
| Charts:- Daily , Weekly | |
| Add RUSHB to Watchlist: View: Get Complete RUSHB Trend Analysis ➞ | |
 | CBL CBL & Associates Properties, Inc. |
| Sector: Financials | |
| SubSector: REIT - Retail | |
| MarketCap: 690 Millions | |
| Recent Price: 21.00 Smart Investing & Trading Score: 0 | |
| Day Percent Change: -1.27% Day Change: -0.27 | |
| Week Change: -4.11% Year-to-date Change: -14.0% | |
| CBL Links: Profile News Message Board | |
| Charts:- Daily , Weekly | |
| Add CBL to Watchlist: View: Get Complete CBL Trend Analysis ➞ | |
 | CEVA CEVA, Inc. |
| Sector: Technology | |
| SubSector: Semiconductor - Specialized | |
| MarketCap: 587.06 Millions | |
| Recent Price: 19.53 Smart Investing & Trading Score: 36 | |
| Day Percent Change: -4.31% Day Change: -0.88 | |
| Week Change: -7.62% Year-to-date Change: -14.0% | |
| CEVA Links: Profile News Message Board | |
| Charts:- Daily , Weekly | |
| Add CEVA to Watchlist: View: Get Complete CEVA Trend Analysis ➞ | |
 | LXP Lexington Realty Trust |
| Sector: Financials | |
| SubSector: REIT - Diversified | |
| MarketCap: 2483.43 Millions | |
| Recent Price: 8.53 Smart Investing & Trading Score: 10 | |
| Day Percent Change: -3.29% Day Change: -0.29 | |
| Week Change: -5.95% Year-to-date Change: -14.0% | |
| LXP Links: Profile News Message Board | |
| Charts:- Daily , Weekly | |
| Add LXP to Watchlist: View: Get Complete LXP Trend Analysis ➞ | |
 | BOWL Bowlero Corp. |
| Sector: Services & Goods | |
| SubSector: Leisure | |
| MarketCap: 2000 Millions | |
| Recent Price: 12.13 Smart Investing & Trading Score: 43 | |
| Day Percent Change: 1.42% Day Change: 0.17 | |
| Week Change: -1.7% Year-to-date Change: -14.1% | |
| BOWL Links: Profile News Message Board | |
| Charts:- Daily , Weekly | |
| Add BOWL to Watchlist: View: Get Complete BOWL Trend Analysis ➞ | |
 | IPAR Inter Parfums, Inc. |
| Sector: Consumer Staples | |
| SubSector: Personal Products | |
| MarketCap: 1302.55 Millions | |
| Recent Price: 123.64 Smart Investing & Trading Score: 10 | |
| Day Percent Change: -1.16% Day Change: -1.45 | |
| Week Change: -2.17% Year-to-date Change: -14.1% | |
| IPAR Links: Profile News Message Board | |
| Charts:- Daily , Weekly | |
| Add IPAR to Watchlist: View: Get Complete IPAR Trend Analysis ➞ | |
 | CWK Cushman & Wakefield plc |
| Sector: Financials | |
| SubSector: Property Management | |
| MarketCap: 2651.62 Millions | |
| Recent Price: 9.27 Smart Investing & Trading Score: 10 | |
| Day Percent Change: -1.49% Day Change: -0.14 | |
| Week Change: -6.17% Year-to-date Change: -14.2% | |
| CWK Links: Profile News Message Board | |
| Charts:- Daily , Weekly | |
| Add CWK to Watchlist: View: Get Complete CWK Trend Analysis ➞ | |
 | NWBI Northwest Bancshares, Inc. |
| Sector: Financials | |
| SubSector: Savings & Loans | |
| MarketCap: 1266.3 Millions | |
| Recent Price: 10.71 Smart Investing & Trading Score: 17 | |
| Day Percent Change: 0.19% Day Change: 0.02 | |
| Week Change: -1.02% Year-to-date Change: -14.2% | |
| NWBI Links: Profile News Message Board | |
| Charts:- Daily , Weekly | |
| Add NWBI to Watchlist: View: Get Complete NWBI Trend Analysis ➞ | |
 | ESSA ESSA Bancorp, Inc. |
| Sector: Financials | |
| SubSector: Savings & Loans | |
| MarketCap: 171.33 Millions | |
| Recent Price: 17.18 Smart Investing & Trading Score: 52 | |
| Day Percent Change: 2.20% Day Change: 0.37 | |
| Week Change: 8.19% Year-to-date Change: -14.2% | |
| ESSA Links: Profile News Message Board | |
| Charts:- Daily , Weekly | |
| Add ESSA to Watchlist: View: Get Complete ESSA Trend Analysis ➞ | |
 | PAX Patria Investments Limited |
| Sector: Financials | |
| SubSector: Asset Management | |
| MarketCap: 2130 Millions | |
| Recent Price: 13.46 Smart Investing & Trading Score: 0 | |
| Day Percent Change: 0.45% Day Change: 0.06 | |
| Week Change: -3.03% Year-to-date Change: -14.2% | |
| PAX Links: Profile News Message Board | |
| Charts:- Daily , Weekly | |
| Add PAX to Watchlist: View: Get Complete PAX Trend Analysis ➞ | |
 | RBCAA Republic Bancorp, Inc. |
| Sector: Financials | |
| SubSector: Regional - Southeast Banks | |
| MarketCap: 671.835 Millions | |
| Recent Price: 47.31 Smart Investing & Trading Score: 7 | |
| Day Percent Change: 0.64% Day Change: 0.30 | |
| Week Change: -1.54% Year-to-date Change: -14.2% | |
| RBCAA Links: Profile News Message Board | |
| Charts:- Daily , Weekly | |
| Add RBCAA to Watchlist: View: Get Complete RBCAA Trend Analysis ➞ | |
 | BXMT Blackstone Mortgage Trust, Inc. |
| Sector: Financials | |
| SubSector: Mortgage Investment | |
| MarketCap: 2820.69 Millions | |
| Recent Price: 18.23 Smart Investing & Trading Score: 17 | |
| Day Percent Change: -0.11% Day Change: -0.02 | |
| Week Change: -2.25% Year-to-date Change: -14.3% | |
| BXMT Links: Profile News Message Board | |
| Charts:- Daily , Weekly | |
| Add BXMT to Watchlist: View: Get Complete BXMT Trend Analysis ➞ | |
 | WRBY Warby Parker Inc. |
| Sector: Health Care | |
| SubSector: Medical Instruments & Supplies | |
| MarketCap: 1380 Millions | |
| Recent Price: 12.09 Smart Investing & Trading Score: 5 | |
| Day Percent Change: -4.12% Day Change: -0.52 | |
| Week Change: -8.55% Year-to-date Change: -14.3% | |
| WRBY Links: Profile News Message Board | |
| Charts:- Daily , Weekly | |
| Add WRBY to Watchlist: View: Get Complete WRBY Trend Analysis ➞ | |
 | USCB USCB Financial Holdings, Inc. |
| Sector: Financials | |
| SubSector: Banks - Regional | |
| MarketCap: 198 Millions | |
| Recent Price: 10.52 Smart Investing & Trading Score: 17 | |
| Day Percent Change: -0.19% Day Change: -0.02 | |
| Week Change: 0.19% Year-to-date Change: -14.3% | |
| USCB Links: Profile News Message Board | |
| Charts:- Daily , Weekly | |
| Add USCB to Watchlist: View: Get Complete USCB Trend Analysis ➞ | |
 | IPSC Century Therapeutics, Inc. |
| Sector: Health Care | |
| SubSector: Biotechnology | |
| MarketCap: 187 Millions | |
| Recent Price: 2.83 Smart Investing & Trading Score: 5 | |
| Day Percent Change: -10.03% Day Change: -0.31 | |
| Week Change: -27.75% Year-to-date Change: -14.4% | |
| IPSC Links: Profile News Message Board | |
| Charts:- Daily , Weekly | |
| Add IPSC to Watchlist: View: Get Complete IPSC Trend Analysis ➞ | |
 | VC Visteon Corporation |
| Sector: Consumer Staples | |
| SubSector: Auto Parts | |
| MarketCap: 1441.49 Millions | |
| Recent Price: 106.83 Smart Investing & Trading Score: 10 | |
| Day Percent Change: -0.62% Day Change: -0.67 | |
| Week Change: -1.87% Year-to-date Change: -14.5% | |
| VC Links: Profile News Message Board | |
| Charts:- Daily , Weekly | |
| Add VC to Watchlist: View: Get Complete VC Trend Analysis ➞ | |
 | IIIN Insteel Industries, Inc. |
| Sector: Materials | |
| SubSector: Steel & Iron | |
| MarketCap: 269.488 Millions | |
| Recent Price: 32.75 Smart Investing & Trading Score: 0 | |
| Day Percent Change: -1.24% Day Change: -0.41 | |
| Week Change: -4.85% Year-to-date Change: -14.5% | |
| IIIN Links: Profile News Message Board | |
| Charts:- Daily , Weekly | |
| Add IIIN to Watchlist: View: Get Complete IIIN Trend Analysis ➞ | |
 | REPL Replimune Group, Inc. |
| Sector: Health Care | |
| SubSector: Biotechnology | |
| MarketCap: 367.885 Millions | |
| Recent Price: 7.21 Smart Investing & Trading Score: 42 | |
| Day Percent Change: 0.84% Day Change: 0.06 | |
| Week Change: 0.98% Year-to-date Change: -14.5% | |
| REPL Links: Profile News Message Board | |
| Charts:- Daily , Weekly | |
| Add REPL to Watchlist: View: Get Complete REPL Trend Analysis ➞ | |
 | DIN Dine Brands Global, Inc. |
| Sector: Services & Goods | |
| SubSector: Restaurants | |
| MarketCap: 421.17 Millions | |
| Recent Price: 42.43 Smart Investing & Trading Score: 10 | |
| Day Percent Change: -2.21% Day Change: -0.96 | |
| Week Change: -0.91% Year-to-date Change: -14.5% | |
| DIN Links: Profile News Message Board | |
| Charts:- Daily , Weekly | |
| Add DIN to Watchlist: View: Get Complete DIN Trend Analysis ➞ | |
| Too many stocks? View smallcap stocks filtered by marketcap & sector |
| Marketcap: All SmallCap Stocks (default-no microcap), Large, Mid-Range, Small & MicroCap |
| Sector: Tech, Finance, Energy, Staples, Retail, Industrial, Materials, Utilities & Medical |
|
Best Stocks Today 12Stocks.com |
© 2024 12Stocks.com Terms & Conditions Privacy Contact Us
All Information Provided Only For Education And Not To Be Used For Investing or Trading. See Terms & Conditions


One More Thing ... Get Best Stocks Delivered Daily!
Never Ever Miss A Move With Our Top Ten Stocks Lists
Find Best Stocks In Any Market - Bull or Bear Market
Take A Peek At Our Top Ten Stocks Lists: Daily, Weekly, Year-to-Date & Top Trends
Find Best Stocks In Any Market - Bull or Bear Market
Take A Peek At Our Top Ten Stocks Lists: Daily, Weekly, Year-to-Date & Top Trends
Smallcap Stocks With Best Up Trends [0-bearish to 100-bullish]: Vanda [100], Zuora [100], ALX Oncology[100], ProKidney [100], PrimeEnergy Resources[100], IMAX [100], Envestnet [100], Intra-Cellular Therapies[100], Dorian LPG[95], Victory Capital[95], Oscar Health[95]
Best Smallcap Stocks Year-to-Date:
Agenus [552.25%], CareMax [416.49%], Janux [346.07%], Viking [257.17%], Alpine Immune[238.55%], Super Micro[237.75%], Arcutis Bio[217.34%], Longboard [177.91%], Avidity Biosciences[160.56%], Vera [158.46%], Stoke [122.81%] Best Smallcap Stocks This Week:
ProKidney [61.71%], Macatawa Bank[42.75%], Snap One[29.85%], Vanda [27.18%], ALX Oncology[23.41%], Intra-Cellular Therapies[16.41%], Escalade [13.71%], Karyopharm [13.11%], Encore Wire[10.06%], Zuora [10%], Direxion Daily[8.81%] Best Smallcap Stocks Daily:
Vanda [29.38%], Karyopharm [25.45%], Cutera [18.41%], Children s[16.46%], WW [14.10%], Lineage Cell[12.17%], Zuora [11.69%], ALX Oncology[10.97%], Marinus [10.77%], Acrivon [9.19%], Cue Biopharma[9.03%]