
 Login Sign Up


| |||||
 |  | ||||

| 12Stocks.com Market Intelligence |
Best SmallCap Stocks
|
| In a hurry? Small Cap Stock Lists: Performance Trends Table, Stock Charts
Sort Small Cap stocks: Daily, Weekly, Year-to-Date, Market Cap & Trends. Filter Small Cap stocks list by sector: Show all, Tech, Finance, Energy, Staples, Retail, Industrial, Materials, Utilities and HealthCare Filter Small Cap stocks list by size: All Large Medium Small and MicroCap |
| 12Stocks.com Small Cap Stocks Performances & Trends Daily | |||||||||
|
|  The overall Smart Investing & Trading Score is 0 (0-bearish to 100-bullish) which puts Small Cap index in short term bearish trend. The Smart Investing & Trading Score from previous trading session is 18 and hence a deterioration of trend.
| ||||||||
Here are the Smart Investing & Trading Scores of the most requested small cap stocks at 12Stocks.com (click stock name for detailed review):
|


| 12Stocks.com: Investing in Smallcap Index with Stocks | |
|
The following table helps investors and traders sort through current performance and trends (as measured by Smart Investing & Trading Score) of various
stocks in the Smallcap Index. Quick View: Move mouse or cursor over stock symbol (ticker) to view short-term technical chart and over stock name to view long term chart. Click on  to add stock symbol to your watchlist and to add stock symbol to your watchlist and  to view watchlist. Click on any ticker or stock name for detailed market intelligence report for that stock. to view watchlist. Click on any ticker or stock name for detailed market intelligence report for that stock. |
12Stocks.com Performance of Stocks in Smallcap Index
| Ticker | Stock Name | Watchlist | Category | Recent Price | Smart Investing & Trading Score | Change % | Weekly Change% |
| WEAV | Weave |   | Technology | 9.00 | 59 | -0.33% | 2.16% |
| SMRT | SmartRent | | Technology | 2.40 | 27 | 0.42% | 2.13% |
| NMRK | Newmark Group | | Financials | 10.12 | 42 | 0.30% | 2.12% |
| AZZ | AZZ | | Industrials | 78.14 | 44 | -0.28% | 1.96% |
| MGPI | MGP Ingredients | | Consumer Staples | 74.52 | 38 | 0.49% | 1.89% |
| IMAX | IMAX | | Services & Goods | 15.40 | 25 | 0.65% | 1.85% |
| CAKE | Cheesecake Factory | | Services & Goods | 39.47 | 83 | -2.11% | 1.73% |
| MD | MEDNAX | | Health Care | 7.24 | 52 | -1.63% | 1.69% |
| ADUS | Addus HomeCare | | Health Care | 116.43 | 63 | 0.25% | 1.65% |
| XPOF | Xponential Fitness | | Services & Goods | 11.27 | 50 | -3.26% | 1.62% |
| TTGT | TechTarget | | Technology | 30.94 | 42 | -0.48% | 1.54% |
| HMST | HomeStreet | | Financials | 8.76 | 42 | 2.34% | 1.51% |
| DHC | Diversified Healthcare | | Financials | 2.82 | 78 | 1.08% | 1.44% |
| MOND | Mondee | | Services & Goods | 2.11 | 42 | 2.93% | 1.44% |
| SST | System1 | | Industrials | 1.44 | 22 | -8.28% | 1.41% |
| PRIM | Primoris Services | | Industrials | 53.11 | 61 | -1.19% | 1.39% |
| LADR | Ladder Capital | | Financials | 10.97 | 33 | -0.36% | 1.29% |
| ABR | Arbor Realty | | Financials | 13.69 | 71 | -1.01% | 1.26% |
| RXST | RxSight | | Health Care | 57.89 | 51 | -2.44% | 1.17% |
| CDRE | Cadre | | Industrials | 32.80 | 25 | -3.42% | 1.11% |
| PMT | PennyMac Mortgage | | Financials | 13.79 | 57 | 1.17% | 1.10% |
| SXI | Standex | | Industrials | 163.02 | 7 | -1.60% | 1.09% |
| BFS | Saul Centers | | Financials | 36.74 | 67 | -0.51% | 1.07% |
| AHH | Armada Hoffler | | Financials | 11.04 | 61 | -0.63% | 1.01% |
| SPNS | Sapiens | | Technology | 33.17 | 38 | -2.33% | 0.97% |
| For chart view version of above stock list: Chart View ➞ 0 - 25 , 25 - 50 , 50 - 75 , 75 - 100 , 100 - 125 , 125 - 150 , 150 - 175 , 175 - 200 , 200 - 225 , 225 - 250 , 250 - 275 , 275 - 300 , 300 - 325 , 325 - 350 | ||
 | Click To Change The Sort Order: By Market Cap or Company Size Performance: Year-to-date, Week and Day |  |
| Too many stocks? View smallcap stocks filtered by marketcap & sector |
| Marketcap: All SmallCap Stocks (default-no microcap), Large, Mid-Range, Small |
| Smallcap Sector: Tech, Finance, Energy, Staples, Retail, Industrial, Materials, & Medical |
|
Get the most comprehensive stock market coverage daily at 12Stocks.com ➞ Best Stocks Today ➞ Best Stocks Weekly ➞ Best Stocks Year-to-Date ➞ Best Stocks Trends ➞  Best Stocks Today 12Stocks.com Best Nasdaq Stocks ➞ Best S&P 500 Stocks ➞ Best Tech Stocks ➞ Best Biotech Stocks ➞ |
| Detailed Overview of SmallCap Stocks |
| SmallCap Technical Overview, Leaders & Laggards, Top SmallCap ETF Funds & Detailed SmallCap Stocks List, Charts, Trends & More |
| Smallcap: Technical Analysis, Trends & YTD Performance | |
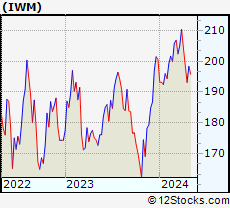
| SmallCap segment as represented by
IWM, an exchange-traded fund [ETF], holds basket of thousands of smallcap stocks from across all major sectors of the US stock market. The smallcap index (contains stocks like Riverbed & Sotheby's) is down by -0.99% and is currently underperforming the overall market by -13.41% year-to-date. Below is a quick view of technical charts and trends: | |
 IWM Weekly Chart |
|
| Long Term Trend: Not Good | |
| Medium Term Trend: Not Good | |
 IWM Daily Chart |
|
| Short Term Trend: Not Good | |
| Overall Trend Score: 0 | |
| YTD Performance: -0.99% | |
| **Trend Scores & Views Are Only For Educational Purposes And Not For Investing | |
| 12Stocks.com: Top Performing Small Cap Index Stocks | ||||||||||||||||||||||||||||||||||||||||||||||||
 The top performing Small Cap Index stocks year to date are
Now, more recently, over last week, the top performing Small Cap Index stocks on the move are


|
||||||||||||||||||||||||||||||||||||||||||||||||
| 12Stocks.com: Investing in Smallcap Index using Exchange Traded Funds | |
|
The following table shows list of key exchange traded funds (ETF) that
help investors track Smallcap index. The following list also includes leveraged ETF funds that track twice or thrice the daily returns of Smallcap indices. Short or inverse ETF funds move in the opposite direction to the index they track and are useful during market pullbacks or during bear markets. Quick View: Move mouse or cursor over ETF symbol (ticker) to view short-term technical chart and over ETF name to view long term chart. Click on ticker or stock name for detailed view. Click on to add stock symbol to your watchlist and to view watchlist. |
12Stocks.com List of ETFs that track Smallcap Index
| Ticker | ETF Name | Watchlist | Recent Price | Smart Investing & Trading Score | Change % | Week % | Year-to-date % |
| IWM | iShares Russell 2000 | | 198.73 | 0 | -1.59 | -1.23 | -0.99% |
| IJR | iShares Core S&P Small-Cap | | 104.68 | 0 | -1.49 | -2.23 | -3.3% |
| VTWO | Vanguard Russell 2000 ETF | | 80.61 | 0 | -1.56 | -0.95 | -0.61% |
| IWN | iShares Russell 2000 Value | | 148.78 | 0 | -1.54 | -2.19 | -4.22% |
| IWO | iShares Russell 2000 Growth | | 258.17 | 8 | -1.49 | -0.89 | 2.36% |
| IJS | iShares S&P Small-Cap 600 Value | | 95.28 | 0 | -1.41 | -2.71 | -7.56% |
| IJT | iShares S&P Small-Cap 600 Growth | | 125.96 | 0 | -1.69 | -1.68 | 0.66% |
| XSLV | PowerShares S&P SmallCap Low Volatil ETF | | 42.74 | 8 | -1.01 | -1.5 | -3.19% |
| SMLV | SPDR SSGA US Small Cap Low Volatil ETF | | 106.36 | 8 | -1.01 | -1.56 | -5.47% |
| SDD | ProShares UltraShort SmallCap600 | | 19.87 | 100 | 2.63 | 4.37 | 7.83% |
| SBB | ProShares Short SmallCap600 | | 16.68 | 100 | 1.90 | 2.39 | 4.71% |
| SAA | ProShares Ultra SmallCap600 | | 22.88 | 25 | -1.26 | -1.83 | -8.3% |
| 12Stocks.com: Charts, Trends, Fundamental Data and Performances of SmallCap Stocks | |
|
We now take in-depth look at all SmallCap stocks including charts, multi-period performances and overall trends (as measured by Smart Investing & Trading Score). One can sort SmallCap stocks (click link to choose) by Daily, Weekly and by Year-to-Date performances. Also, one can sort by size of the company or by market capitalization. |
| Select Your Default Chart Type: | |||||
| |||||
| Click on stock symbol or name for detailed view. Click on to add stock symbol to your watchlist and to view watchlist. Quick View: Move mouse or cursor over "Daily" to quickly view daily technical stock chart and over "Weekly" to view weekly technical stock chart. | |||||

 | WEAV Weave Communications, Inc. |
| Sector: Technology | |
| SubSector: Software - Application | |
| MarketCap: 740 Millions | |
| Recent Price: 9.00 Smart Investing & Trading Score: 59 | |
| Day Percent Change: -0.33% Day Change: -0.03 | |
| Week Change: 2.16% Year-to-date Change: -22.6% | |
| WEAV Links: Profile News Message Board | |
| Charts:- Daily , Weekly | |
| Add WEAV to Watchlist: View: Get Complete WEAV Trend Analysis ➞ | |
 | SMRT SmartRent, Inc. |
| Sector: Technology | |
| SubSector: Software - Application | |
| MarketCap: 733 Millions | |
| Recent Price: 2.40 Smart Investing & Trading Score: 27 | |
| Day Percent Change: 0.42% Day Change: 0.01 | |
| Week Change: 2.13% Year-to-date Change: -24.8% | |
| SMRT Links: Profile News Message Board | |
| Charts:- Daily , Weekly | |
| Add SMRT to Watchlist: View: Get Complete SMRT Trend Analysis ➞ | |
 | NMRK Newmark Group, Inc. |
| Sector: Financials | |
| SubSector: Property Management | |
| MarketCap: 767.542 Millions | |
| Recent Price: 10.12 Smart Investing & Trading Score: 42 | |
| Day Percent Change: 0.30% Day Change: 0.03 | |
| Week Change: 2.12% Year-to-date Change: -7.7% | |
| NMRK Links: Profile News Message Board | |
| Charts:- Daily , Weekly | |
| Add NMRK to Watchlist: View: Get Complete NMRK Trend Analysis ➞ | |
 | AZZ AZZ Inc. |
| Sector: Industrials | |
| SubSector: Diversified Machinery | |
| MarketCap: 743.416 Millions | |
| Recent Price: 78.14 Smart Investing & Trading Score: 44 | |
| Day Percent Change: -0.28% Day Change: -0.22 | |
| Week Change: 1.96% Year-to-date Change: 34.5% | |
| AZZ Links: Profile News Message Board | |
| Charts:- Daily , Weekly | |
| Add AZZ to Watchlist: View: Get Complete AZZ Trend Analysis ➞ | |
 | MGPI MGP Ingredients, Inc. |
| Sector: Consumer Staples | |
| SubSector: Beverages - Wineries & Distillers | |
| MarketCap: 502.635 Millions | |
| Recent Price: 74.52 Smart Investing & Trading Score: 38 | |
| Day Percent Change: 0.49% Day Change: 0.36 | |
| Week Change: 1.89% Year-to-date Change: -24.4% | |
| MGPI Links: Profile News Message Board | |
| Charts:- Daily , Weekly | |
| Add MGPI to Watchlist: View: Get Complete MGPI Trend Analysis ➞ | |
 | IMAX IMAX Corporation |
| Sector: Services & Goods | |
| SubSector: Entertainment - Diversified | |
| MarketCap: 874.237 Millions | |
| Recent Price: 15.40 Smart Investing & Trading Score: 25 | |
| Day Percent Change: 0.65% Day Change: 0.10 | |
| Week Change: 1.85% Year-to-date Change: 2.5% | |
| IMAX Links: Profile News Message Board | |
| Charts:- Daily , Weekly | |
| Add IMAX to Watchlist: View: Get Complete IMAX Trend Analysis ➞ | |
 | CAKE The Cheesecake Factory Incorporated |
| Sector: Services & Goods | |
| SubSector: Restaurants | |
| MarketCap: 829 Millions | |
| Recent Price: 39.47 Smart Investing & Trading Score: 83 | |
| Day Percent Change: -2.11% Day Change: -0.85 | |
| Week Change: 1.73% Year-to-date Change: 12.7% | |
| CAKE Links: Profile News Message Board | |
| Charts:- Daily , Weekly | |
| Add CAKE to Watchlist: View: Get Complete CAKE Trend Analysis ➞ | |
 | MD MEDNAX, Inc. |
| Sector: Health Care | |
| SubSector: Specialized Health Services | |
| MarketCap: 913.656 Millions | |
| Recent Price: 7.24 Smart Investing & Trading Score: 52 | |
| Day Percent Change: -1.63% Day Change: -0.12 | |
| Week Change: 1.69% Year-to-date Change: -22.2% | |
| MD Links: Profile News Message Board | |
| Charts:- Daily , Weekly | |
| Add MD to Watchlist: View: Get Complete MD Trend Analysis ➞ | |
 | ADUS Addus HomeCare Corporation |
| Sector: Health Care | |
| SubSector: Home Health Care | |
| MarketCap: 994.795 Millions | |
| Recent Price: 116.43 Smart Investing & Trading Score: 63 | |
| Day Percent Change: 0.25% Day Change: 0.29 | |
| Week Change: 1.65% Year-to-date Change: 25.4% | |
| ADUS Links: Profile News Message Board | |
| Charts:- Daily , Weekly | |
| Add ADUS to Watchlist: View: Get Complete ADUS Trend Analysis ➞ | |
 | XPOF Xponential Fitness, Inc. |
| Sector: Services & Goods | |
| SubSector: Leisure | |
| MarketCap: 811 Millions | |
| Recent Price: 11.27 Smart Investing & Trading Score: 50 | |
| Day Percent Change: -3.26% Day Change: -0.38 | |
| Week Change: 1.62% Year-to-date Change: -13.6% | |
| XPOF Links: Profile News Message Board | |
| Charts:- Daily , Weekly | |
| Add XPOF to Watchlist: View: Get Complete XPOF Trend Analysis ➞ | |
 | TTGT TechTarget, Inc. |
| Sector: Technology | |
| SubSector: Internet Information Providers | |
| MarketCap: 560.78 Millions | |
| Recent Price: 30.94 Smart Investing & Trading Score: 42 | |
| Day Percent Change: -0.48% Day Change: -0.15 | |
| Week Change: 1.54% Year-to-date Change: -11.2% | |
| TTGT Links: Profile News Message Board | |
| Charts:- Daily , Weekly | |
| Add TTGT to Watchlist: View: Get Complete TTGT Trend Analysis ➞ | |
 | HMST HomeStreet, Inc. |
| Sector: Financials | |
| SubSector: Savings & Loans | |
| MarketCap: 535.33 Millions | |
| Recent Price: 8.76 Smart Investing & Trading Score: 42 | |
| Day Percent Change: 2.34% Day Change: 0.20 | |
| Week Change: 1.51% Year-to-date Change: -15.0% | |
| HMST Links: Profile News Message Board | |
| Charts:- Daily , Weekly | |
| Add HMST to Watchlist: View: Get Complete HMST Trend Analysis ➞ | |
 | DHC Diversified Healthcare Trust |
| Sector: Financials | |
| SubSector: REIT - Healthcare Facilities | |
| MarketCap: 814.114 Millions | |
| Recent Price: 2.82 Smart Investing & Trading Score: 78 | |
| Day Percent Change: 1.08% Day Change: 0.03 | |
| Week Change: 1.44% Year-to-date Change: -24.6% | |
| DHC Links: Profile News Message Board | |
| Charts:- Daily , Weekly | |
| Add DHC to Watchlist: View: Get Complete DHC Trend Analysis ➞ | |
 | MOND Mondee Holdings, Inc. |
| Sector: Services & Goods | |
| SubSector: Travel Services | |
| MarketCap: 744 Millions | |
| Recent Price: 2.11 Smart Investing & Trading Score: 42 | |
| Day Percent Change: 2.93% Day Change: 0.06 | |
| Week Change: 1.44% Year-to-date Change: -24.1% | |
| MOND Links: Profile News Message Board | |
| Charts:- Daily , Weekly | |
| Add MOND to Watchlist: View: Get Complete MOND Trend Analysis ➞ | |
 | SST System1, Inc. |
| Sector: Industrials | |
| SubSector: Specialty Business Services | |
| MarketCap: 504 Millions | |
| Recent Price: 1.44 Smart Investing & Trading Score: 22 | |
| Day Percent Change: -8.28% Day Change: -0.13 | |
| Week Change: 1.41% Year-to-date Change: -40.3% | |
| SST Links: Profile News Message Board | |
| Charts:- Daily , Weekly | |
| Add SST to Watchlist: View: Get Complete SST Trend Analysis ➞ | |
 | PRIM Primoris Services Corporation |
| Sector: Industrials | |
| SubSector: Heavy Construction | |
| MarketCap: 931.895 Millions | |
| Recent Price: 53.11 Smart Investing & Trading Score: 61 | |
| Day Percent Change: -1.19% Day Change: -0.64 | |
| Week Change: 1.39% Year-to-date Change: 59.9% | |
| PRIM Links: Profile News Message Board | |
| Charts:- Daily , Weekly | |
| Add PRIM to Watchlist: View: Get Complete PRIM Trend Analysis ➞ | |
 | LADR Ladder Capital Corp |
| Sector: Financials | |
| SubSector: Mortgage Investment | |
| MarketCap: 660.039 Millions | |
| Recent Price: 10.97 Smart Investing & Trading Score: 33 | |
| Day Percent Change: -0.36% Day Change: -0.04 | |
| Week Change: 1.29% Year-to-date Change: -4.7% | |
| LADR Links: Profile News Message Board | |
| Charts:- Daily , Weekly | |
| Add LADR to Watchlist: View: Get Complete LADR Trend Analysis ➞ | |
 | ABR Arbor Realty Trust, Inc. |
| Sector: Financials | |
| SubSector: Mortgage Investment | |
| MarketCap: 648.939 Millions | |
| Recent Price: 13.69 Smart Investing & Trading Score: 71 | |
| Day Percent Change: -1.01% Day Change: -0.14 | |
| Week Change: 1.26% Year-to-date Change: -9.8% | |
| ABR Links: Profile News Message Board | |
| Charts:- Daily , Weekly | |
| Add ABR to Watchlist: View: Get Complete ABR Trend Analysis ➞ | |
 | RXST RxSight, Inc. |
| Sector: Health Care | |
| SubSector: Medical Devices | |
| MarketCap: 893 Millions | |
| Recent Price: 57.89 Smart Investing & Trading Score: 51 | |
| Day Percent Change: -2.44% Day Change: -1.45 | |
| Week Change: 1.17% Year-to-date Change: 44.3% | |
| RXST Links: Profile News Message Board | |
| Charts:- Daily , Weekly | |
| Add RXST to Watchlist: View: Get Complete RXST Trend Analysis ➞ | |
 | CDRE Cadre Holdings, Inc. |
| Sector: Industrials | |
| SubSector: Aerospace & Defense | |
| MarketCap: 817 Millions | |
| Recent Price: 32.80 Smart Investing & Trading Score: 25 | |
| Day Percent Change: -3.42% Day Change: -1.16 | |
| Week Change: 1.11% Year-to-date Change: -0.5% | |
| CDRE Links: Profile News Message Board | |
| Charts:- Daily , Weekly | |
| Add CDRE to Watchlist: View: Get Complete CDRE Trend Analysis ➞ | |
 | PMT PennyMac Mortgage Investment Trust |
| Sector: Financials | |
| SubSector: Mortgage Investment | |
| MarketCap: 917.639 Millions | |
| Recent Price: 13.79 Smart Investing & Trading Score: 57 | |
| Day Percent Change: 1.17% Day Change: 0.16 | |
| Week Change: 1.1% Year-to-date Change: -7.8% | |
| PMT Links: Profile News Message Board | |
| Charts:- Daily , Weekly | |
| Add PMT to Watchlist: View: Get Complete PMT Trend Analysis ➞ | |
 | SXI Standex International Corporation |
| Sector: Industrials | |
| SubSector: Industrial Equipment & Components | |
| MarketCap: 644.109 Millions | |
| Recent Price: 163.02 Smart Investing & Trading Score: 7 | |
| Day Percent Change: -1.60% Day Change: -2.65 | |
| Week Change: 1.09% Year-to-date Change: 2.9% | |
| SXI Links: Profile News Message Board | |
| Charts:- Daily , Weekly | |
| Add SXI to Watchlist: View: Get Complete SXI Trend Analysis ➞ | |
 | BFS Saul Centers, Inc. |
| Sector: Financials | |
| SubSector: REIT - Retail | |
| MarketCap: 689.914 Millions | |
| Recent Price: 36.74 Smart Investing & Trading Score: 67 | |
| Day Percent Change: -0.51% Day Change: -0.19 | |
| Week Change: 1.07% Year-to-date Change: -6.4% | |
| BFS Links: Profile News Message Board | |
| Charts:- Daily , Weekly | |
| Add BFS to Watchlist: View: Get Complete BFS Trend Analysis ➞ | |
 | AHH Armada Hoffler Properties, Inc. |
| Sector: Financials | |
| SubSector: REIT - Diversified | |
| MarketCap: 550.653 Millions | |
| Recent Price: 11.04 Smart Investing & Trading Score: 61 | |
| Day Percent Change: -0.63% Day Change: -0.07 | |
| Week Change: 1.01% Year-to-date Change: -10.8% | |
| AHH Links: Profile News Message Board | |
| Charts:- Daily , Weekly | |
| Add AHH to Watchlist: View: Get Complete AHH Trend Analysis ➞ | |
 | SPNS Sapiens International Corporation N.V. |
| Sector: Technology | |
| SubSector: Business Software & Services | |
| MarketCap: 841.858 Millions | |
| Recent Price: 33.17 Smart Investing & Trading Score: 38 | |
| Day Percent Change: -2.33% Day Change: -0.79 | |
| Week Change: 0.97% Year-to-date Change: 14.6% | |
| SPNS Links: Profile News Message Board | |
| Charts:- Daily , Weekly | |
| Add SPNS to Watchlist: View: Get Complete SPNS Trend Analysis ➞ | |
| For tabular summary view of above stock list: Summary View ➞ 0 - 25 , 25 - 50 , 50 - 75 , 75 - 100 , 100 - 125 , 125 - 150 , 150 - 175 , 175 - 200 , 200 - 225 , 225 - 250 , 250 - 275 , 275 - 300 , 300 - 325 , 325 - 350 | ||
| Click To Change The Sort Order: By Market Cap or Company Size Performance: Year-to-date, Week and Day | |
| Select Chart Type: | ||
| Too many stocks? View smallcap stocks filtered by marketcap & sector |
| Marketcap: All SmallCap Stocks (default-no microcap), Large, Mid-Range, Small & MicroCap |
| Sector: Tech, Finance, Energy, Staples, Retail, Industrial, Materials, Utilities & Medical |
|
Best Stocks Today 12Stocks.com |
© 2024 12Stocks.com Terms & Conditions Privacy Contact Us
All Information Provided Only For Education And Not To Be Used For Investing or Trading. See Terms & Conditions


One More Thing ... Get Best Stocks Delivered Daily!
Never Ever Miss A Move With Our Top Ten Stocks Lists
Find Best Stocks In Any Market - Bull or Bear Market
Take A Peek At Our Top Ten Stocks Lists: Daily, Weekly, Year-to-Date & Top Trends
Find Best Stocks In Any Market - Bull or Bear Market
Take A Peek At Our Top Ten Stocks Lists: Daily, Weekly, Year-to-Date & Top Trends
Smallcap Stocks With Best Up Trends [0-bearish to 100-bullish]: 2U [100], Li-Cycle [100], UroGen Pharma[100], Scilex Holding[100], Chimera [100], Aurinia [100], Phathom [100], Cinemark [100], Terns [100], BRC [100], Rackspace [100]
Best Smallcap Stocks Year-to-Date:
Li-Cycle [581.56%], 2U [508.94%], CareMax [467.01%], Dominion Midstream[411.32%], Avidity Biosciences[338.5%], Janux [290.88%], Summit [221.46%], Stoke [208.94%], Longboard [203.11%], Novavax [200%], Super Micro[197.1%] Best Smallcap Stocks This Week:
Dominion Midstream[683.67%], Kaltura [49.88%], Li-Cycle [49.82%], Avidity Biosciences[49.02%], Scilex Holding[47.71%], UroGen Pharma[45.34%], Biomea Fusion[36.23%], Tango [29.42%], Nerdy [27.89%], Cipher Mining[22.83%], FiscalNote [21.93%] Best Smallcap Stocks Daily:
2U [3192.31%], Li-Cycle [18.44%], Disc Medicine[18.16%], Ocular Therapeutix[14.09%], FTC Solar[11.40%], UroGen Pharma[9.84%], DMC Global[9.15%], Scilex Holding[8.05%], Tutor Perini[7.92%], Grindr [7.64%], Chimera [7.54%]