
 Login Sign Up


| |||||
 |  | ||||

| 12Stocks.com Market Intelligence |
Best SmallCap Stocks
|
| In a hurry? Small Cap Stock Lists: Performance Trends Table, Stock Charts
Sort Small Cap stocks: Daily, Weekly, Year-to-Date, Market Cap & Trends. Filter Small Cap stocks list by sector: Show all, Tech, Finance, Energy, Staples, Retail, Industrial, Materials, Utilities and HealthCare Filter Small Cap stocks list by size: All Large Medium Small and MicroCap |
| 12Stocks.com Small Cap Stocks Performances & Trends Daily | |||||||||
|
|  The overall Smart Investing & Trading Score is 0 (0-bearish to 100-bullish) which puts Small Cap index in short term bearish trend. The Smart Investing & Trading Score from previous trading session is 18 and hence a deterioration of trend.
| ||||||||
Here are the Smart Investing & Trading Scores of the most requested small cap stocks at 12Stocks.com (click stock name for detailed review):
|


| 12Stocks.com: Investing in Smallcap Index with Stocks | |
|
The following table helps investors and traders sort through current performance and trends (as measured by Smart Investing & Trading Score) of various
stocks in the Smallcap Index. Quick View: Move mouse or cursor over stock symbol (ticker) to view short-term technical chart and over stock name to view long term chart. Click on  to add stock symbol to your watchlist and to add stock symbol to your watchlist and  to view watchlist. Click on any ticker or stock name for detailed market intelligence report for that stock. to view watchlist. Click on any ticker or stock name for detailed market intelligence report for that stock. |
12Stocks.com Performance of Stocks in Smallcap Index
| Ticker | Stock Name | Watchlist | Category | Recent Price | Smart Investing & Trading Score | Change % | Weekly Change% |
| WASH | Washington Trust |   | Financials | 25.26 | 25 | -1.44% | -2.58% |
| AGM | Federal Agricultural | | Financials | 169.46 | 8 | -2.26% | -2.68% |
| SRCE | 1st Source | | Financials | 49.36 | 8 | -1.46% | -2.70% |
| NPO | EnPro Industries | | Industrials | 144.72 | 8 | -2.90% | -2.70% |
| ARCB | ArcBest | | Transports | 105.49 | 25 | -2.59% | -2.70% |
| VTS | Vitesse Energy | | Energy | 23.38 | 0 | -3.03% | -2.75% |
| TRS | TriMas | | Industrials | 25.40 | 0 | -2.38% | -2.76% |
| PWP | Perella Weinberg | | Financials | 14.06 | 23 | -0.99% | -2.77% |
| SBSI | Southside Bancshares | | Financials | 25.53 | 0 | -1.69% | -2.78% |
| KIDS | OrthoPediatrics | | Health Care | 29.30 | 23 | -5.48% | -2.85% |
| UTL | Unitil | | Utilities | 49.40 | 0 | -1.79% | -2.87% |
| LYEL | Lyell Immunopharma | | Health Care | 2.36 | 26 | -8.88% | -2.88% |
| LAW | CS Disco | | Technology | 5.72 | 17 | -4.83% | -2.89% |
| NMIH | NMI | | Financials | 31.77 | 8 | -1.43% | -2.90% |
| PATK | Patrick Industries | | Industrials | 103.50 | 10 | -1.57% | -2.94% |
| BRKL | Brookline Bancorp | | Financials | 8.15 | 0 | -1.45% | -2.98% |
| HY | Hyster-Yale Materials | | Consumer Staples | 72.19 | 38 | -1.47% | -2.98% |
| FCF | First Commonwealth | | Financials | 12.88 | 18 | -1.30% | -3.01% |
| UPWK | Upwork | | Technology | 10.39 | 17 | -0.29% | -3.08% |
| CBL | CBL & Associates Properties | | Financials | 21.87 | 35 | -0.18% | -3.10% |
| AMWD | American Woodmark | | Consumer Staples | 80.56 | 10 | -2.61% | -3.13% |
| BHLB | Berkshire Hills | | Financials | 20.97 | 18 | -1.36% | -3.14% |
| PSFE | Paysafe | | Technology | 17.54 | 36 | -2.61% | -3.15% |
| CTBI | Community Trust | | Financials | 40.61 | 0 | -1.62% | -3.17% |
| DNOW | NOW | | Energy | 13.07 | 0 | -3.19% | -3.19% |
| For chart view version of above stock list: Chart View ➞ 0 - 25 , 25 - 50 , 50 - 75 , 75 - 100 , 100 - 125 , 125 - 150 , 150 - 175 , 175 - 200 , 200 - 225 , 225 - 250 , 250 - 275 , 275 - 300 , 300 - 325 , 325 - 350 | ||
 | Click To Change The Sort Order: By Market Cap or Company Size Performance: Year-to-date, Week and Day |  |
| Too many stocks? View smallcap stocks filtered by marketcap & sector |
| Marketcap: All SmallCap Stocks (default-no microcap), Large, Mid-Range, Small |
| Smallcap Sector: Tech, Finance, Energy, Staples, Retail, Industrial, Materials, & Medical |
|
Get the most comprehensive stock market coverage daily at 12Stocks.com ➞ Best Stocks Today ➞ Best Stocks Weekly ➞ Best Stocks Year-to-Date ➞ Best Stocks Trends ➞  Best Stocks Today 12Stocks.com Best Nasdaq Stocks ➞ Best S&P 500 Stocks ➞ Best Tech Stocks ➞ Best Biotech Stocks ➞ |
| Detailed Overview of SmallCap Stocks |
| SmallCap Technical Overview, Leaders & Laggards, Top SmallCap ETF Funds & Detailed SmallCap Stocks List, Charts, Trends & More |
| Smallcap: Technical Analysis, Trends & YTD Performance | |
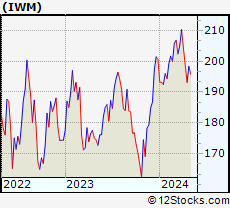
| SmallCap segment as represented by
IWM, an exchange-traded fund [ETF], holds basket of thousands of smallcap stocks from across all major sectors of the US stock market. The smallcap index (contains stocks like Riverbed & Sotheby's) is down by -0.99% and is currently underperforming the overall market by -13.41% year-to-date. Below is a quick view of technical charts and trends: | |
 IWM Weekly Chart |
|
| Long Term Trend: Not Good | |
| Medium Term Trend: Not Good | |
 IWM Daily Chart |
|
| Short Term Trend: Not Good | |
| Overall Trend Score: 0 | |
| YTD Performance: -0.99% | |
| **Trend Scores & Views Are Only For Educational Purposes And Not For Investing | |
| 12Stocks.com: Top Performing Small Cap Index Stocks | ||||||||||||||||||||||||||||||||||||||||||||||||
 The top performing Small Cap Index stocks year to date are
Now, more recently, over last week, the top performing Small Cap Index stocks on the move are


|
||||||||||||||||||||||||||||||||||||||||||||||||
| 12Stocks.com: Investing in Smallcap Index using Exchange Traded Funds | |
|
The following table shows list of key exchange traded funds (ETF) that
help investors track Smallcap index. The following list also includes leveraged ETF funds that track twice or thrice the daily returns of Smallcap indices. Short or inverse ETF funds move in the opposite direction to the index they track and are useful during market pullbacks or during bear markets. Quick View: Move mouse or cursor over ETF symbol (ticker) to view short-term technical chart and over ETF name to view long term chart. Click on ticker or stock name for detailed view. Click on to add stock symbol to your watchlist and to view watchlist. |
12Stocks.com List of ETFs that track Smallcap Index
| Ticker | ETF Name | Watchlist | Recent Price | Smart Investing & Trading Score | Change % | Week % | Year-to-date % |
| IWM | iShares Russell 2000 | | 198.73 | 0 | -1.59 | -1.23 | -0.99% |
| IJR | iShares Core S&P Small-Cap | | 104.68 | 0 | -1.49 | -2.23 | -3.3% |
| VTWO | Vanguard Russell 2000 ETF | | 80.61 | 0 | -1.56 | -0.95 | -0.61% |
| IWN | iShares Russell 2000 Value | | 148.78 | 0 | -1.54 | -2.19 | -4.22% |
| IWO | iShares Russell 2000 Growth | | 258.17 | 8 | -1.49 | -0.89 | 2.36% |
| IJS | iShares S&P Small-Cap 600 Value | | 95.28 | 0 | -1.41 | -2.71 | -7.56% |
| IJT | iShares S&P Small-Cap 600 Growth | | 125.96 | 0 | -1.69 | -1.68 | 0.66% |
| XSLV | PowerShares S&P SmallCap Low Volatil ETF | | 42.74 | 8 | -1.01 | -1.5 | -3.19% |
| SMLV | SPDR SSGA US Small Cap Low Volatil ETF | | 106.36 | 8 | -1.01 | -1.56 | -5.47% |
| SDD | ProShares UltraShort SmallCap600 | | 19.87 | 100 | 2.63 | 4.37 | 7.83% |
| SBB | ProShares Short SmallCap600 | | 16.68 | 100 | 1.90 | 2.39 | 4.71% |
| SAA | ProShares Ultra SmallCap600 | | 22.88 | 25 | -1.26 | -1.83 | -8.3% |
| 12Stocks.com: Charts, Trends, Fundamental Data and Performances of SmallCap Stocks | |
|
We now take in-depth look at all SmallCap stocks including charts, multi-period performances and overall trends (as measured by Smart Investing & Trading Score). One can sort SmallCap stocks (click link to choose) by Daily, Weekly and by Year-to-Date performances. Also, one can sort by size of the company or by market capitalization. |
| Select Your Default Chart Type: | |||||
| |||||
| Click on stock symbol or name for detailed view. Click on to add stock symbol to your watchlist and to view watchlist. Quick View: Move mouse or cursor over "Daily" to quickly view daily technical stock chart and over "Weekly" to view weekly technical stock chart. | |||||

 | WASH Washington Trust Bancorp, Inc. |
| Sector: Financials | |
| SubSector: Regional - Northeast Banks | |
| MarketCap: 590.099 Millions | |
| Recent Price: 25.26 Smart Investing & Trading Score: 25 | |
| Day Percent Change: -1.44% Day Change: -0.37 | |
| Week Change: -2.58% Year-to-date Change: -22.0% | |
| WASH Links: Profile News Message Board | |
| Charts:- Daily , Weekly | |
| Add WASH to Watchlist: View: Get Complete WASH Trend Analysis ➞ | |
 | AGM Federal Agricultural Mortgage Corporation |
| Sector: Financials | |
| SubSector: Credit Services | |
| MarketCap: 542.008 Millions | |
| Recent Price: 169.46 Smart Investing & Trading Score: 8 | |
| Day Percent Change: -2.26% Day Change: -3.91 | |
| Week Change: -2.68% Year-to-date Change: -11.4% | |
| AGM Links: Profile News Message Board | |
| Charts:- Daily , Weekly | |
| Add AGM to Watchlist: View: Get Complete AGM Trend Analysis ➞ | |
 | SRCE 1st Source Corporation |
| Sector: Financials | |
| SubSector: Regional - Midwest Banks | |
| MarketCap: 784.77 Millions | |
| Recent Price: 49.36 Smart Investing & Trading Score: 8 | |
| Day Percent Change: -1.46% Day Change: -0.73 | |
| Week Change: -2.7% Year-to-date Change: -10.2% | |
| SRCE Links: Profile News Message Board | |
| Charts:- Daily , Weekly | |
| Add SRCE to Watchlist: View: Get Complete SRCE Trend Analysis ➞ | |
 | NPO EnPro Industries, Inc. |
| Sector: Industrials | |
| SubSector: Industrial Equipment & Components | |
| MarketCap: 734.309 Millions | |
| Recent Price: 144.72 Smart Investing & Trading Score: 8 | |
| Day Percent Change: -2.90% Day Change: -4.32 | |
| Week Change: -2.7% Year-to-date Change: -7.7% | |
| NPO Links: Profile News Message Board | |
| Charts:- Daily , Weekly | |
| Add NPO to Watchlist: View: Get Complete NPO Trend Analysis ➞ | |
 | ARCB ArcBest Corporation |
| Sector: Transports | |
| SubSector: Trucking | |
| MarketCap: 515.415 Millions | |
| Recent Price: 105.49 Smart Investing & Trading Score: 25 | |
| Day Percent Change: -2.59% Day Change: -2.81 | |
| Week Change: -2.7% Year-to-date Change: -12.3% | |
| ARCB Links: Profile News Message Board | |
| Charts:- Daily , Weekly | |
| Add ARCB to Watchlist: View: Get Complete ARCB Trend Analysis ➞ | |
 | VTS Vitesse Energy, Inc. |
| Sector: Energy | |
| SubSector: Oil & Gas E&P | |
| MarketCap: 639 Millions | |
| Recent Price: 23.38 Smart Investing & Trading Score: 0 | |
| Day Percent Change: -3.03% Day Change: -0.73 | |
| Week Change: -2.75% Year-to-date Change: 5.6% | |
| VTS Links: Profile News Message Board | |
| Charts:- Daily , Weekly | |
| Add VTS to Watchlist: View: Get Complete VTS Trend Analysis ➞ | |
 | TRS TriMas Corporation |
| Sector: Industrials | |
| SubSector: Industrial Equipment & Components | |
| MarketCap: 963.509 Millions | |
| Recent Price: 25.40 Smart Investing & Trading Score: 0 | |
| Day Percent Change: -2.38% Day Change: -0.62 | |
| Week Change: -2.76% Year-to-date Change: 0.3% | |
| TRS Links: Profile News Message Board | |
| Charts:- Daily , Weekly | |
| Add TRS to Watchlist: View: Get Complete TRS Trend Analysis ➞ | |
 | PWP Perella Weinberg Partners |
| Sector: Financials | |
| SubSector: Capital Markets | |
| MarketCap: 705 Millions | |
| Recent Price: 14.06 Smart Investing & Trading Score: 23 | |
| Day Percent Change: -0.99% Day Change: -0.14 | |
| Week Change: -2.77% Year-to-date Change: 13.9% | |
| PWP Links: Profile News Message Board | |
| Charts:- Daily , Weekly | |
| Add PWP to Watchlist: View: Get Complete PWP Trend Analysis ➞ | |
 | SBSI Southside Bancshares, Inc. |
| Sector: Financials | |
| SubSector: Regional - Mid-Atlantic Banks | |
| MarketCap: 971.259 Millions | |
| Recent Price: 25.53 Smart Investing & Trading Score: 0 | |
| Day Percent Change: -1.69% Day Change: -0.44 | |
| Week Change: -2.78% Year-to-date Change: -18.5% | |
| SBSI Links: Profile News Message Board | |
| Charts:- Daily , Weekly | |
| Add SBSI to Watchlist: View: Get Complete SBSI Trend Analysis ➞ | |
 | KIDS OrthoPediatrics Corp. |
| Sector: Health Care | |
| SubSector: Medical Appliances & Equipment | |
| MarketCap: 742.28 Millions | |
| Recent Price: 29.30 Smart Investing & Trading Score: 23 | |
| Day Percent Change: -5.48% Day Change: -1.70 | |
| Week Change: -2.85% Year-to-date Change: -9.9% | |
| KIDS Links: Profile News Message Board | |
| Charts:- Daily , Weekly | |
| Add KIDS to Watchlist: View: Get Complete KIDS Trend Analysis ➞ | |
 | UTL Unitil Corporation |
| Sector: Utilities | |
| SubSector: Diversified Utilities | |
| MarketCap: 756.98 Millions | |
| Recent Price: 49.40 Smart Investing & Trading Score: 0 | |
| Day Percent Change: -1.79% Day Change: -0.90 | |
| Week Change: -2.87% Year-to-date Change: -6.0% | |
| UTL Links: Profile News Message Board | |
| Charts:- Daily , Weekly | |
| Add UTL to Watchlist: View: Get Complete UTL Trend Analysis ➞ | |
 | LYEL Lyell Immunopharma, Inc. |
| Sector: Health Care | |
| SubSector: Biotechnology | |
| MarketCap: 809 Millions | |
| Recent Price: 2.36 Smart Investing & Trading Score: 26 | |
| Day Percent Change: -8.88% Day Change: -0.23 | |
| Week Change: -2.88% Year-to-date Change: 20.1% | |
| LYEL Links: Profile News Message Board | |
| Charts:- Daily , Weekly | |
| Add LYEL to Watchlist: View: Get Complete LYEL Trend Analysis ➞ | |
 | LAW CS Disco, Inc. |
| Sector: Technology | |
| SubSector: Software - Application | |
| MarketCap: 505 Millions | |
| Recent Price: 5.72 Smart Investing & Trading Score: 17 | |
| Day Percent Change: -4.83% Day Change: -0.29 | |
| Week Change: -2.89% Year-to-date Change: -25.1% | |
| LAW Links: Profile News Message Board | |
| Charts:- Daily , Weekly | |
| Add LAW to Watchlist: View: Get Complete LAW Trend Analysis ➞ | |
 | NMIH NMI Holdings, Inc. |
| Sector: Financials | |
| SubSector: Surety & Title Insurance | |
| MarketCap: 816.018 Millions | |
| Recent Price: 31.77 Smart Investing & Trading Score: 8 | |
| Day Percent Change: -1.43% Day Change: -0.46 | |
| Week Change: -2.9% Year-to-date Change: 7.0% | |
| NMIH Links: Profile News Message Board | |
| Charts:- Daily , Weekly | |
| Add NMIH to Watchlist: View: Get Complete NMIH Trend Analysis ➞ | |
 | PATK Patrick Industries, Inc. |
| Sector: Industrials | |
| SubSector: Lumber, Wood Production | |
| MarketCap: 565.838 Millions | |
| Recent Price: 103.50 Smart Investing & Trading Score: 10 | |
| Day Percent Change: -1.57% Day Change: -1.65 | |
| Week Change: -2.94% Year-to-date Change: 3.1% | |
| PATK Links: Profile News Message Board | |
| Charts:- Daily , Weekly | |
| Add PATK to Watchlist: View: Get Complete PATK Trend Analysis ➞ | |
 | BRKL Brookline Bancorp, Inc. |
| Sector: Financials | |
| SubSector: Savings & Loans | |
| MarketCap: 894.43 Millions | |
| Recent Price: 8.15 Smart Investing & Trading Score: 0 | |
| Day Percent Change: -1.45% Day Change: -0.12 | |
| Week Change: -2.98% Year-to-date Change: -25.3% | |
| BRKL Links: Profile News Message Board | |
| Charts:- Daily , Weekly | |
| Add BRKL to Watchlist: View: Get Complete BRKL Trend Analysis ➞ | |
 | HY Hyster-Yale Materials Handling, Inc. |
| Sector: Consumer Staples | |
| SubSector: Trucks & Other Vehicles | |
| MarketCap: 660 Millions | |
| Recent Price: 72.19 Smart Investing & Trading Score: 38 | |
| Day Percent Change: -1.47% Day Change: -1.08 | |
| Week Change: -2.98% Year-to-date Change: 16.1% | |
| HY Links: Profile News Message Board | |
| Charts:- Daily , Weekly | |
| Add HY to Watchlist: View: Get Complete HY Trend Analysis ➞ | |
 | FCF First Commonwealth Financial Corporation |
| Sector: Financials | |
| SubSector: Regional - Northeast Banks | |
| MarketCap: 900.299 Millions | |
| Recent Price: 12.88 Smart Investing & Trading Score: 18 | |
| Day Percent Change: -1.30% Day Change: -0.17 | |
| Week Change: -3.01% Year-to-date Change: -16.6% | |
| FCF Links: Profile News Message Board | |
| Charts:- Daily , Weekly | |
| Add FCF to Watchlist: View: Get Complete FCF Trend Analysis ➞ | |
 | UPWK Upwork Inc. |
| Sector: Technology | |
| SubSector: Internet Information Providers | |
| MarketCap: 815.98 Millions | |
| Recent Price: 10.39 Smart Investing & Trading Score: 17 | |
| Day Percent Change: -0.29% Day Change: -0.03 | |
| Week Change: -3.08% Year-to-date Change: -30.1% | |
| UPWK Links: Profile News Message Board | |
| Charts:- Daily , Weekly | |
| Add UPWK to Watchlist: View: Get Complete UPWK Trend Analysis ➞ | |
 | CBL CBL & Associates Properties, Inc. |
| Sector: Financials | |
| SubSector: REIT - Retail | |
| MarketCap: 690 Millions | |
| Recent Price: 21.87 Smart Investing & Trading Score: 35 | |
| Day Percent Change: -0.18% Day Change: -0.04 | |
| Week Change: -3.1% Year-to-date Change: -10.4% | |
| CBL Links: Profile News Message Board | |
| Charts:- Daily , Weekly | |
| Add CBL to Watchlist: View: Get Complete CBL Trend Analysis ➞ | |
 | AMWD American Woodmark Corporation |
| Sector: Consumer Staples | |
| SubSector: Home Furnishings & Fixtures | |
| MarketCap: 958.435 Millions | |
| Recent Price: 80.56 Smart Investing & Trading Score: 10 | |
| Day Percent Change: -2.61% Day Change: -2.16 | |
| Week Change: -3.13% Year-to-date Change: -13.2% | |
| AMWD Links: Profile News Message Board | |
| Charts:- Daily , Weekly | |
| Add AMWD to Watchlist: View: Get Complete AMWD Trend Analysis ➞ | |
 | BHLB Berkshire Hills Bancorp, Inc. |
| Sector: Financials | |
| SubSector: Savings & Loans | |
| MarketCap: 686.33 Millions | |
| Recent Price: 20.97 Smart Investing & Trading Score: 18 | |
| Day Percent Change: -1.36% Day Change: -0.29 | |
| Week Change: -3.14% Year-to-date Change: -15.6% | |
| BHLB Links: Profile News Message Board | |
| Charts:- Daily , Weekly | |
| Add BHLB to Watchlist: View: Get Complete BHLB Trend Analysis ➞ | |
 | PSFE Paysafe Limited |
| Sector: Technology | |
| SubSector: Software - Infrastructure | |
| MarketCap: 605 Millions | |
| Recent Price: 17.54 Smart Investing & Trading Score: 36 | |
| Day Percent Change: -2.61% Day Change: -0.47 | |
| Week Change: -3.15% Year-to-date Change: 36.0% | |
| PSFE Links: Profile News Message Board | |
| Charts:- Daily , Weekly | |
| Add PSFE to Watchlist: View: Get Complete PSFE Trend Analysis ➞ | |
 | CTBI Community Trust Bancorp, Inc. |
| Sector: Financials | |
| SubSector: Regional - Southeast Banks | |
| MarketCap: 608.435 Millions | |
| Recent Price: 40.61 Smart Investing & Trading Score: 0 | |
| Day Percent Change: -1.62% Day Change: -0.67 | |
| Week Change: -3.17% Year-to-date Change: -7.4% | |
| CTBI Links: Profile News Message Board | |
| Charts:- Daily , Weekly | |
| Add CTBI to Watchlist: View: Get Complete CTBI Trend Analysis ➞ | |
 | DNOW NOW Inc. |
| Sector: Energy | |
| SubSector: Oil & Gas Equipment & Services | |
| MarketCap: 679.661 Millions | |
| Recent Price: 13.07 Smart Investing & Trading Score: 0 | |
| Day Percent Change: -3.19% Day Change: -0.43 | |
| Week Change: -3.19% Year-to-date Change: 15.5% | |
| DNOW Links: Profile News Message Board | |
| Charts:- Daily , Weekly | |
| Add DNOW to Watchlist: View: Get Complete DNOW Trend Analysis ➞ | |
| For tabular summary view of above stock list: Summary View ➞ 0 - 25 , 25 - 50 , 50 - 75 , 75 - 100 , 100 - 125 , 125 - 150 , 150 - 175 , 175 - 200 , 200 - 225 , 225 - 250 , 250 - 275 , 275 - 300 , 300 - 325 , 325 - 350 | ||
| Click To Change The Sort Order: By Market Cap or Company Size Performance: Year-to-date, Week and Day | |
| Select Chart Type: | ||
| Too many stocks? View smallcap stocks filtered by marketcap & sector |
| Marketcap: All SmallCap Stocks (default-no microcap), Large, Mid-Range, Small & MicroCap |
| Sector: Tech, Finance, Energy, Staples, Retail, Industrial, Materials, Utilities & Medical |
|
Best Stocks Today 12Stocks.com |
© 2024 12Stocks.com Terms & Conditions Privacy Contact Us
All Information Provided Only For Education And Not To Be Used For Investing or Trading. See Terms & Conditions


One More Thing ... Get Best Stocks Delivered Daily!
Never Ever Miss A Move With Our Top Ten Stocks Lists
Find Best Stocks In Any Market - Bull or Bear Market
Take A Peek At Our Top Ten Stocks Lists: Daily, Weekly, Year-to-Date & Top Trends
Find Best Stocks In Any Market - Bull or Bear Market
Take A Peek At Our Top Ten Stocks Lists: Daily, Weekly, Year-to-Date & Top Trends
Smallcap Stocks With Best Up Trends [0-bearish to 100-bullish]: 2U [100], Li-Cycle [100], UroGen Pharma[100], Scilex Holding[100], Chimera [100], Aurinia [100], Phathom [100], Cinemark [100], Terns [100], BRC [100], Rackspace [100]
Best Smallcap Stocks Year-to-Date:
Li-Cycle [581.56%], 2U [508.94%], CareMax [467.01%], Dominion Midstream[411.32%], Avidity Biosciences[338.5%], Janux [290.88%], Summit [221.46%], Stoke [208.94%], Longboard [203.11%], Novavax [200%], Super Micro[197.1%] Best Smallcap Stocks This Week:
Dominion Midstream[683.67%], Kaltura [49.88%], Li-Cycle [49.82%], Avidity Biosciences[49.02%], Scilex Holding[47.71%], UroGen Pharma[45.34%], Biomea Fusion[36.23%], Tango [29.42%], Nerdy [27.89%], Cipher Mining[22.83%], FiscalNote [21.93%] Best Smallcap Stocks Daily:
2U [3192.31%], Li-Cycle [18.44%], Disc Medicine[18.16%], Ocular Therapeutix[14.09%], FTC Solar[11.40%], UroGen Pharma[9.84%], DMC Global[9.15%], Scilex Holding[8.05%], Tutor Perini[7.92%], Grindr [7.64%], Chimera [7.54%]