
 Login Sign Up


| |||||
 |  | ||||

| 12Stocks.com Market Intelligence |
Best S&P 500 Stocks
|
On this page, you will find the most comprehensive analysis of S&P 500 stocks and ETFs - from latest trends to performances to charts ➞. First, here are the year-to-date (YTD) performances of the most requested S&P 500 stocks at 12Stocks.com (click stock for review):
| NVIDIA 73% | ||
| Amazon.com 22% | ||
| Google 19% | ||
| Merck 18% | ||
| Walmart 14% | ||
| Caterpillar 13% | ||
| JPMorgan Chase 13% | ||
| Goldman Sachs 12% | ||
| Chevron 8% | ||
| Microsoft 6% | ||
| Johnson & Johnson -4% | ||
| McDonald s -8% | ||
| Apple -10% | ||
| Gilead -19% | ||
| Starbucks -22% | ||
| Boeing -31% | ||
| Intel -39% | ||
| Quick: S&P 500 Stocks Lists: Performances & Trends, S&P 500 Stock Charts
Sort S&P 500 stocks: Daily, Weekly, Year-to-Date, Market Cap & Trends. Filter S&P 500 stocks list by sector: Show all, Tech, Finance, Energy, Staples, Retail, Industrial, Materials, Utilities and HealthCare |
| 12Stocks.com S&P 500 Stocks Performances & Trends Daily Report | |||||||||
|
| 
The overall Smart Investing & Trading Score is 30 (0-bearish to 100-bullish) which puts S&P 500 index in short term bearish to neutral trend. The Smart Investing & Trading Score from previous trading session is 7 and hence an improvement of trend. | ||||||||
Here are the Smart Investing & Trading Scores of the most requested S&P 500 stocks at 12Stocks.com (click stock name for detailed review):
|


| 12Stocks.com: Top Performing S&P 500 Index Stocks | ||||||||||||||||||||||||||||||||||||||||||||||||
 The top performing S&P 500 Index stocks year to date are
Now, more recently, over last week, the top performing S&P 500 Index stocks on the move are


|
||||||||||||||||||||||||||||||||||||||||||||||||
| 12Stocks.com: Investing in S&P 500 Index with Stocks | |
|
The following table helps investors and traders sort through current performance and trends (as measured by Smart Investing & Trading Score) of various
stocks in the S&P 500 Index. Quick View: Move mouse or cursor over stock symbol (ticker) to view short-term technical chart and over stock name to view long term chart. Click on  to add stock symbol to your watchlist and to add stock symbol to your watchlist and  to view watchlist. Click on any ticker or stock name for detailed market intelligence report for that stock. to view watchlist. Click on any ticker or stock name for detailed market intelligence report for that stock. |
12Stocks.com Performance of Stocks in S&P 500 Index
| Ticker | Stock Name | Watchlist | Category | Recent Price | Smart Investing & Trading Score | Change % | YTD Change% |
| VTR | Ventas |   | Financials | 46.22 | 100 | 5.50% | -7.26% |
| MNST | Monster Beverage | | Consumer Staples | 53.41 | 10 | -0.24% | -7.29% |
| CSCO | Cisco Systems | | Technology | 46.81 | 0 | -0.06% | -7.34% |
| BBY | Best Buy | | Services & Goods | 72.44 | 10 | 0.57% | -7.46% |
| ITW | Illinois Tool | | Industrials | 242.04 | 10 | -0.09% | -7.60% |
| SNA | Snap-on | | Industrials | 266.87 | 10 | -0.32% | -7.61% |
| KEYS | Keysight Technologies | | Technology | 146.99 | 17 | 1.41% | -7.61% |
| HON | Honeywell | | Industrials | 193.64 | 32 | -0.85% | -7.66% |
| EL | Estee Lauder | | Consumer Staples | 134.94 | 10 | 5.94% | -7.73% |
| ROST | Ross Stores | | Services & Goods | 127.65 | 10 | -0.13% | -7.76% |
| MCD | McDonald s | | Services & Goods | 273.28 | 40 | -0.42% | -7.83% |
| MGM | MGM Resorts | | Services & Goods | 40.87 | 17 | 2.82% | -8.53% |
| LUV | Southwest Airlines | | Transports | 26.41 | 17 | 2.88% | -8.55% |
| SLB | Schlumberger | | Energy | 47.58 | 17 | 0.89% | -8.57% |
| BX | Blackstone | | Financials | 118.99 | 10 | 1.28% | -9.11% |
| EFX | Equifax | | Financials | 224.50 | 18 | 1.74% | -9.22% |
| LKQ | LKQ | | Consumer Staples | 43.35 | 18 | 0.51% | -9.29% |
| HSIC | Henry Schein | | Services & Goods | 68.58 | 0 | -0.29% | -9.42% |
| JBL | Jabil | | Technology | 115.26 | 10 | 0.77% | -9.53% |
| VICI | VICI Properties | | Financials | 28.80 | 42 | -0.35% | -9.66% |
| POOL | Pool | | Consumer Staples | 360.10 | 10 | 0.17% | -9.68% |
| DRI | Darden Restaurants | | Services & Goods | 147.86 | 0 | -2.18% | -10.01% |
| AAPL | Apple | | Technology | 173.16 | 42 | 2.28% | -10.06% |
| EXPE | Expedia | | Services & Goods | 136.22 | 44 | 2.31% | -10.26% |
| REG | Regency Centers | | Financials | 60.01 | 64 | 1.52% | -10.43% |
| For chart view version of above stock list: Chart View ➞ 0 - 25 , 25 - 50 , 50 - 75 , 75 - 100 , 100 - 125 , 125 - 150 , 150 - 175 , 175 - 200 , 200 - 225 , 225 - 250 , 250 - 275 , 275 - 300 , 300 - 325 , 325 - 350 , 350 - 375 , 375 - 400 , 400 - 425 , 425 - 450 , 450 - 475 , 475 - 500 | ||
 | Click To Change The Sort Order: By Market Cap or Company Size Performance: Year-to-date, Week and Day |  |
|
Get the most comprehensive stock market coverage daily at 12Stocks.com ➞ Best Stocks Today ➞ Best Stocks Weekly ➞ Best Stocks Year-to-Date ➞ Best Stocks Trends ➞  Best Stocks Today 12Stocks.com Best Nasdaq Stocks ➞ Best S&P 500 Stocks ➞ Best Tech Stocks ➞ Best Biotech Stocks ➞ |
| Detailed Overview of S&P 500 Stocks |
| S&P 500 Technical Overview, Leaders & Laggards, Top S&P 500 ETF Funds & Detailed S&P 500 Stocks List, Charts, Trends & More |
| S&P 500: Technical Analysis, Trends & YTD Performance | |
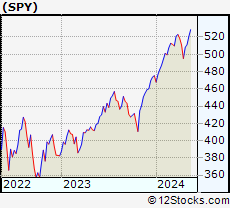
| S&P 500 index as represented by
SPY, an exchange-traded fund [ETF], holds basket of five hundred (mostly largecap) stocks from across all major sectors of the US stock market. The S&P 500 index (contains stocks like Apple and Exxon) is up by 6.25% and is currently outperforming the overall market by 0.63% year-to-date. Below is a quick view of technical charts and trends: | |
 SPY Weekly Chart |
|
| Long Term Trend: Not Good | |
| Medium Term Trend: Not Good | |
 SPY Daily Chart |
|
| Short Term Trend: Deteriorating | |
| Overall Trend Score: 30 | |
| YTD Performance: 6.25% | |
| **Trend Scores & Views Are Only For Educational Purposes And Not For Investing | |
| 12Stocks.com: Investing in S&P 500 Index using Exchange Traded Funds | |
|
The following table shows list of key exchange traded funds (ETF) that
help investors track S&P 500 index. The following list also includes leveraged ETF funds that track twice or thrice the daily returns of S&P 500 indices. Short or inverse ETF funds move in the opposite direction to the index they track and are useful during market pullbacks or during bear markets. Quick View: Move mouse or cursor over ETF symbol (ticker) to view short-term technical chart and over ETF name to view long term chart. Click on ticker or stock name for detailed view. Click on to add stock symbol to your watchlist and to view watchlist. |
12Stocks.com List of ETFs that track S&P 500 Index
| Ticker | ETF Name | Watchlist | Recent Price | Smart Investing & Trading Score | Change % | Week % | Year-to-date % |
| SPY | SPDR S&P 500 ETF | | 505.03 | 30 | 0.94 | -0.64 | 6.25% |
| IVV | iShares Core S&P 500 ETF | | 507.46 | 17 | 0.91 | -0.65 | 6.25% |
| VOO | Vanguard 500 ETF | | 464.22 | 17 | 0.93 | -0.64 | 6.28% |
| OEF | iShares S&P 100 | | 240.23 | 30 | 1.16 | -0.55 | 7.54% |
| SSO | ProShares Ultra S&P500 | | 71.66 | 17 | 1.80 | -1.44 | 10.13% |
| UPRO | ProShares UltraPro S&P500 | | 62.37 | 17 | 2.75 | -2.27 | 13.94% |
| SPXL | Direxion Daily S&P500 Bull 3X ETF | | 118.44 | 17 | 2.68 | -2.23 | 13.9% |
| SH | ProShares Short S&P500 | | 12.38 | 70 | -0.88 | 0.81 | -4.7% |
| SDS | ProShares UltraShort S&P500 | | 26.90 | 83 | -1.82 | 1.39 | -10.09% |
| SPXU | ProShares UltraPro Short S&P500 | | 36.26 | 78 | -2.55 | 2.14 | -15.67% |
| SPXS | Direxion Daily S&P 500 Bear 3X ETF | | 9.81 | 78 | -2.58 | 2.08 | -15.06% |
| 12Stocks.com: Charts, Trends, Fundamental Data and Performances of S&P 500 Stocks | |
|
We now take in-depth look at all S&P 500 stocks including charts, multi-period performances and overall trends (as measured by Smart Investing & Trading Score). One can sort S&P 500 stocks (click link to choose) by Daily, Weekly and by Year-to-Date performances. Also, one can sort by size of the company or by market capitalization. |
| Select Your Default Chart Type: | |||||
| |||||
| Click on stock symbol or name for detailed view. Click on to add stock symbol to your watchlist and to view watchlist. Quick View: Move mouse or cursor over "Daily" to quickly view daily technical stock chart and over "Weekly" to view weekly technical stock chart. | |||||

 | VTR Ventas, Inc. |
| Sector: Financials | |
| SubSector: REIT - Healthcare Facilities | |
| MarketCap: 11180.4 Millions | |
| Recent Price: 46.22 Smart Investing & Trading Score: 100 | |
| Day Percent Change: 5.50% Day Change: 2.41 | |
| Week Change: 5.05% Year-to-date Change: -7.3% | |
| VTR Links: Profile News Message Board | |
| Charts:- Daily , Weekly | |
| Add VTR to Watchlist: View: Get VTR Trend Analysis ➞ | |
 | MNST Monster Beverage Corporation |
| Sector: Consumer Staples | |
| SubSector: Beverages - Soft Drinks | |
| MarketCap: 30126.8 Millions | |
| Recent Price: 53.41 Smart Investing & Trading Score: 10 | |
| Day Percent Change: -0.24% Day Change: -0.13 | |
| Week Change: 0.07% Year-to-date Change: -7.3% | |
| MNST Links: Profile News Message Board | |
| Charts:- Daily , Weekly | |
| Add MNST to Watchlist: View: Get MNST Trend Analysis ➞ | |
 | CSCO Cisco Systems, Inc. |
| Sector: Technology | |
| SubSector: Communication Equipment | |
| MarketCap: 168483 Millions | |
| Recent Price: 46.81 Smart Investing & Trading Score: 0 | |
| Day Percent Change: -0.06% Day Change: -0.03 | |
| Week Change: -2.19% Year-to-date Change: -7.3% | |
| CSCO Links: Profile News Message Board | |
| Charts:- Daily , Weekly | |
| Add CSCO to Watchlist: View: Get CSCO Trend Analysis ➞ | |
 | BBY Best Buy Co., Inc. |
| Sector: Services & Goods | |
| SubSector: Electronics Stores | |
| MarketCap: 15771.3 Millions | |
| Recent Price: 72.44 Smart Investing & Trading Score: 10 | |
| Day Percent Change: 0.57% Day Change: 0.41 | |
| Week Change: -3.48% Year-to-date Change: -7.5% | |
| BBY Links: Profile News Message Board | |
| Charts:- Daily , Weekly | |
| Add BBY to Watchlist: View: Get BBY Trend Analysis ➞ | |
 | ITW Illinois Tool Works Inc. |
| Sector: Industrials | |
| SubSector: Diversified Machinery | |
| MarketCap: 45324.8 Millions | |
| Recent Price: 242.04 Smart Investing & Trading Score: 10 | |
| Day Percent Change: -0.09% Day Change: -0.23 | |
| Week Change: -2.51% Year-to-date Change: -7.6% | |
| ITW Links: Profile News Message Board | |
| Charts:- Daily , Weekly | |
| Add ITW to Watchlist: View: Get ITW Trend Analysis ➞ | |
 | SNA Snap-on Incorporated |
| Sector: Industrials | |
| SubSector: Small Tools & Accessories | |
| MarketCap: 5947.26 Millions | |
| Recent Price: 266.87 Smart Investing & Trading Score: 10 | |
| Day Percent Change: -0.32% Day Change: -0.87 | |
| Week Change: -1.41% Year-to-date Change: -7.6% | |
| SNA Links: Profile News Message Board | |
| Charts:- Daily , Weekly | |
| Add SNA to Watchlist: View: Get SNA Trend Analysis ➞ | |
 | KEYS Keysight Technologies, Inc. |
| Sector: Technology | |
| SubSector: Scientific & Technical Instruments | |
| MarketCap: 17355.1 Millions | |
| Recent Price: 146.99 Smart Investing & Trading Score: 17 | |
| Day Percent Change: 1.41% Day Change: 2.04 | |
| Week Change: -1.05% Year-to-date Change: -7.6% | |
| KEYS Links: Profile News Message Board | |
| Charts:- Daily , Weekly | |
| Add KEYS to Watchlist: View: Get KEYS Trend Analysis ➞ | |
 | HON Honeywell International Inc. |
| Sector: Industrials | |
| SubSector: Diversified Machinery | |
| MarketCap: 91189.1 Millions | |
| Recent Price: 193.64 Smart Investing & Trading Score: 32 | |
| Day Percent Change: -0.85% Day Change: -1.66 | |
| Week Change: 0.1% Year-to-date Change: -7.7% | |
| HON Links: Profile News Message Board | |
| Charts:- Daily , Weekly | |
| Add HON to Watchlist: View: Get HON Trend Analysis ➞ | |
 | EL The Estee Lauder Companies Inc. |
| Sector: Consumer Staples | |
| SubSector: Personal Products | |
| MarketCap: 59521.1 Millions | |
| Recent Price: 134.94 Smart Investing & Trading Score: 10 | |
| Day Percent Change: 5.94% Day Change: 7.57 | |
| Week Change: -8.48% Year-to-date Change: -7.7% | |
| EL Links: Profile News Message Board | |
| Charts:- Daily , Weekly | |
| Add EL to Watchlist: View: Get EL Trend Analysis ➞ | |
 | ROST Ross Stores, Inc. |
| Sector: Services & Goods | |
| SubSector: Apparel Stores | |
| MarketCap: 24938.8 Millions | |
| Recent Price: 127.65 Smart Investing & Trading Score: 10 | |
| Day Percent Change: -0.13% Day Change: -0.17 | |
| Week Change: -4.46% Year-to-date Change: -7.8% | |
| ROST Links: Profile News Message Board | |
| Charts:- Daily , Weekly | |
| Add ROST to Watchlist: View: Get ROST Trend Analysis ➞ | |
 | MCD McDonald s Corporation |
| Sector: Services & Goods | |
| SubSector: Restaurants | |
| MarketCap: 122481 Millions | |
| Recent Price: 273.28 Smart Investing & Trading Score: 40 | |
| Day Percent Change: -0.42% Day Change: -1.15 | |
| Week Change: 0.07% Year-to-date Change: -7.8% | |
| MCD Links: Profile News Message Board | |
| Charts:- Daily , Weekly | |
| Add MCD to Watchlist: View: Get MCD Trend Analysis ➞ | |
 | MGM MGM Resorts International |
| Sector: Services & Goods | |
| SubSector: Resorts & Casinos | |
| MarketCap: 5315.04 Millions | |
| Recent Price: 40.87 Smart Investing & Trading Score: 17 | |
| Day Percent Change: 2.82% Day Change: 1.12 | |
| Week Change: -0.54% Year-to-date Change: -8.5% | |
| MGM Links: Profile News Message Board | |
| Charts:- Daily , Weekly | |
| Add MGM to Watchlist: View: Get MGM Trend Analysis ➞ | |
 | LUV Southwest Airlines Co. |
| Sector: Transports | |
| SubSector: Regional Airlines | |
| MarketCap: 19463.3 Millions | |
| Recent Price: 26.41 Smart Investing & Trading Score: 17 | |
| Day Percent Change: 2.88% Day Change: 0.74 | |
| Week Change: -2.29% Year-to-date Change: -8.6% | |
| LUV Links: Profile News Message Board | |
| Charts:- Daily , Weekly | |
| Add LUV to Watchlist: View: Get LUV Trend Analysis ➞ | |
 | SLB Schlumberger Limited |
| Sector: Energy | |
| SubSector: Oil & Gas Equipment & Services | |
| MarketCap: 23892 Millions | |
| Recent Price: 47.58 Smart Investing & Trading Score: 17 | |
| Day Percent Change: 0.89% Day Change: 0.42 | |
| Week Change: -3.29% Year-to-date Change: -8.6% | |
| SLB Links: Profile News Message Board | |
| Charts:- Daily , Weekly | |
| Add SLB to Watchlist: View: Get SLB Trend Analysis ➞ | |
 | BX The Blackstone Group Inc. |
| Sector: Financials | |
| SubSector: Asset Management | |
| MarketCap: 50957.7 Millions | |
| Recent Price: 118.99 Smart Investing & Trading Score: 10 | |
| Day Percent Change: 1.28% Day Change: 1.50 | |
| Week Change: -2.86% Year-to-date Change: -9.1% | |
| BX Links: Profile News Message Board | |
| Charts:- Daily , Weekly | |
| Add BX to Watchlist: View: Get BX Trend Analysis ➞ | |
 | EFX Equifax Inc. |
| Sector: Financials | |
| SubSector: Credit Services | |
| MarketCap: 13754.6 Millions | |
| Recent Price: 224.50 Smart Investing & Trading Score: 18 | |
| Day Percent Change: 1.74% Day Change: 3.83 | |
| Week Change: 0.48% Year-to-date Change: -9.2% | |
| EFX Links: Profile News Message Board | |
| Charts:- Daily , Weekly | |
| Add EFX to Watchlist: View: Get EFX Trend Analysis ➞ | |
 | LKQ LKQ Corporation |
| Sector: Consumer Staples | |
| SubSector: Auto Parts | |
| MarketCap: 5633.79 Millions | |
| Recent Price: 43.35 Smart Investing & Trading Score: 18 | |
| Day Percent Change: 0.51% Day Change: 0.22 | |
| Week Change: -0.66% Year-to-date Change: -9.3% | |
| LKQ Links: Profile News Message Board | |
| Charts:- Daily , Weekly | |
| Add LKQ to Watchlist: View: Get LKQ Trend Analysis ➞ | |
 | HSIC Henry Schein, Inc. |
| Sector: Services & Goods | |
| SubSector: Medical Equipment Wholesale | |
| MarketCap: 6760.9 Millions | |
| Recent Price: 68.58 Smart Investing & Trading Score: 0 | |
| Day Percent Change: -0.29% Day Change: -0.20 | |
| Week Change: -6.22% Year-to-date Change: -9.4% | |
| HSIC Links: Profile News Message Board | |
| Charts:- Daily , Weekly | |
| Add HSIC to Watchlist: View: Get HSIC Trend Analysis ➞ | |
 | JBL Jabil Inc. |
| Sector: Technology | |
| SubSector: Printed Circuit Boards | |
| MarketCap: 3272.15 Millions | |
| Recent Price: 115.26 Smart Investing & Trading Score: 10 | |
| Day Percent Change: 0.77% Day Change: 0.88 | |
| Week Change: -2.55% Year-to-date Change: -9.5% | |
| JBL Links: Profile News Message Board | |
| Charts:- Daily , Weekly | |
| Add JBL to Watchlist: View: Get JBL Trend Analysis ➞ | |
 | VICI VICI Properties Inc. |
| Sector: Financials | |
| SubSector: REIT - Diversified | |
| MarketCap: 7327.03 Millions | |
| Recent Price: 28.80 Smart Investing & Trading Score: 42 | |
| Day Percent Change: -0.35% Day Change: -0.10 | |
| Week Change: 1.16% Year-to-date Change: -9.7% | |
| VICI Links: Profile News Message Board | |
| Charts:- Daily , Weekly | |
| Add VICI to Watchlist: View: Get VICI Trend Analysis ➞ | |
 | POOL Pool Corporation |
| Sector: Consumer Staples | |
| SubSector: Sporting Goods | |
| MarketCap: 7479.64 Millions | |
| Recent Price: 360.10 Smart Investing & Trading Score: 10 | |
| Day Percent Change: 0.17% Day Change: 0.60 | |
| Week Change: -2.98% Year-to-date Change: -9.7% | |
| POOL Links: Profile News Message Board | |
| Charts:- Daily , Weekly | |
| Add POOL to Watchlist: View: Get POOL Trend Analysis ➞ | |
 | DRI Darden Restaurants, Inc. |
| Sector: Services & Goods | |
| SubSector: Restaurants | |
| MarketCap: 5623.1 Millions | |
| Recent Price: 147.86 Smart Investing & Trading Score: 0 | |
| Day Percent Change: -2.18% Day Change: -3.29 | |
| Week Change: -5.28% Year-to-date Change: -10.0% | |
| DRI Links: Profile News Message Board | |
| Charts:- Daily , Weekly | |
| Add DRI to Watchlist: View: Get DRI Trend Analysis ➞ | |
 | AAPL Apple Inc. |
| Sector: Technology | |
| SubSector: Electronic Equipment | |
| MarketCap: 1112940 Millions | |
| Recent Price: 173.16 Smart Investing & Trading Score: 42 | |
| Day Percent Change: 2.28% Day Change: 3.86 | |
| Week Change: 2.28% Year-to-date Change: -10.1% | |
| AAPL Links: Profile News Message Board | |
| Charts:- Daily , Weekly | |
| Add AAPL to Watchlist: View: Get AAPL Trend Analysis ➞ | |
 | EXPE Expedia Group, Inc. |
| Sector: Services & Goods | |
| SubSector: Lodging | |
| MarketCap: 8052.96 Millions | |
| Recent Price: 136.22 Smart Investing & Trading Score: 44 | |
| Day Percent Change: 2.31% Day Change: 3.08 | |
| Week Change: 0.38% Year-to-date Change: -10.3% | |
| EXPE Links: Profile News Message Board | |
| Charts:- Daily , Weekly | |
| Add EXPE to Watchlist: View: Get EXPE Trend Analysis ➞ | |
 | REG Regency Centers Corporation |
| Sector: Financials | |
| SubSector: REIT - Retail | |
| MarketCap: 6345.84 Millions | |
| Recent Price: 60.01 Smart Investing & Trading Score: 64 | |
| Day Percent Change: 1.52% Day Change: 0.90 | |
| Week Change: 2.97% Year-to-date Change: -10.4% | |
| REG Links: Profile News Message Board | |
| Charts:- Daily , Weekly | |
| Add REG to Watchlist: View: Get REG Trend Analysis ➞ | |
| For tabular summary view of above stock list: Summary View ➞ 0 - 25 , 25 - 50 , 50 - 75 , 75 - 100 , 100 - 125 , 125 - 150 , 150 - 175 , 175 - 200 , 200 - 225 , 225 - 250 , 250 - 275 , 275 - 300 , 300 - 325 , 325 - 350 , 350 - 375 , 375 - 400 , 400 - 425 , 425 - 450 , 450 - 475 , 475 - 500 | ||
| Click To Change The Sort Order: By Market Cap or Company Size Performance: Year-to-date, Week and Day | |
| Select Chart Type: | ||
|
Best Stocks Today 12Stocks.com |
© 2024 12Stocks.com Terms & Conditions Privacy Contact Us
All Information Provided Only For Education And Not To Be Used For Investing or Trading. See Terms & Conditions


One More Thing ... Get Best Stocks Delivered Daily!
Never Ever Miss A Move With Our Top Ten Stocks Lists
Find Best Stocks In Any Market - Bull or Bear Market
Take A Peek At Our Top Ten Stocks Lists: Daily, Weekly, Year-to-Date & Top Trends
Find Best Stocks In Any Market - Bull or Bear Market
Take A Peek At Our Top Ten Stocks Lists: Daily, Weekly, Year-to-Date & Top Trends
S&P 500 Stocks With Best Up Trends [0-bearish to 100-bullish]: C.H. Robinson[100], QUALCOMM [100], BorgWarner [100], Kellogg [100], WestRock [100], Ventas [100], AES [100], Xylem [100], Bio-Techne [100], Becton Dickinson[100], Air Products[100]
Best S&P 500 Stocks Year-to-Date:
NVIDIA [73.31%], Constellation [58.62%], NRG [45.32%], Chipotle Mexican[37.39%], DaVita [35.78%], Western Digital[33.13%], Leidos Holdings[31.8%], Micron [31.63%], Progressive [31.23%], Eaton [30.92%], Targa Resources[30.07%] Best S&P 500 Stocks This Week:
Bio-Techne [18.09%], Moderna [16.35%], Garmin [15.25%], C.H. Robinson[15.2%], Amcor [10.03%], AES [9.99%], Leidos Holdings[9.44%], Aptiv [9.24%], Pfizer [9.06%], QUALCOMM [8.75%], WestRock [8.17%] Best S&P 500 Stocks Daily:
Moderna [12.70%], C.H. Robinson[12.21%], Aptiv [11.53%], QUALCOMM [9.78%], Monolithic Power[9.09%], BorgWarner [8.40%], Kellogg [7.55%], WestRock [6.70%], Estee Lauder[5.94%], Corteva [5.69%], Zoetis [5.51%]