
 Login Sign Up


| |||||
 |  | ||||

| 12Stocks.com Market Intelligence |
Best S&P 500 Stocks
|
On this page, you will find the most comprehensive analysis of S&P 500 stocks and ETFs - from latest trends to performances to charts ➞. First, here are the year-to-date (YTD) performances of the most requested S&P 500 stocks at 12Stocks.com (click stock for review):
| NVIDIA 65% | ||
| Merck 19% | ||
| Caterpillar 15% | ||
| Walmart 14% | ||
| JPMorgan Chase 13% | ||
| Amazon.com 13% | ||
| Google 11% | ||
| Chevron 10% | ||
| Goldman Sachs 8% | ||
| Microsoft 4% | ||
| Johnson & Johnson -6% | ||
| McDonald s -7% | ||
| Starbucks -8% | ||
| Apple -12% | ||
| Gilead -19% | ||
| Intel -31% | ||
| Boeing -38% | ||
| Quick: S&P 500 Stocks Lists: Performances & Trends, S&P 500 Stock Charts
Sort S&P 500 stocks: Daily, Weekly, Year-to-Date, Market Cap & Trends. Filter S&P 500 stocks list by sector: Show all, Tech, Finance, Energy, Staples, Retail, Industrial, Materials, Utilities and HealthCare |
| 12Stocks.com S&P 500 Stocks Performances & Trends Daily Report | |||||||||
|
| 
The overall Smart Investing & Trading Score is 44 (0-bearish to 100-bullish) which puts S&P 500 index in short term neutral trend. The Smart Investing & Trading Score from previous trading session is 58 and hence a deterioration of trend. | ||||||||
Here are the Smart Investing & Trading Scores of the most requested S&P 500 stocks at 12Stocks.com (click stock name for detailed review):
|


| 12Stocks.com: Top Performing S&P 500 Index Stocks | ||||||||||||||||||||||||||||||||||||||||||||||||
 The top performing S&P 500 Index stocks year to date are
Now, more recently, over last week, the top performing S&P 500 Index stocks on the move are


|
||||||||||||||||||||||||||||||||||||||||||||||||
| 12Stocks.com: Investing in S&P 500 Index with Stocks | |
|
The following table helps investors and traders sort through current performance and trends (as measured by Smart Investing & Trading Score) of various
stocks in the S&P 500 Index. Quick View: Move mouse or cursor over stock symbol (ticker) to view short-term technical chart and over stock name to view long term chart. Click on  to add stock symbol to your watchlist and to add stock symbol to your watchlist and  to view watchlist. Click on any ticker or stock name for detailed market intelligence report for that stock. to view watchlist. Click on any ticker or stock name for detailed market intelligence report for that stock. |
12Stocks.com Performance of Stocks in S&P 500 Index
| Ticker | Stock Name | Watchlist | Category | Recent Price | Smart Investing & Trading Score | Change % | YTD Change% |
| FCX | Freeport-McMoRan |   | Materials | 48.35 | 53 | 0.24% | 13.59% |
| CHD | Church & Dwight Co | | Consumer Staples | 107.34 | 100 | -0.01% | 13.52% |
| MRO | Marathon Oil | | Energy | 27.43 | 54 | -0.38% | 13.51% |
| JPM | JPMorgan Chase | | Financials | 192.96 | 70 | -0.06% | 13.44% |
| NTAP | NetApp | | Technology | 99.94 | 63 | -0.11% | 13.37% |
| GWW | W.W. Grainger | | Services & Goods | 939.33 | 26 | -1.98% | 13.35% |
| XYL | Xylem | | Industrials | 129.61 | 58 | -0.81% | 13.34% |
| WRK | WestRock | | Consumer Staples | 47.05 | 41 | -0.92% | 13.31% |
| CTVA | Corteva | | Materials | 54.26 | 53 | -0.93% | 13.23% |
| TSN | Tyson Foods | | Consumer Staples | 60.76 | 88 | -0.91% | 13.04% |
| AMZN | Amazon.com | | Services & Goods | 171.47 | 26 | -2.90% | 12.86% |
| KMB | Kimberly-Clark | | Consumer Staples | 136.96 | 100 | -0.60% | 12.72% |
| WMB | Williams | | Energy | 39.23 | 88 | -0.05% | 12.63% |
| OXY | Occidental | | Energy | 67.17 | 61 | -0.23% | 12.50% |
| QCOM | QUALCOMM | | Technology | 162.60 | 68 | -0.63% | 12.42% |
| DFS | Discover Financial | | Financials | 126.36 | 58 | -2.07% | 12.42% |
| ALGN | Align | | Health Care | 307.88 | 68 | -1.88% | 12.37% |
| HLT | Hilton Worldwide | | Services & Goods | 203.99 | 58 | -0.35% | 12.03% |
| VMC | Vulcan Materials | | Industrials | 254.28 | 36 | -0.83% | 12.01% |
| BAC | Bank of America | | Financials | 37.65 | 71 | -1.76% | 11.81% |
| SYK | Stryker | | Health Care | 334.76 | 45 | -0.62% | 11.79% |
| CL | Colgate-Palmolive | | Consumer Staples | 89.04 | 95 | 0.19% | 11.70% |
| EMR | Emerson Electric | | Industrials | 108.67 | 54 | -0.87% | 11.65% |
| UBER | Uber Technologies | | Technology | 68.71 | 36 | -0.94% | 11.60% |
| ANET | Arista Networks | | Technology | 262.46 | 32 | 3.02% | 11.44% |
| For chart view version of above stock list: Chart View ➞ 0 - 25 , 25 - 50 , 50 - 75 , 75 - 100 , 100 - 125 , 125 - 150 , 150 - 175 , 175 - 200 , 200 - 225 , 225 - 250 , 250 - 275 , 275 - 300 , 300 - 325 , 325 - 350 , 350 - 375 , 375 - 400 , 400 - 425 , 425 - 450 , 450 - 475 , 475 - 500 | ||
 | Click To Change The Sort Order: By Market Cap or Company Size Performance: Year-to-date, Week and Day |  |
|
Get the most comprehensive stock market coverage daily at 12Stocks.com ➞ Best Stocks Today ➞ Best Stocks Weekly ➞ Best Stocks Year-to-Date ➞ Best Stocks Trends ➞  Best Stocks Today 12Stocks.com Best Nasdaq Stocks ➞ Best S&P 500 Stocks ➞ Best Tech Stocks ➞ Best Biotech Stocks ➞ |
| Detailed Overview of S&P 500 Stocks |
| S&P 500 Technical Overview, Leaders & Laggards, Top S&P 500 ETF Funds & Detailed S&P 500 Stocks List, Charts, Trends & More |
| S&P 500: Technical Analysis, Trends & YTD Performance | |
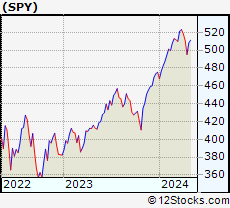
| S&P 500 index as represented by
SPY, an exchange-traded fund [ETF], holds basket of five hundred (mostly largecap) stocks from across all major sectors of the US stock market. The S&P 500 index (contains stocks like Apple and Exxon) is up by 4.99% and is currently outperforming the overall market by 0.74% year-to-date. Below is a quick view of technical charts and trends: | |
 SPY Weekly Chart |
|
| Long Term Trend: Good | |
| Medium Term Trend: Not Good | |
 SPY Daily Chart |
|
| Short Term Trend: Not Good | |
| Overall Trend Score: 44 | |
| YTD Performance: 4.99% | |
| **Trend Scores & Views Are Only For Educational Purposes And Not For Investing | |
| 12Stocks.com: Investing in S&P 500 Index using Exchange Traded Funds | |
|
The following table shows list of key exchange traded funds (ETF) that
help investors track S&P 500 index. The following list also includes leveraged ETF funds that track twice or thrice the daily returns of S&P 500 indices. Short or inverse ETF funds move in the opposite direction to the index they track and are useful during market pullbacks or during bear markets. Quick View: Move mouse or cursor over ETF symbol (ticker) to view short-term technical chart and over ETF name to view long term chart. Click on ticker or stock name for detailed view. Click on to add stock symbol to your watchlist and to view watchlist. |
12Stocks.com List of ETFs that track S&P 500 Index
| Ticker | ETF Name | Watchlist | Recent Price | Smart Investing & Trading Score | Change % | Week % | Year-to-date % |
| SPY | SPDR S&P 500 ETF | | 499.05 | 44 | -1.26 | 0.78 | 4.99% |
| OEF | iShares S&P 100 | | 235.81 | 34 | -1.66 | 0.48 | 5.56% |
| SSO | ProShares Ultra S&P500 | | 70.09 | 44 | -2.59 | 1.42 | 7.71% |
| UPRO | ProShares UltraPro S&P500 | | 60.43 | 36 | -3.90 | 2.15 | 10.39% |
| SH | ProShares Short S&P500 | | 12.52 | 62 | 1.54 | -0.56 | -3.62% |
| SDS | ProShares UltraShort S&P500 | | 27.50 | 62 | 2.61 | -1.43 | -8.09% |
| SPXU | ProShares UltraPro Short S&P500 | | 37.50 | 69 | 4.05 | -2.17 | -12.79% |
| 12Stocks.com: Charts, Trends, Fundamental Data and Performances of S&P 500 Stocks | |
|
We now take in-depth look at all S&P 500 stocks including charts, multi-period performances and overall trends (as measured by Smart Investing & Trading Score). One can sort S&P 500 stocks (click link to choose) by Daily, Weekly and by Year-to-Date performances. Also, one can sort by size of the company or by market capitalization. |
| Select Your Default Chart Type: | |||||
| |||||
| Click on stock symbol or name for detailed view. Click on to add stock symbol to your watchlist and to view watchlist. Quick View: Move mouse or cursor over "Daily" to quickly view daily technical stock chart and over "Weekly" to view weekly technical stock chart. | |||||

 | FCX Freeport-McMoRan Inc. |
| Sector: Materials | |
| SubSector: Copper | |
| MarketCap: 9070.57 Millions | |
| Recent Price: 48.35 Smart Investing & Trading Score: 53 | |
| Day Percent Change: 0.24% Day Change: 0.11 | |
| Week Change: -2.53% Year-to-date Change: 13.6% | |
| FCX Links: Profile News Message Board | |
| Charts:- Daily , Weekly | |
| Add FCX to Watchlist: View: Get FCX Trend Analysis ➞ | |
 | CHD Church & Dwight Co., Inc. |
| Sector: Consumer Staples | |
| SubSector: Cleaning Products | |
| MarketCap: 17425.7 Millions | |
| Recent Price: 107.34 Smart Investing & Trading Score: 100 | |
| Day Percent Change: -0.01% Day Change: -0.01 | |
| Week Change: 2.87% Year-to-date Change: 13.5% | |
| CHD Links: Profile News Message Board | |
| Charts:- Daily , Weekly | |
| Add CHD to Watchlist: View: Get CHD Trend Analysis ➞ | |
 | MRO Marathon Oil Corporation |
| Sector: Energy | |
| SubSector: Independent Oil & Gas | |
| MarketCap: 2911.53 Millions | |
| Recent Price: 27.43 Smart Investing & Trading Score: 54 | |
| Day Percent Change: -0.38% Day Change: -0.11 | |
| Week Change: -0.27% Year-to-date Change: 13.5% | |
| MRO Links: Profile News Message Board | |
| Charts:- Daily , Weekly | |
| Add MRO to Watchlist: View: Get MRO Trend Analysis ➞ | |
 | JPM JPMorgan Chase & Co. |
| Sector: Financials | |
| SubSector: Money Center Banks | |
| MarketCap: 279736 Millions | |
| Recent Price: 192.96 Smart Investing & Trading Score: 70 | |
| Day Percent Change: -0.06% Day Change: -0.12 | |
| Week Change: 3.85% Year-to-date Change: 13.4% | |
| JPM Links: Profile News Message Board | |
| Charts:- Daily , Weekly | |
| Add JPM to Watchlist: View: Get JPM Trend Analysis ➞ | |
 | NTAP NetApp, Inc. |
| Sector: Technology | |
| SubSector: Data Storage Devices | |
| MarketCap: 9028.89 Millions | |
| Recent Price: 99.94 Smart Investing & Trading Score: 63 | |
| Day Percent Change: -0.11% Day Change: -0.12 | |
| Week Change: 2.04% Year-to-date Change: 13.4% | |
| NTAP Links: Profile News Message Board | |
| Charts:- Daily , Weekly | |
| Add NTAP to Watchlist: View: Get NTAP Trend Analysis ➞ | |
 | GWW W.W. Grainger, Inc. |
| Sector: Services & Goods | |
| SubSector: Industrial Equipment Wholesale | |
| MarketCap: 12794.8 Millions | |
| Recent Price: 939.33 Smart Investing & Trading Score: 26 | |
| Day Percent Change: -1.98% Day Change: -18.99 | |
| Week Change: -0.35% Year-to-date Change: 13.4% | |
| GWW Links: Profile News Message Board | |
| Charts:- Daily , Weekly | |
| Add GWW to Watchlist: View: Get GWW Trend Analysis ➞ | |
 | XYL Xylem Inc. |
| Sector: Industrials | |
| SubSector: Diversified Machinery | |
| MarketCap: 12195.1 Millions | |
| Recent Price: 129.61 Smart Investing & Trading Score: 58 | |
| Day Percent Change: -0.81% Day Change: -1.06 | |
| Week Change: 1.38% Year-to-date Change: 13.3% | |
| XYL Links: Profile News Message Board | |
| Charts:- Daily , Weekly | |
| Add XYL to Watchlist: View: Get XYL Trend Analysis ➞ | |
 | WRK WestRock Company |
| Sector: Consumer Staples | |
| SubSector: Packaging & Containers | |
| MarketCap: 7835.43 Millions | |
| Recent Price: 47.05 Smart Investing & Trading Score: 41 | |
| Day Percent Change: -0.92% Day Change: -0.43 | |
| Week Change: -1.97% Year-to-date Change: 13.3% | |
| WRK Links: Profile News Message Board | |
| Charts:- Daily , Weekly | |
| Add WRK to Watchlist: View: Get WRK Trend Analysis ➞ | |
 | CTVA Corteva, Inc. |
| Sector: Materials | |
| SubSector: Agricultural Chemicals | |
| MarketCap: 18894.3 Millions | |
| Recent Price: 54.26 Smart Investing & Trading Score: 53 | |
| Day Percent Change: -0.93% Day Change: -0.51 | |
| Week Change: -0.99% Year-to-date Change: 13.2% | |
| CTVA Links: Profile News Message Board | |
| Charts:- Daily , Weekly | |
| Add CTVA to Watchlist: View: Get CTVA Trend Analysis ➞ | |
 | TSN Tyson Foods, Inc. |
| Sector: Consumer Staples | |
| SubSector: Meat Products | |
| MarketCap: 22124.1 Millions | |
| Recent Price: 60.76 Smart Investing & Trading Score: 88 | |
| Day Percent Change: -0.91% Day Change: -0.56 | |
| Week Change: 1.35% Year-to-date Change: 13.0% | |
| TSN Links: Profile News Message Board | |
| Charts:- Daily , Weekly | |
| Add TSN to Watchlist: View: Get TSN Trend Analysis ➞ | |
 | AMZN Amazon.com, Inc. |
| Sector: Services & Goods | |
| SubSector: Catalog & Mail Order Houses | |
| MarketCap: 998070 Millions | |
| Recent Price: 171.47 Smart Investing & Trading Score: 26 | |
| Day Percent Change: -2.90% Day Change: -5.12 | |
| Week Change: -1.81% Year-to-date Change: 12.9% | |
| AMZN Links: Profile News Message Board | |
| Charts:- Daily , Weekly | |
| Add AMZN to Watchlist: View: Get AMZN Trend Analysis ➞ | |
 | KMB Kimberly-Clark Corporation |
| Sector: Consumer Staples | |
| SubSector: Personal Products | |
| MarketCap: 44300.5 Millions | |
| Recent Price: 136.96 Smart Investing & Trading Score: 100 | |
| Day Percent Change: -0.60% Day Change: -0.82 | |
| Week Change: 7.99% Year-to-date Change: 12.7% | |
| KMB Links: Profile News Message Board | |
| Charts:- Daily , Weekly | |
| Add KMB to Watchlist: View: Get KMB Trend Analysis ➞ | |
 | WMB The Williams Companies, Inc. |
| Sector: Energy | |
| SubSector: Oil & Gas Pipelines | |
| MarketCap: 16851.5 Millions | |
| Recent Price: 39.23 Smart Investing & Trading Score: 88 | |
| Day Percent Change: -0.05% Day Change: -0.02 | |
| Week Change: 1.87% Year-to-date Change: 12.6% | |
| WMB Links: Profile News Message Board | |
| Charts:- Daily , Weekly | |
| Add WMB to Watchlist: View: Get WMB Trend Analysis ➞ | |
 | OXY Occidental Petroleum Corporation |
| Sector: Energy | |
| SubSector: Independent Oil & Gas | |
| MarketCap: 9152.73 Millions | |
| Recent Price: 67.17 Smart Investing & Trading Score: 61 | |
| Day Percent Change: -0.23% Day Change: -0.16 | |
| Week Change: 0.82% Year-to-date Change: 12.5% | |
| OXY Links: Profile News Message Board | |
| Charts:- Daily , Weekly | |
| Add OXY to Watchlist: View: Get OXY Trend Analysis ➞ | |
 | QCOM QUALCOMM Incorporated |
| Sector: Technology | |
| SubSector: Communication Equipment | |
| MarketCap: 77517.7 Millions | |
| Recent Price: 162.60 Smart Investing & Trading Score: 68 | |
| Day Percent Change: -0.63% Day Change: -1.03 | |
| Week Change: 3.15% Year-to-date Change: 12.4% | |
| QCOM Links: Profile News Message Board | |
| Charts:- Daily , Weekly | |
| Add QCOM to Watchlist: View: Get QCOM Trend Analysis ➞ | |
 | DFS Discover Financial Services |
| Sector: Financials | |
| SubSector: Credit Services | |
| MarketCap: 9228.88 Millions | |
| Recent Price: 126.36 Smart Investing & Trading Score: 58 | |
| Day Percent Change: -2.07% Day Change: -2.67 | |
| Week Change: 0.8% Year-to-date Change: 12.4% | |
| DFS Links: Profile News Message Board | |
| Charts:- Daily , Weekly | |
| Add DFS to Watchlist: View: Get DFS Trend Analysis ➞ | |
 | ALGN Align Technology, Inc. |
| Sector: Health Care | |
| SubSector: Medical Appliances & Equipment | |
| MarketCap: 12802 Millions | |
| Recent Price: 307.88 Smart Investing & Trading Score: 68 | |
| Day Percent Change: -1.88% Day Change: -5.89 | |
| Week Change: 2.98% Year-to-date Change: 12.4% | |
| ALGN Links: Profile News Message Board | |
| Charts:- Daily , Weekly | |
| Add ALGN to Watchlist: View: Get ALGN Trend Analysis ➞ | |
 | HLT Hilton Worldwide Holdings Inc. |
| Sector: Services & Goods | |
| SubSector: Lodging | |
| MarketCap: 18064.6 Millions | |
| Recent Price: 203.99 Smart Investing & Trading Score: 58 | |
| Day Percent Change: -0.35% Day Change: -0.71 | |
| Week Change: 4.9% Year-to-date Change: 12.0% | |
| HLT Links: Profile News Message Board | |
| Charts:- Daily , Weekly | |
| Add HLT to Watchlist: View: Get HLT Trend Analysis ➞ | |
 | VMC Vulcan Materials Company |
| Sector: Industrials | |
| SubSector: General Building Materials | |
| MarketCap: 12304.7 Millions | |
| Recent Price: 254.28 Smart Investing & Trading Score: 36 | |
| Day Percent Change: -0.83% Day Change: -2.12 | |
| Week Change: 0.88% Year-to-date Change: 12.0% | |
| VMC Links: Profile News Message Board | |
| Charts:- Daily , Weekly | |
| Add VMC to Watchlist: View: Get VMC Trend Analysis ➞ | |
 | BAC Bank of America Corporation |
| Sector: Financials | |
| SubSector: Money Center Banks | |
| MarketCap: 189690 Millions | |
| Recent Price: 37.65 Smart Investing & Trading Score: 71 | |
| Day Percent Change: -1.76% Day Change: -0.67 | |
| Week Change: 1.83% Year-to-date Change: 11.8% | |
| BAC Links: Profile News Message Board | |
| Charts:- Daily , Weekly | |
| Add BAC to Watchlist: View: Get BAC Trend Analysis ➞ | |
 | SYK Stryker Corporation |
| Sector: Health Care | |
| SubSector: Medical Appliances & Equipment | |
| MarketCap: 59441.3 Millions | |
| Recent Price: 334.76 Smart Investing & Trading Score: 45 | |
| Day Percent Change: -0.62% Day Change: -2.09 | |
| Week Change: 2.87% Year-to-date Change: 11.8% | |
| SYK Links: Profile News Message Board | |
| Charts:- Daily , Weekly | |
| Add SYK to Watchlist: View: Get SYK Trend Analysis ➞ | |
 | CL Colgate-Palmolive Company |
| Sector: Consumer Staples | |
| SubSector: Personal Products | |
| MarketCap: 57242.7 Millions | |
| Recent Price: 89.04 Smart Investing & Trading Score: 95 | |
| Day Percent Change: 0.19% Day Change: 0.17 | |
| Week Change: 2.19% Year-to-date Change: 11.7% | |
| CL Links: Profile News Message Board | |
| Charts:- Daily , Weekly | |
| Add CL to Watchlist: View: Get CL Trend Analysis ➞ | |
 | EMR Emerson Electric Co. |
| Sector: Industrials | |
| SubSector: Industrial Electrical Equipment | |
| MarketCap: 30457.9 Millions | |
| Recent Price: 108.67 Smart Investing & Trading Score: 54 | |
| Day Percent Change: -0.87% Day Change: -0.95 | |
| Week Change: 0.08% Year-to-date Change: 11.7% | |
| EMR Links: Profile News Message Board | |
| Charts:- Daily , Weekly | |
| Add EMR to Watchlist: View: Get EMR Trend Analysis ➞ | |
 | UBER Uber Technologies, Inc. |
| Sector: Technology | |
| SubSector: Application Software | |
| MarketCap: 42671.2 Millions | |
| Recent Price: 68.71 Smart Investing & Trading Score: 36 | |
| Day Percent Change: -0.94% Day Change: -0.65 | |
| Week Change: -0.71% Year-to-date Change: 11.6% | |
| UBER Links: Profile News Message Board | |
| Charts:- Daily , Weekly | |
| Add UBER to Watchlist: View: Get UBER Trend Analysis ➞ | |
 | ANET Arista Networks, Inc. |
| Sector: Technology | |
| SubSector: Diversified Computer Systems | |
| MarketCap: 14071.2 Millions | |
| Recent Price: 262.46 Smart Investing & Trading Score: 32 | |
| Day Percent Change: 3.02% Day Change: 7.69 | |
| Week Change: 6.65% Year-to-date Change: 11.4% | |
| ANET Links: Profile News Message Board | |
| Charts:- Daily , Weekly | |
| Add ANET to Watchlist: View: Get ANET Trend Analysis ➞ | |
| For tabular summary view of above stock list: Summary View ➞ 0 - 25 , 25 - 50 , 50 - 75 , 75 - 100 , 100 - 125 , 125 - 150 , 150 - 175 , 175 - 200 , 200 - 225 , 225 - 250 , 250 - 275 , 275 - 300 , 300 - 325 , 325 - 350 , 350 - 375 , 375 - 400 , 400 - 425 , 425 - 450 , 450 - 475 , 475 - 500 | ||
| Click To Change The Sort Order: By Market Cap or Company Size Performance: Year-to-date, Week and Day | |
| Select Chart Type: | ||
|
Best Stocks Today 12Stocks.com |
© 2024 12Stocks.com Terms & Conditions Privacy Contact Us
All Information Provided Only For Education And Not To Be Used For Investing or Trading. See Terms & Conditions


One More Thing ... Get Best Stocks Delivered Daily!
Never Ever Miss A Move With Our Top Ten Stocks Lists
Find Best Stocks In Any Market - Bull or Bear Market
Take A Peek At Our Top Ten Stocks Lists: Daily, Weekly, Year-to-Date & Top Trends
Find Best Stocks In Any Market - Bull or Bear Market
Take A Peek At Our Top Ten Stocks Lists: Daily, Weekly, Year-to-Date & Top Trends
S&P 500 Stocks With Best Up Trends [0-bearish to 100-bullish]: Newmont [100], Dover [100], Chipotle Mexican[100], Merck [100], Northrop Grumman[100], EQT [100], Boston Scientific[100], Coca-Cola [100], Altria [100], Hess [100], Campbell Soup[100]
Best S&P 500 Stocks Year-to-Date:
NVIDIA [65.24%], Constellation [60.24%], NRG [39.81%], Targa Resources[34.22%], Marathon [33.86%], Chipotle Mexican[32.43%], Diamondback [32.2%], Progressive [31.71%], Eaton [30.97%], Western Digital[30.89%], Micron [30.34%] Best S&P 500 Stocks This Week:
Hasbro [17.46%], Globe Life[14.66%], Tesla [13.26%], Wabtec [12.29%], Teradyne [12.18%], Microchip [10.53%], Tyler Technologies[10.37%], Monolithic Power[10.19%], NXP Semiconductors[9.67%], ON Semiconductor[8.85%], Boston Scientific[8.79%] Best S&P 500 Stocks Daily:
Newmont [8.50%], Carrier Global[7.19%], Teradyne [6.91%], Tyler Technologies[6.24%], Dover [4.35%], ProShares UltraPro[4.05%], Keurig Dr[3.77%], United Rentals[3.69%], Union Pacific[3.50%], Chipotle Mexican[3.48%], Rollins [3.34%]