
 Login Sign Up


| |||||
 |  | ||||

| 12Stocks.com Market Intelligence |
Best S&P 500 Stocks
|
On this page, you will find the most comprehensive analysis of S&P 500 stocks and ETFs - from latest trends to performances to charts ➞. First, here are the year-to-date (YTD) performances of the most requested S&P 500 stocks at 12Stocks.com (click stock for review):
| NVIDIA 76% | ||
| Caterpillar 22% | ||
| Amazon.com 21% | ||
| Merck 15% | ||
| Walmart 15% | ||
| Microsoft 11% | ||
| Google 11% | ||
| JPMorgan Chase 6% | ||
| Chevron 5% | ||
| Goldman Sachs 3% | ||
| Johnson & Johnson -7% | ||
| McDonald s -10% | ||
| Starbucks -11% | ||
| Apple -12% | ||
| Gilead -17% | ||
| Intel -28% | ||
| Boeing -35% | ||
| Quick: S&P 500 Stocks Lists: Performances & Trends, S&P 500 Stock Charts
Sort S&P 500 stocks: Daily, Weekly, Year-to-Date, Market Cap & Trends. Filter S&P 500 stocks list by sector: Show all, Tech, Finance, Energy, Staples, Retail, Industrial, Materials, Utilities and HealthCare |
| 12Stocks.com S&P 500 Stocks Performances & Trends Daily Report | |||||||||
|
| 
The overall Smart Investing & Trading Score is 26 (0-bearish to 100-bullish) which puts S&P 500 index in short term bearish to neutral trend. The Smart Investing & Trading Score from previous trading session is 31 and a deterioration of trend continues. | ||||||||
Here are the Smart Investing & Trading Scores of the most requested S&P 500 stocks at 12Stocks.com (click stock name for detailed review):
|


| 12Stocks.com: Top Performing S&P 500 Index Stocks | ||||||||||||||||||||||||||||||||||||||||||||||||
 The top performing S&P 500 Index stocks year to date are
Now, more recently, over last week, the top performing S&P 500 Index stocks on the move are


|
||||||||||||||||||||||||||||||||||||||||||||||||
| 12Stocks.com: Investing in S&P 500 Index with Stocks | |
|
The following table helps investors and traders sort through current performance and trends (as measured by Smart Investing & Trading Score) of various
stocks in the S&P 500 Index. Quick View: Move mouse or cursor over stock symbol (ticker) to view short-term technical chart and over stock name to view long term chart. Click on  to add stock symbol to your watchlist and to add stock symbol to your watchlist and  to view watchlist. Click on any ticker or stock name for detailed market intelligence report for that stock. to view watchlist. Click on any ticker or stock name for detailed market intelligence report for that stock. |
12Stocks.com Performance of Stocks in S&P 500 Index
| Ticker | Stock Name | Watchlist | Category | Recent Price | Smart Investing & Trading Score | Change % | YTD Change% |
| MO | Altria |   | Consumer Staples | 40.80 | 46 | -0.37% | 1.14% |
| ZBH | Zimmer Biomet | | Health Care | 122.86 | 10 | -0.92% | 0.95% |
| FSLR | First Solar | | Technology | 173.87 | 56 | -1.19% | 0.92% |
| CSX | CSX | | Transports | 34.89 | 10 | -0.71% | 0.63% |
| JKHY | Jack Henry | | Technology | 164.44 | 10 | -0.37% | 0.63% |
| IP | Paper | | Consumer Staples | 36.36 | 31 | -1.12% | 0.58% |
| FE | First | | Utilities | 36.87 | 23 | -1.42% | 0.57% |
| KMI | Kinder Morgan | | Energy | 17.71 | 36 | -1.45% | 0.40% |
| LMT | Lockheed Martin | | Industrials | 454.81 | 85 | 0.38% | 0.35% |
| NXPI | NXP Semiconductors | | Technology | 230.20 | 26 | 0.04% | 0.23% |
| HPE | Hewlett Packard | | Technology | 16.99 | 36 | -1.56% | 0.06% |
| LYV | Live Nation | | Services & Goods | 93.55 | 26 | -6.23% | -0.05% |
| MOH | Molina Healthcare | | Health Care | 361.07 | 43 | 0.06% | -0.07% |
| MTB | M&T Bank | | Financials | 136.97 | 42 | -2.82% | -0.08% |
| CBOE | Cboe Global | | Financials | 178.34 | 18 | 0.54% | -0.13% |
| TJX | TJX | | Services & Goods | 93.67 | 10 | 0.74% | -0.15% |
| EXC | Exelon | | Utilities | 35.84 | 36 | -1.19% | -0.17% |
| SHW | Sherwin-Williams | | Materials | 310.83 | 36 | -1.00% | -0.34% |
| TMUS | T-Mobile US | | Technology | 159.56 | 15 | -0.17% | -0.48% |
| ETR | Entergy | | Utilities | 100.66 | 36 | -1.59% | -0.52% |
| IQV | IQVIA Holdings | | Health Care | 230.06 | 36 | -0.48% | -0.57% |
| GNRC | Generac Holdings | | Industrials | 128.42 | 56 | -0.07% | -0.63% |
| NDSN | Nordson | | Industrials | 262.47 | 31 | -0.25% | -0.64% |
| D | Dominion | | Utilities | 46.70 | 36 | -2.55% | -0.64% |
| ALLE | Allegion | | Services & Goods | 125.87 | 26 | -0.84% | -0.65% |
| For chart view version of above stock list: Chart View ➞ 0 - 25 , 25 - 50 , 50 - 75 , 75 - 100 , 100 - 125 , 125 - 150 , 150 - 175 , 175 - 200 , 200 - 225 , 225 - 250 , 250 - 275 , 275 - 300 , 300 - 325 , 325 - 350 , 350 - 375 , 375 - 400 , 400 - 425 , 425 - 450 , 450 - 475 , 475 - 500 | ||
 | Click To Change The Sort Order: By Market Cap or Company Size Performance: Year-to-date, Week and Day |  |
|
Get the most comprehensive stock market coverage daily at 12Stocks.com ➞ Best Stocks Today ➞ Best Stocks Weekly ➞ Best Stocks Year-to-Date ➞ Best Stocks Trends ➞  Best Stocks Today 12Stocks.com Best Nasdaq Stocks ➞ Best S&P 500 Stocks ➞ Best Tech Stocks ➞ Best Biotech Stocks ➞ |
| Detailed Overview of S&P 500 Stocks |
| S&P 500 Technical Overview, Leaders & Laggards, Top S&P 500 ETF Funds & Detailed S&P 500 Stocks List, Charts, Trends & More |
| S&P 500: Technical Analysis, Trends & YTD Performance | |
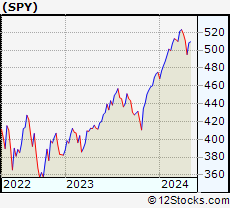
| S&P 500 index as represented by
SPY, an exchange-traded fund [ETF], holds basket of five hundred (mostly largecap) stocks from across all major sectors of the US stock market. The S&P 500 index (contains stocks like Apple and Exxon) is up by 6% and is currently outperforming the overall market by 0.95% year-to-date. Below is a quick view of technical charts and trends: | |
 SPY Weekly Chart |
|
| Long Term Trend: Good | |
| Medium Term Trend: Not Good | |
 SPY Daily Chart |
|
| Short Term Trend: Not Good | |
| Overall Trend Score: 26 | |
| YTD Performance: 6% | |
| **Trend Scores & Views Are Only For Educational Purposes And Not For Investing | |
| 12Stocks.com: Investing in S&P 500 Index using Exchange Traded Funds | |
|
The following table shows list of key exchange traded funds (ETF) that
help investors track S&P 500 index. The following list also includes leveraged ETF funds that track twice or thrice the daily returns of S&P 500 indices. Short or inverse ETF funds move in the opposite direction to the index they track and are useful during market pullbacks or during bear markets. Quick View: Move mouse or cursor over ETF symbol (ticker) to view short-term technical chart and over ETF name to view long term chart. Click on ticker or stock name for detailed view. Click on to add stock symbol to your watchlist and to view watchlist. |
12Stocks.com List of ETFs that track S&P 500 Index
| Ticker | ETF Name | Watchlist | Recent Price | Smart Investing & Trading Score | Change % | Week % | Year-to-date % |
| SPY | SPDR S&P 500 ETF | | 503.83 | 26 | -0.12 | -1.37 | 6% |
| IVV | iShares Core S&P 500 ETF | | 506.20 | 26 | -0.15 | -1.39 | 5.98% |
| VOO | Vanguard 500 ETF | | 462.99 | 26 | -0.13 | -1.4 | 6% |
| OEF | iShares S&P 100 | | 239.45 | 26 | -0.18 | -1.52 | 7.19% |
| SSO | ProShares Ultra S&P500 | | 71.63 | 26 | -0.25 | -2.76 | 10.08% |
| UPRO | ProShares UltraPro S&P500 | | 62.51 | 26 | -0.41 | -4.13 | 14.19% |
| SPXL | Direxion Daily S&P500 Bull 3X ETF | | 118.68 | 26 | -0.49 | -4.17 | 14.13% |
| SH | ProShares Short S&P500 | | 12.38 | 74 | 0.41 | 1.56 | -4.7% |
| SDS | ProShares UltraShort S&P500 | | 26.91 | 74 | 0.34 | 2.83 | -10.06% |
| SPXU | ProShares UltraPro Short S&P500 | | 36.33 | 74 | 0.51 | 4.2 | -15.52% |
| SPXS | Direxion Daily S&P 500 Bear 3X ETF | | 9.83 | 64 | 0.61 | 4.35 | -14.89% |
| 12Stocks.com: Charts, Trends, Fundamental Data and Performances of S&P 500 Stocks | |
|
We now take in-depth look at all S&P 500 stocks including charts, multi-period performances and overall trends (as measured by Smart Investing & Trading Score). One can sort S&P 500 stocks (click link to choose) by Daily, Weekly and by Year-to-Date performances. Also, one can sort by size of the company or by market capitalization. |
| Select Your Default Chart Type: | |||||
| |||||
| Click on stock symbol or name for detailed view. Click on to add stock symbol to your watchlist and to view watchlist. Quick View: Move mouse or cursor over "Daily" to quickly view daily technical stock chart and over "Weekly" to view weekly technical stock chart. | |||||

 | MO Altria Group, Inc. |
| Sector: Consumer Staples | |
| SubSector: Cigarettes | |
| MarketCap: 70806.3 Millions | |
| Recent Price: 40.80 Smart Investing & Trading Score: 46 | |
| Day Percent Change: -0.37% Day Change: -0.15 | |
| Week Change: -0.61% Year-to-date Change: 1.1% | |
| MO Links: Profile News Message Board | |
| Charts:- Daily , Weekly | |
| Add MO to Watchlist: View: Get MO Trend Analysis ➞ | |
 | ZBH Zimmer Biomet Holdings, Inc. |
| Sector: Health Care | |
| SubSector: Medical Appliances & Equipment | |
| MarketCap: 19339.4 Millions | |
| Recent Price: 122.86 Smart Investing & Trading Score: 10 | |
| Day Percent Change: -0.92% Day Change: -1.14 | |
| Week Change: -1.3% Year-to-date Change: 1.0% | |
| ZBH Links: Profile News Message Board | |
| Charts:- Daily , Weekly | |
| Add ZBH to Watchlist: View: Get ZBH Trend Analysis ➞ | |
 | FSLR First Solar, Inc. |
| Sector: Technology | |
| SubSector: Semiconductor - Specialized | |
| MarketCap: 3617.9 Millions | |
| Recent Price: 173.87 Smart Investing & Trading Score: 56 | |
| Day Percent Change: -1.19% Day Change: -2.09 | |
| Week Change: -5.73% Year-to-date Change: 0.9% | |
| FSLR Links: Profile News Message Board | |
| Charts:- Daily , Weekly | |
| Add FSLR to Watchlist: View: Get FSLR Trend Analysis ➞ | |
 | CSX CSX Corporation |
| Sector: Transports | |
| SubSector: Railroads | |
| MarketCap: 42131.2 Millions | |
| Recent Price: 34.89 Smart Investing & Trading Score: 10 | |
| Day Percent Change: -0.71% Day Change: -0.25 | |
| Week Change: -1.27% Year-to-date Change: 0.6% | |
| CSX Links: Profile News Message Board | |
| Charts:- Daily , Weekly | |
| Add CSX to Watchlist: View: Get CSX Trend Analysis ➞ | |
 | JKHY Jack Henry & Associates, Inc. |
| Sector: Technology | |
| SubSector: Information Technology Services | |
| MarketCap: 10695.4 Millions | |
| Recent Price: 164.44 Smart Investing & Trading Score: 10 | |
| Day Percent Change: -0.37% Day Change: -0.60 | |
| Week Change: -1.87% Year-to-date Change: 0.6% | |
| JKHY Links: Profile News Message Board | |
| Charts:- Daily , Weekly | |
| Add JKHY to Watchlist: View: Get JKHY Trend Analysis ➞ | |
 | IP International Paper Company |
| Sector: Consumer Staples | |
| SubSector: Packaging & Containers | |
| MarketCap: 13031.3 Millions | |
| Recent Price: 36.36 Smart Investing & Trading Score: 31 | |
| Day Percent Change: -1.12% Day Change: -0.41 | |
| Week Change: -2.1% Year-to-date Change: 0.6% | |
| IP Links: Profile News Message Board | |
| Charts:- Daily , Weekly | |
| Add IP to Watchlist: View: Get IP Trend Analysis ➞ | |
 | FE FirstEnergy Corp. |
| Sector: Utilities | |
| SubSector: Electric Utilities | |
| MarketCap: 20754.1 Millions | |
| Recent Price: 36.87 Smart Investing & Trading Score: 23 | |
| Day Percent Change: -1.42% Day Change: -0.53 | |
| Week Change: -1.44% Year-to-date Change: 0.6% | |
| FE Links: Profile News Message Board | |
| Charts:- Daily , Weekly | |
| Add FE to Watchlist: View: Get FE Trend Analysis ➞ | |
 | KMI Kinder Morgan, Inc. |
| Sector: Energy | |
| SubSector: Oil & Gas Pipelines | |
| MarketCap: 31283.5 Millions | |
| Recent Price: 17.71 Smart Investing & Trading Score: 36 | |
| Day Percent Change: -1.45% Day Change: -0.26 | |
| Week Change: -2.32% Year-to-date Change: 0.4% | |
| KMI Links: Profile News Message Board | |
| Charts:- Daily , Weekly | |
| Add KMI to Watchlist: View: Get KMI Trend Analysis ➞ | |
 | LMT Lockheed Martin Corporation |
| Sector: Industrials | |
| SubSector: Aerospace/Defense Products & Services | |
| MarketCap: 94116.4 Millions | |
| Recent Price: 454.81 Smart Investing & Trading Score: 85 | |
| Day Percent Change: 0.38% Day Change: 1.73 | |
| Week Change: 0.98% Year-to-date Change: 0.4% | |
| LMT Links: Profile News Message Board | |
| Charts:- Daily , Weekly | |
| Add LMT to Watchlist: View: Get LMT Trend Analysis ➞ | |
 | NXPI NXP Semiconductors N.V. |
| Sector: Technology | |
| SubSector: Semiconductor - Broad Line | |
| MarketCap: 22497.9 Millions | |
| Recent Price: 230.20 Smart Investing & Trading Score: 26 | |
| Day Percent Change: 0.04% Day Change: 0.09 | |
| Week Change: -1.46% Year-to-date Change: 0.2% | |
| NXPI Links: Profile News Message Board | |
| Charts:- Daily , Weekly | |
| Add NXPI to Watchlist: View: Get NXPI Trend Analysis ➞ | |
 | HPE Hewlett Packard Enterprise Company |
| Sector: Technology | |
| SubSector: Communication Equipment | |
| MarketCap: 12886.1 Millions | |
| Recent Price: 16.99 Smart Investing & Trading Score: 36 | |
| Day Percent Change: -1.56% Day Change: -0.27 | |
| Week Change: -2.47% Year-to-date Change: 0.1% | |
| HPE Links: Profile News Message Board | |
| Charts:- Daily , Weekly | |
| Add HPE to Watchlist: View: Get HPE Trend Analysis ➞ | |
 | LYV Live Nation Entertainment, Inc. |
| Sector: Services & Goods | |
| SubSector: Entertainment - Diversified | |
| MarketCap: 8457.17 Millions | |
| Recent Price: 93.55 Smart Investing & Trading Score: 26 | |
| Day Percent Change: -6.23% Day Change: -6.22 | |
| Week Change: -7.41% Year-to-date Change: -0.1% | |
| LYV Links: Profile News Message Board | |
| Charts:- Daily , Weekly | |
| Add LYV to Watchlist: View: Get LYV Trend Analysis ➞ | |
 | MOH Molina Healthcare, Inc. |
| Sector: Health Care | |
| SubSector: Health Care Plans | |
| MarketCap: 7235.6 Millions | |
| Recent Price: 361.07 Smart Investing & Trading Score: 43 | |
| Day Percent Change: 0.06% Day Change: 0.22 | |
| Week Change: -4.11% Year-to-date Change: -0.1% | |
| MOH Links: Profile News Message Board | |
| Charts:- Daily , Weekly | |
| Add MOH to Watchlist: View: Get MOH Trend Analysis ➞ | |
 | MTB M&T Bank Corporation |
| Sector: Financials | |
| SubSector: Regional - Northeast Banks | |
| MarketCap: 13950.9 Millions | |
| Recent Price: 136.97 Smart Investing & Trading Score: 42 | |
| Day Percent Change: -2.82% Day Change: -3.97 | |
| Week Change: 1.79% Year-to-date Change: -0.1% | |
| MTB Links: Profile News Message Board | |
| Charts:- Daily , Weekly | |
| Add MTB to Watchlist: View: Get MTB Trend Analysis ➞ | |
 | CBOE Cboe Global Markets, Inc. |
| Sector: Financials | |
| SubSector: Diversified Investments | |
| MarketCap: 8834.5 Millions | |
| Recent Price: 178.34 Smart Investing & Trading Score: 18 | |
| Day Percent Change: 0.54% Day Change: 0.97 | |
| Week Change: -0.1% Year-to-date Change: -0.1% | |
| CBOE Links: Profile News Message Board | |
| Charts:- Daily , Weekly | |
| Add CBOE to Watchlist: View: Get CBOE Trend Analysis ➞ | |
 | TJX The TJX Companies, Inc. |
| Sector: Services & Goods | |
| SubSector: Department Stores | |
| MarketCap: 50656.2 Millions | |
| Recent Price: 93.67 Smart Investing & Trading Score: 10 | |
| Day Percent Change: 0.74% Day Change: 0.69 | |
| Week Change: -0.79% Year-to-date Change: -0.2% | |
| TJX Links: Profile News Message Board | |
| Charts:- Daily , Weekly | |
| Add TJX to Watchlist: View: Get TJX Trend Analysis ➞ | |
 | EXC Exelon Corporation |
| Sector: Utilities | |
| SubSector: Diversified Utilities | |
| MarketCap: 34091.9 Millions | |
| Recent Price: 35.84 Smart Investing & Trading Score: 36 | |
| Day Percent Change: -1.19% Day Change: -0.43 | |
| Week Change: -2.61% Year-to-date Change: -0.2% | |
| EXC Links: Profile News Message Board | |
| Charts:- Daily , Weekly | |
| Add EXC to Watchlist: View: Get EXC Trend Analysis ➞ | |
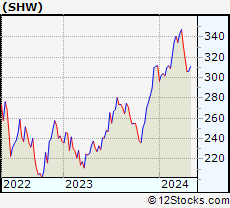 | SHW The Sherwin-Williams Company |
| Sector: Materials | |
| SubSector: Specialty Chemicals | |
| MarketCap: 40832.5 Millions | |
| Recent Price: 310.83 Smart Investing & Trading Score: 36 | |
| Day Percent Change: -1.00% Day Change: -3.14 | |
| Week Change: -2.33% Year-to-date Change: -0.3% | |
| SHW Links: Profile News Message Board | |
| Charts:- Daily , Weekly | |
| Add SHW to Watchlist: View: Get SHW Trend Analysis ➞ | |
 | TMUS T-Mobile US, Inc. |
| Sector: Technology | |
| SubSector: Wireless Communications | |
| MarketCap: 71949 Millions | |
| Recent Price: 159.56 Smart Investing & Trading Score: 15 | |
| Day Percent Change: -0.17% Day Change: -0.26 | |
| Week Change: -0.31% Year-to-date Change: -0.5% | |
| TMUS Links: Profile News Message Board | |
| Charts:- Daily , Weekly | |
| Add TMUS to Watchlist: View: Get TMUS Trend Analysis ➞ | |
 | ETR Entergy Corporation |
| Sector: Utilities | |
| SubSector: Electric Utilities | |
| MarketCap: 17545 Millions | |
| Recent Price: 100.66 Smart Investing & Trading Score: 36 | |
| Day Percent Change: -1.59% Day Change: -1.63 | |
| Week Change: -2.19% Year-to-date Change: -0.5% | |
| ETR Links: Profile News Message Board | |
| Charts:- Daily , Weekly | |
| Add ETR to Watchlist: View: Get ETR Trend Analysis ➞ | |
 | IQV IQVIA Holdings Inc. |
| Sector: Health Care | |
| SubSector: Medical Laboratories & Research | |
| MarketCap: 19616.5 Millions | |
| Recent Price: 230.06 Smart Investing & Trading Score: 36 | |
| Day Percent Change: -0.48% Day Change: -1.10 | |
| Week Change: -1.78% Year-to-date Change: -0.6% | |
| IQV Links: Profile News Message Board | |
| Charts:- Daily , Weekly | |
| Add IQV to Watchlist: View: Get IQV Trend Analysis ➞ | |
 | GNRC Generac Holdings Inc. |
| Sector: Industrials | |
| SubSector: Diversified Machinery | |
| MarketCap: 5736.26 Millions | |
| Recent Price: 128.42 Smart Investing & Trading Score: 56 | |
| Day Percent Change: -0.07% Day Change: -0.09 | |
| Week Change: -2.53% Year-to-date Change: -0.6% | |
| GNRC Links: Profile News Message Board | |
| Charts:- Daily , Weekly | |
| Add GNRC to Watchlist: View: Get GNRC Trend Analysis ➞ | |
 | NDSN Nordson Corporation |
| Sector: Industrials | |
| SubSector: Diversified Machinery | |
| MarketCap: 7117.56 Millions | |
| Recent Price: 262.47 Smart Investing & Trading Score: 31 | |
| Day Percent Change: -0.25% Day Change: -0.66 | |
| Week Change: -0.82% Year-to-date Change: -0.6% | |
| NDSN Links: Profile News Message Board | |
| Charts:- Daily , Weekly | |
| Add NDSN to Watchlist: View: Get NDSN Trend Analysis ➞ | |
 | D Dominion Energy, Inc. |
| Sector: Utilities | |
| SubSector: Electric Utilities | |
| MarketCap: 62365.3 Millions | |
| Recent Price: 46.70 Smart Investing & Trading Score: 36 | |
| Day Percent Change: -2.55% Day Change: -1.22 | |
| Week Change: -4.52% Year-to-date Change: -0.6% | |
| D Links: Profile News Message Board | |
| Charts:- Daily , Weekly | |
| Add D to Watchlist: View: Get D Trend Analysis ➞ | |
 | ALLE Allegion plc |
| Sector: Services & Goods | |
| SubSector: Security & Protection Services | |
| MarketCap: 8515.93 Millions | |
| Recent Price: 125.87 Smart Investing & Trading Score: 26 | |
| Day Percent Change: -0.84% Day Change: -1.07 | |
| Week Change: -1.22% Year-to-date Change: -0.7% | |
| ALLE Links: Profile News Message Board | |
| Charts:- Daily , Weekly | |
| Add ALLE to Watchlist: View: Get ALLE Trend Analysis ➞ | |
| For tabular summary view of above stock list: Summary View ➞ 0 - 25 , 25 - 50 , 50 - 75 , 75 - 100 , 100 - 125 , 125 - 150 , 150 - 175 , 175 - 200 , 200 - 225 , 225 - 250 , 250 - 275 , 275 - 300 , 300 - 325 , 325 - 350 , 350 - 375 , 375 - 400 , 400 - 425 , 425 - 450 , 450 - 475 , 475 - 500 | ||
| Click To Change The Sort Order: By Market Cap or Company Size Performance: Year-to-date, Week and Day | |
| Select Chart Type: | ||
|
Best Stocks Today 12Stocks.com |
© 2024 12Stocks.com Terms & Conditions Privacy Contact Us
All Information Provided Only For Education And Not To Be Used For Investing or Trading. See Terms & Conditions


One More Thing ... Get Best Stocks Delivered Daily!
Never Ever Miss A Move With Our Top Ten Stocks Lists
Find Best Stocks In Any Market - Bull or Bear Market
Take A Peek At Our Top Ten Stocks Lists: Daily, Weekly, Year-to-Date & Top Trends
Find Best Stocks In Any Market - Bull or Bear Market
Take A Peek At Our Top Ten Stocks Lists: Daily, Weekly, Year-to-Date & Top Trends
S&P 500 Stocks With Best Up Trends [0-bearish to 100-bullish]: Etsy [86], Lockheed Martin[85], Progressive [76], Charles Schwab[75], ProShares UltraPro[74], Church & Dwight Co[70], Morgan Stanley[68], Yum! Brands[68], Walmart [63], Google [63], Google [63]
Best S&P 500 Stocks Year-to-Date:
NVIDIA [76.4%], NRG [42.03%], Micron [41.41%], Marathon [37.47%], Western Digital[34.2%], Diamondback [31.13%], Targa Resources[30.86%], Progressive [30.04%], Eaton [29.91%], Valero [29.65%], Applied Materials[28.83%] Best S&P 500 Stocks This Week:
UnitedHealth [6.93%], Morgan Stanley[4.5%], ProShares UltraPro[4.2%], Humana [3.3%], Cardinal Health[2.46%], Goldman Sachs[2.43%], Church & Dwight Co[1.96%], Zoetis [1.93%], Centene [1.88%], General Mills[1.87%], Lamb Weston[1.83%] Best S&P 500 Stocks Daily:
UnitedHealth [5.39%], Morgan Stanley[3.54%], Etsy [2.95%], Humana [2.63%], Netflix [2.34%], Advanced Micro[2.11%], Zoetis [2.07%], O Reilly[1.73%], Lamb Weston[1.60%], NVIDIA [1.57%], Applied Materials[1.51%]