
 Login Sign Up


| |||||
 |  | ||||

| 12Stocks.com Market Intelligence |
Best S&P 500 Stocks
|
On this page, you will find the most comprehensive analysis of S&P 500 stocks and ETFs - from latest trends to performances to charts ➞. First, here are the year-to-date (YTD) performances of the most requested S&P 500 stocks at 12Stocks.com (click stock for review):
| NVIDIA 66% | ||
| Caterpillar 23% | ||
| Amazon.com 18% | ||
| Merck 16% | ||
| Google 13% | ||
| JPMorgan Chase 13% | ||
| Walmart 12% | ||
| Goldman Sachs 10% | ||
| Chevron 9% | ||
| Microsoft 8% | ||
| Johnson & Johnson -5% | ||
| McDonald s -7% | ||
| Starbucks -8% | ||
| Apple -13% | ||
| Gilead -17% | ||
| Intel -32% | ||
| Boeing -35% | ||
| Quick: S&P 500 Stocks Lists: Performances & Trends, S&P 500 Stock Charts
Sort S&P 500 stocks: Daily, Weekly, Year-to-Date, Market Cap & Trends. Filter S&P 500 stocks list by sector: Show all, Tech, Finance, Energy, Staples, Retail, Industrial, Materials, Utilities and HealthCare |
| 12Stocks.com S&P 500 Stocks Performances & Trends Daily Report | |||||||||
|
| 
The overall Smart Investing & Trading Score is 58 (0-bearish to 100-bullish) which puts S&P 500 index in short term neutral trend. The Smart Investing & Trading Score from previous trading session is 51 and hence an improvement of trend. | ||||||||
Here are the Smart Investing & Trading Scores of the most requested S&P 500 stocks at 12Stocks.com (click stock name for detailed review):
|


| 12Stocks.com: Top Performing S&P 500 Index Stocks | ||||||||||||||||||||||||||||||||||||||||||||||||
 The top performing S&P 500 Index stocks year to date are
Now, more recently, over last week, the top performing S&P 500 Index stocks on the move are


|
||||||||||||||||||||||||||||||||||||||||||||||||
| 12Stocks.com: Investing in S&P 500 Index with Stocks | |
|
The following table helps investors and traders sort through current performance and trends (as measured by Smart Investing & Trading Score) of various
stocks in the S&P 500 Index. Quick View: Move mouse or cursor over stock symbol (ticker) to view short-term technical chart and over stock name to view long term chart. Click on  to add stock symbol to your watchlist and to add stock symbol to your watchlist and  to view watchlist. Click on any ticker or stock name for detailed market intelligence report for that stock. to view watchlist. Click on any ticker or stock name for detailed market intelligence report for that stock. |
12Stocks.com Performance of Stocks in S&P 500 Index
| Ticker | Stock Name | Watchlist | Category | Recent Price | Smart Investing & Trading Score | Change % | YTD Change% |
| NEE | NextEra |   | Utilities | 66.20 | 100 | 1.36% | 8.99% |
| OTIS | Otis Worldwide | | Industrials | 97.47 | 76 | 1.23% | 8.94% |
| OMC | Omnicom | | Services & Goods | 94.22 | 95 | 0.48% | 8.91% |
| HES | Hess | | Energy | 156.94 | 93 | 0.45% | 8.87% |
| PEG | Public Service | | Utilities | 66.49 | 83 | -0.33% | 8.73% |
| GIS | General Mills | | Consumer Staples | 70.82 | 95 | -0.49% | 8.72% |
| BG | Bunge | | Consumer Staples | 109.62 | 93 | -0.12% | 8.59% |
| MA | Mastercard | | Financials | 462.82 | 58 | 1.33% | 8.51% |
| MRNA | Moderna | | Health Care | 107.87 | 75 | 3.26% | 8.47% |
| WYNN | Wynn Resorts | | Services & Goods | 98.81 | 58 | 1.36% | 8.45% |
| LIN | Linde | | Materials | 445.12 | 36 | -0.41% | 8.38% |
| MSFT | Microsoft | | Technology | 407.24 | 58 | 1.57% | 8.30% |
| TMO | Thermo Fisher | | Health Care | 574.59 | 85 | 4.78% | 8.25% |
| STZ | Constellation Brands | | Consumer Staples | 261.66 | 61 | 0.74% | 8.24% |
| HLT | Hilton Worldwide | | Services & Goods | 197.04 | 43 | 0.97% | 8.21% |
| UHS | Universal Health | | Health Care | 164.91 | 58 | 2.35% | 8.18% |
| PRU | Prudential Financial | | Financials | 112.05 | 70 | 0.52% | 8.04% |
| HOLX | Hologic | | Health Care | 77.19 | 68 | 1.27% | 8.03% |
| DXCM | DexCom | | Health Care | 134.03 | 61 | 1.90% | 8.01% |
| PNR | Pentair | | Industrials | 78.47 | 44 | -0.92% | 7.92% |
| D | Dominion | | Utilities | 50.67 | 100 | 0.08% | 7.81% |
| EMN | Eastman Chemical | | Materials | 96.80 | 68 | -0.27% | 7.77% |
| FITB | Fifth Third | | Financials | 37.06 | 100 | 1.40% | 7.45% |
| FDX | FedEx | | Transports | 271.75 | 78 | 0.59% | 7.42% |
| AMP | Ameriprise Financial | | Financials | 407.69 | 26 | -3.25% | 7.33% |
| For chart view version of above stock list: Chart View ➞ 0 - 25 , 25 - 50 , 50 - 75 , 75 - 100 , 100 - 125 , 125 - 150 , 150 - 175 , 175 - 200 , 200 - 225 , 225 - 250 , 250 - 275 , 275 - 300 , 300 - 325 , 325 - 350 , 350 - 375 , 375 - 400 , 400 - 425 , 425 - 450 , 450 - 475 , 475 - 500 | ||
 | Click To Change The Sort Order: By Market Cap or Company Size Performance: Year-to-date, Week and Day |  |
|
Get the most comprehensive stock market coverage daily at 12Stocks.com ➞ Best Stocks Today ➞ Best Stocks Weekly ➞ Best Stocks Year-to-Date ➞ Best Stocks Trends ➞  Best Stocks Today 12Stocks.com Best Nasdaq Stocks ➞ Best S&P 500 Stocks ➞ Best Tech Stocks ➞ Best Biotech Stocks ➞ |
| Detailed Overview of S&P 500 Stocks |
| S&P 500 Technical Overview, Leaders & Laggards, Top S&P 500 ETF Funds & Detailed S&P 500 Stocks List, Charts, Trends & More |
| S&P 500: Technical Analysis, Trends & YTD Performance | |
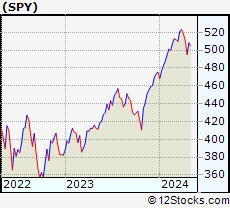
| S&P 500 index as represented by
SPY, an exchange-traded fund [ETF], holds basket of five hundred (mostly largecap) stocks from across all major sectors of the US stock market. The S&P 500 index (contains stocks like Apple and Exxon) is up by 6.38% and is currently outperforming the overall market by 0.74% year-to-date. Below is a quick view of technical charts and trends: | |
 SPY Weekly Chart |
|
| Long Term Trend: Good | |
| Medium Term Trend: Not Good | |
 SPY Daily Chart |
|
| Short Term Trend: Very Good | |
| Overall Trend Score: 58 | |
| YTD Performance: 6.38% | |
| **Trend Scores & Views Are Only For Educational Purposes And Not For Investing | |
| 12Stocks.com: Investing in S&P 500 Index using Exchange Traded Funds | |
|
The following table shows list of key exchange traded funds (ETF) that
help investors track S&P 500 index. The following list also includes leveraged ETF funds that track twice or thrice the daily returns of S&P 500 indices. Short or inverse ETF funds move in the opposite direction to the index they track and are useful during market pullbacks or during bear markets. Quick View: Move mouse or cursor over ETF symbol (ticker) to view short-term technical chart and over ETF name to view long term chart. Click on ticker or stock name for detailed view. Click on to add stock symbol to your watchlist and to view watchlist. |
12Stocks.com List of ETFs that track S&P 500 Index
| Ticker | ETF Name | Watchlist | Recent Price | Smart Investing & Trading Score | Change % | Week % | Year-to-date % |
| SPY | SPDR S&P 500 ETF | | 505.65 | 58 | 1.19 | 2.12 | 6.38% |
| IVV | iShares Core S&P 500 ETF | | 506.60 | 58 | 1.69 | 1.82 | 6.06% |
| VOO | Vanguard 500 ETF | | 463.37 | 58 | 1.70 | 1.82 | 6.08% |
| OEF | iShares S&P 100 | | 239.95 | 58 | 1.33 | 2.25 | 7.41% |
| SSO | ProShares Ultra S&P500 | | 72.04 | 63 | 2.43 | 4.24 | 10.71% |
| UPRO | ProShares UltraPro S&P500 | | 62.93 | 58 | 3.59 | 6.37 | 14.96% |
| SPXL | Direxion Daily S&P500 Bull 3X ETF | | 118.62 | 58 | 2.75 | 5.39 | 14.07% |
| SH | ProShares Short S&P500 | | 12.34 | 42 | -1.20 | -1.99 | -5% |
| SDS | ProShares UltraShort S&P500 | | 26.78 | 37 | -2.30 | -4.01 | -10.49% |
| SPXU | ProShares UltraPro Short S&P500 | | 35.99 | 42 | -3.62 | -6.1 | -16.3% |
| SPXS | Direxion Daily S&P 500 Bear 3X ETF | | 9.82 | 32 | -4.75 | -5.21 | -14.98% |
| 12Stocks.com: Charts, Trends, Fundamental Data and Performances of S&P 500 Stocks | |
|
We now take in-depth look at all S&P 500 stocks including charts, multi-period performances and overall trends (as measured by Smart Investing & Trading Score). One can sort S&P 500 stocks (click link to choose) by Daily, Weekly and by Year-to-Date performances. Also, one can sort by size of the company or by market capitalization. |
| Select Your Default Chart Type: | |||||
| |||||
| Click on stock symbol or name for detailed view. Click on to add stock symbol to your watchlist and to view watchlist. Quick View: Move mouse or cursor over "Daily" to quickly view daily technical stock chart and over "Weekly" to view weekly technical stock chart. | |||||

 | NEE NextEra Energy, Inc. |
| Sector: Utilities | |
| SubSector: Electric Utilities | |
| MarketCap: 108288 Millions | |
| Recent Price: 66.20 Smart Investing & Trading Score: 100 | |
| Day Percent Change: 1.36% Day Change: 0.89 | |
| Week Change: 2.95% Year-to-date Change: 9.0% | |
| NEE Links: Profile News Message Board | |
| Charts:- Daily , Weekly | |
| Add NEE to Watchlist: View: Get NEE Trend Analysis ➞ | |
 | OTIS Otis Worldwide Corporation |
| Sector: Industrials | |
| SubSector: Specialty Industrial Machinery | |
| MarketCap: 27727 Millions | |
| Recent Price: 97.47 Smart Investing & Trading Score: 76 | |
| Day Percent Change: 1.23% Day Change: 1.18 | |
| Week Change: 1.76% Year-to-date Change: 8.9% | |
| OTIS Links: Profile News Message Board | |
| Charts:- Daily , Weekly | |
| Add OTIS to Watchlist: View: Get OTIS Trend Analysis ➞ | |
 | OMC Omnicom Group Inc. |
| Sector: Services & Goods | |
| SubSector: Advertising Agencies | |
| MarketCap: 11813.5 Millions | |
| Recent Price: 94.22 Smart Investing & Trading Score: 95 | |
| Day Percent Change: 0.48% Day Change: 0.45 | |
| Week Change: 1.73% Year-to-date Change: 8.9% | |
| OMC Links: Profile News Message Board | |
| Charts:- Daily , Weekly | |
| Add OMC to Watchlist: View: Get OMC Trend Analysis ➞ | |
 | HES Hess Corporation |
| Sector: Energy | |
| SubSector: Independent Oil & Gas | |
| MarketCap: 10465.3 Millions | |
| Recent Price: 156.94 Smart Investing & Trading Score: 93 | |
| Day Percent Change: 0.45% Day Change: 0.71 | |
| Week Change: 1.68% Year-to-date Change: 8.9% | |
| HES Links: Profile News Message Board | |
| Charts:- Daily , Weekly | |
| Add HES to Watchlist: View: Get HES Trend Analysis ➞ | |
 | PEG Public Service Enterprise Group Incorporated |
| Sector: Utilities | |
| SubSector: Diversified Utilities | |
| MarketCap: 20886 Millions | |
| Recent Price: 66.49 Smart Investing & Trading Score: 83 | |
| Day Percent Change: -0.33% Day Change: -0.22 | |
| Week Change: 1.14% Year-to-date Change: 8.7% | |
| PEG Links: Profile News Message Board | |
| Charts:- Daily , Weekly | |
| Add PEG to Watchlist: View: Get PEG Trend Analysis ➞ | |
 | GIS General Mills, Inc. |
| Sector: Consumer Staples | |
| SubSector: Processed & Packaged Goods | |
| MarketCap: 34131.7 Millions | |
| Recent Price: 70.82 Smart Investing & Trading Score: 95 | |
| Day Percent Change: -0.49% Day Change: -0.35 | |
| Week Change: 0.57% Year-to-date Change: 8.7% | |
| GIS Links: Profile News Message Board | |
| Charts:- Daily , Weekly | |
| Add GIS to Watchlist: View: Get GIS Trend Analysis ➞ | |
 | BG Bunge Limited |
| Sector: Consumer Staples | |
| SubSector: Farm Products | |
| MarketCap: 4975.77 Millions | |
| Recent Price: 109.62 Smart Investing & Trading Score: 93 | |
| Day Percent Change: -0.12% Day Change: -0.13 | |
| Week Change: 0.09% Year-to-date Change: 8.6% | |
| BG Links: Profile News Message Board | |
| Charts:- Daily , Weekly | |
| Add BG to Watchlist: View: Get BG Trend Analysis ➞ | |
 | MA Mastercard Incorporated |
| Sector: Financials | |
| SubSector: Credit Services | |
| MarketCap: 234809 Millions | |
| Recent Price: 462.82 Smart Investing & Trading Score: 58 | |
| Day Percent Change: 1.33% Day Change: 6.07 | |
| Week Change: 1.63% Year-to-date Change: 8.5% | |
| MA Links: Profile News Message Board | |
| Charts:- Daily , Weekly | |
| Add MA to Watchlist: View: Get MA Trend Analysis ➞ | |
 | MRNA Moderna, Inc. |
| Sector: Health Care | |
| SubSector: Biotechnology | |
| MarketCap: 11006.4 Millions | |
| Recent Price: 107.87 Smart Investing & Trading Score: 75 | |
| Day Percent Change: 3.26% Day Change: 3.41 | |
| Week Change: 6.34% Year-to-date Change: 8.5% | |
| MRNA Links: Profile News Message Board | |
| Charts:- Daily , Weekly | |
| Add MRNA to Watchlist: View: Get MRNA Trend Analysis ➞ | |
 | WYNN Wynn Resorts, Limited |
| Sector: Services & Goods | |
| SubSector: Resorts & Casinos | |
| MarketCap: 6643.34 Millions | |
| Recent Price: 98.81 Smart Investing & Trading Score: 58 | |
| Day Percent Change: 1.36% Day Change: 1.33 | |
| Week Change: 4.02% Year-to-date Change: 8.5% | |
| WYNN Links: Profile News Message Board | |
| Charts:- Daily , Weekly | |
| Add WYNN to Watchlist: View: Get WYNN Trend Analysis ➞ | |
 | LIN Linde plc |
| Sector: Materials | |
| SubSector: Specialty Chemicals | |
| MarketCap: 88539.2 Millions | |
| Recent Price: 445.12 Smart Investing & Trading Score: 36 | |
| Day Percent Change: -0.41% Day Change: -1.85 | |
| Week Change: -0.27% Year-to-date Change: 8.4% | |
| LIN Links: Profile News Message Board | |
| Charts:- Daily , Weekly | |
| Add LIN to Watchlist: View: Get LIN Trend Analysis ➞ | |
 | MSFT Microsoft Corporation |
| Sector: Technology | |
| SubSector: Business Software & Services | |
| MarketCap: 1154150 Millions | |
| Recent Price: 407.24 Smart Investing & Trading Score: 58 | |
| Day Percent Change: 1.57% Day Change: 6.28 | |
| Week Change: 2.03% Year-to-date Change: 8.3% | |
| MSFT Links: Profile News Message Board | |
| Charts:- Daily , Weekly | |
| Add MSFT to Watchlist: View: Get MSFT Trend Analysis ➞ | |
 | TMO Thermo Fisher Scientific Inc. |
| Sector: Health Care | |
| SubSector: Medical Laboratories & Research | |
| MarketCap: 112999 Millions | |
| Recent Price: 574.59 Smart Investing & Trading Score: 85 | |
| Day Percent Change: 4.78% Day Change: 26.21 | |
| Week Change: 5.47% Year-to-date Change: 8.3% | |
| TMO Links: Profile News Message Board | |
| Charts:- Daily , Weekly | |
| Add TMO to Watchlist: View: Get TMO Trend Analysis ➞ | |
 | STZ Constellation Brands, Inc. |
| Sector: Consumer Staples | |
| SubSector: Beverages - Wineries & Distillers | |
| MarketCap: 27394.5 Millions | |
| Recent Price: 261.66 Smart Investing & Trading Score: 61 | |
| Day Percent Change: 0.74% Day Change: 1.92 | |
| Week Change: 0.37% Year-to-date Change: 8.2% | |
| STZ Links: Profile News Message Board | |
| Charts:- Daily , Weekly | |
| Add STZ to Watchlist: View: Get STZ Trend Analysis ➞ | |
 | HLT Hilton Worldwide Holdings Inc. |
| Sector: Services & Goods | |
| SubSector: Lodging | |
| MarketCap: 18064.6 Millions | |
| Recent Price: 197.04 Smart Investing & Trading Score: 43 | |
| Day Percent Change: 0.97% Day Change: 1.90 | |
| Week Change: 1.32% Year-to-date Change: 8.2% | |
| HLT Links: Profile News Message Board | |
| Charts:- Daily , Weekly | |
| Add HLT to Watchlist: View: Get HLT Trend Analysis ➞ | |
 | UHS Universal Health Services, Inc. |
| Sector: Health Care | |
| SubSector: Hospitals | |
| MarketCap: 7217.66 Millions | |
| Recent Price: 164.91 Smart Investing & Trading Score: 58 | |
| Day Percent Change: 2.35% Day Change: 3.78 | |
| Week Change: 4.72% Year-to-date Change: 8.2% | |
| UHS Links: Profile News Message Board | |
| Charts:- Daily , Weekly | |
| Add UHS to Watchlist: View: Get UHS Trend Analysis ➞ | |
 | PRU Prudential Financial, Inc. |
| Sector: Financials | |
| SubSector: Life Insurance | |
| MarketCap: 21001.6 Millions | |
| Recent Price: 112.05 Smart Investing & Trading Score: 70 | |
| Day Percent Change: 0.52% Day Change: 0.58 | |
| Week Change: 1.3% Year-to-date Change: 8.0% | |
| PRU Links: Profile News Message Board | |
| Charts:- Daily , Weekly | |
| Add PRU to Watchlist: View: Get PRU Trend Analysis ➞ | |
 | HOLX Hologic, Inc. |
| Sector: Health Care | |
| SubSector: Medical Instruments & Supplies | |
| MarketCap: 9075.2 Millions | |
| Recent Price: 77.19 Smart Investing & Trading Score: 68 | |
| Day Percent Change: 1.27% Day Change: 0.97 | |
| Week Change: 2.4% Year-to-date Change: 8.0% | |
| HOLX Links: Profile News Message Board | |
| Charts:- Daily , Weekly | |
| Add HOLX to Watchlist: View: Get HOLX Trend Analysis ➞ | |
 | DXCM DexCom, Inc. |
| Sector: Health Care | |
| SubSector: Medical Laboratories & Research | |
| MarketCap: 19559 Millions | |
| Recent Price: 134.03 Smart Investing & Trading Score: 61 | |
| Day Percent Change: 1.90% Day Change: 2.50 | |
| Week Change: 2.54% Year-to-date Change: 8.0% | |
| DXCM Links: Profile News Message Board | |
| Charts:- Daily , Weekly | |
| Add DXCM to Watchlist: View: Get DXCM Trend Analysis ➞ | |
 | PNR Pentair plc |
| Sector: Industrials | |
| SubSector: Industrial Equipment & Components | |
| MarketCap: 4326.59 Millions | |
| Recent Price: 78.47 Smart Investing & Trading Score: 44 | |
| Day Percent Change: -0.92% Day Change: -0.73 | |
| Week Change: -0.08% Year-to-date Change: 7.9% | |
| PNR Links: Profile News Message Board | |
| Charts:- Daily , Weekly | |
| Add PNR to Watchlist: View: Get PNR Trend Analysis ➞ | |
 | D Dominion Energy, Inc. |
| Sector: Utilities | |
| SubSector: Electric Utilities | |
| MarketCap: 62365.3 Millions | |
| Recent Price: 50.67 Smart Investing & Trading Score: 100 | |
| Day Percent Change: 0.08% Day Change: 0.04 | |
| Week Change: 1.67% Year-to-date Change: 7.8% | |
| D Links: Profile News Message Board | |
| Charts:- Daily , Weekly | |
| Add D to Watchlist: View: Get D Trend Analysis ➞ | |
 | EMN Eastman Chemical Company |
| Sector: Materials | |
| SubSector: Chemicals - Major Diversified | |
| MarketCap: 6217.06 Millions | |
| Recent Price: 96.80 Smart Investing & Trading Score: 68 | |
| Day Percent Change: -0.27% Day Change: -0.26 | |
| Week Change: 0.39% Year-to-date Change: 7.8% | |
| EMN Links: Profile News Message Board | |
| Charts:- Daily , Weekly | |
| Add EMN to Watchlist: View: Get EMN Trend Analysis ➞ | |
 | FITB Fifth Third Bancorp |
| Sector: Financials | |
| SubSector: Regional - Midwest Banks | |
| MarketCap: 10197 Millions | |
| Recent Price: 37.06 Smart Investing & Trading Score: 100 | |
| Day Percent Change: 1.40% Day Change: 0.51 | |
| Week Change: 2.23% Year-to-date Change: 7.5% | |
| FITB Links: Profile News Message Board | |
| Charts:- Daily , Weekly | |
| Add FITB to Watchlist: View: Get FITB Trend Analysis ➞ | |
 | FDX FedEx Corporation |
| Sector: Transports | |
| SubSector: Air Delivery & Freight Services | |
| MarketCap: 33188 Millions | |
| Recent Price: 271.75 Smart Investing & Trading Score: 78 | |
| Day Percent Change: 0.59% Day Change: 1.60 | |
| Week Change: 1.78% Year-to-date Change: 7.4% | |
| FDX Links: Profile News Message Board | |
| Charts:- Daily , Weekly | |
| Add FDX to Watchlist: View: Get FDX Trend Analysis ➞ | |
 | AMP Ameriprise Financial, Inc. |
| Sector: Financials | |
| SubSector: Asset Management | |
| MarketCap: 13270.5 Millions | |
| Recent Price: 407.69 Smart Investing & Trading Score: 26 | |
| Day Percent Change: -3.25% Day Change: -13.69 | |
| Week Change: -2.23% Year-to-date Change: 7.3% | |
| AMP Links: Profile News Message Board | |
| Charts:- Daily , Weekly | |
| Add AMP to Watchlist: View: Get AMP Trend Analysis ➞ | |
| For tabular summary view of above stock list: Summary View ➞ 0 - 25 , 25 - 50 , 50 - 75 , 75 - 100 , 100 - 125 , 125 - 150 , 150 - 175 , 175 - 200 , 200 - 225 , 225 - 250 , 250 - 275 , 275 - 300 , 300 - 325 , 325 - 350 , 350 - 375 , 375 - 400 , 400 - 425 , 425 - 450 , 450 - 475 , 475 - 500 | ||
| Click To Change The Sort Order: By Market Cap or Company Size Performance: Year-to-date, Week and Day | |
| Select Chart Type: | ||
|
Best Stocks Today 12Stocks.com |
© 2024 12Stocks.com Terms & Conditions Privacy Contact Us
All Information Provided Only For Education And Not To Be Used For Investing or Trading. See Terms & Conditions


One More Thing ... Get Best Stocks Delivered Daily!
Never Ever Miss A Move With Our Top Ten Stocks Lists
Find Best Stocks In Any Market - Bull or Bear Market
Take A Peek At Our Top Ten Stocks Lists: Daily, Weekly, Year-to-Date & Top Trends
Find Best Stocks In Any Market - Bull or Bear Market
Take A Peek At Our Top Ten Stocks Lists: Daily, Weekly, Year-to-Date & Top Trends
S&P 500 Stocks With Best Up Trends [0-bearish to 100-bullish]: Danaher [100], Kimberly-Clark [100], Quest Diagnostics[100], Hasbro [100], Philip Morris[100], American Express[100], Morgan Stanley[100], Federal Realty[100], Bank of America[100], Goldman Sachs[100], Generac Holdings[100]
Best S&P 500 Stocks Year-to-Date:
NVIDIA [66.36%], Constellation [60.75%], Meta Platforms[40.09%], NRG [38.28%], Marathon [34.57%], Progressive [34.37%], Western Digital[33.56%], Targa Resources[33.54%], Diamondback [31.82%], Micron [31.73%], United Airlines[30.93%] Best S&P 500 Stocks This Week:
Globe Life[13.52%], General Electric[9.83%], NVIDIA [8.12%], Danaher [7.47%], Enphase [7.28%], Kimberly-Clark [7.26%], Pulte [6.95%], Norwegian Cruise[6.83%], Ford Motor[6.59%], General Motors[6.44%], Quest Diagnostics[6.43%] Best S&P 500 Stocks Daily:
Globe Life[14.11%], General Electric[8.28%], Danaher [7.21%], Kimberly-Clark [5.51%], Norwegian Cruise[5.39%], United Rentals[5.09%], Quest Diagnostics[5.08%], Builders FirstSource[5.07%], Thermo Fisher[4.78%], Waters [4.70%], Pulte [4.57%]