
 Login Sign Up


| |||||
 |  | ||||

| 12Stocks.com Market Intelligence |
Best S&P 500 Stocks
|
On this page, you will find the most comprehensive analysis of S&P 500 stocks and ETFs - from latest trends to performances to charts ➞. First, here are the year-to-date (YTD) performances of the most requested S&P 500 stocks at 12Stocks.com (click stock for review):
| NVIDIA 77% | ||
| Amazon.com 22% | ||
| Google 18% | ||
| Merck 17% | ||
| Goldman Sachs 14% | ||
| Caterpillar 13% | ||
| Walmart 13% | ||
| JPMorgan Chase 12% | ||
| Microsoft 8% | ||
| Chevron 5% | ||
| Apple -4% | ||
| Johnson & Johnson -5% | ||
| McDonald s -9% | ||
| Gilead -20% | ||
| Starbucks -23% | ||
| Boeing -31% | ||
| Intel -39% | ||
| Quick: S&P 500 Stocks Lists: Performances & Trends, S&P 500 Stock Charts
Sort S&P 500 stocks: Daily, Weekly, Year-to-Date, Market Cap & Trends. Filter S&P 500 stocks list by sector: Show all, Tech, Finance, Energy, Staples, Retail, Industrial, Materials, Utilities and HealthCare |
| 12Stocks.com S&P 500 Stocks Performances & Trends Daily Report | |||||||||
|
| 
The overall Smart Investing & Trading Score is 60 (0-bearish to 100-bullish) which puts S&P 500 index in short term neutral to bullish trend. The Smart Investing & Trading Score from previous trading session is 30 and hence an improvement of trend. | ||||||||
Here are the Smart Investing & Trading Scores of the most requested S&P 500 stocks at 12Stocks.com (click stock name for detailed review):
|


| 12Stocks.com: Top Performing S&P 500 Index Stocks | ||||||||||||||||||||||||||||||||||||||||||||||||
 The top performing S&P 500 Index stocks year to date are
Now, more recently, over last week, the top performing S&P 500 Index stocks on the move are


|
||||||||||||||||||||||||||||||||||||||||||||||||
| 12Stocks.com: Investing in S&P 500 Index with Stocks | |
|
The following table helps investors and traders sort through current performance and trends (as measured by Smart Investing & Trading Score) of various
stocks in the S&P 500 Index. Quick View: Move mouse or cursor over stock symbol (ticker) to view short-term technical chart and over stock name to view long term chart. Click on  to add stock symbol to your watchlist and to add stock symbol to your watchlist and  to view watchlist. Click on any ticker or stock name for detailed market intelligence report for that stock. to view watchlist. Click on any ticker or stock name for detailed market intelligence report for that stock. |
12Stocks.com Performance of Stocks in S&P 500 Index
| Ticker | Stock Name | Watchlist | Category | Recent Price | Smart Investing & Trading Score | Change % | YTD Change% |
| LUV | Southwest Airlines |   | Transports | 26.11 | 25 | -1.12 | -9.57% |
| TRV | Travelers | | Financials | 211.96 | 18 | -1.13 | 11.27% |
| LMT | Lockheed Martin | | Industrials | 457.91 | 58 | -1.14 | 1.03% |
| AXP | American Express | | Financials | 229.79 | 53 | -1.17 | 22.66% |
| GILD | Gilead | | Health Care | 64.56 | 10 | -1.18 | -20.31% |
| CL | Colgate-Palmolive | | Consumer Staples | 91.81 | 71 | -1.18 | 15.18% |
| HRL | Hormel Foods | | Consumer Staples | 34.99 | 32 | -1.20 | 8.98% |
| MCK | McKesson | | Services & Goods | 523.88 | 28 | -1.21 | 13.15% |
| GIS | General Mills | | Consumer Staples | 69.78 | 51 | -1.23 | 7.12% |
| MO | Altria | | Consumer Staples | 43.44 | 68 | -1.23 | 7.68% |
| MDLZ | Mondelez | | Consumer Staples | 69.63 | 32 | -1.23 | -3.87% |
| OXY | Occidental | | Energy | 63.85 | 36 | -1.25 | 6.93% |
| PANW | Palo Alto | | Technology | 291.63 | 47 | -1.25 | -1.10% |
| CMI | Cummins | | Industrials | 276.67 | 31 | -1.29 | 15.49% |
| CB | Chubb | | Financials | 246.96 | 15 | -1.31 | 9.27% |
| MPC | Marathon | | Energy | 180.54 | 51 | -1.32 | 21.69% |
| GOOG | | Technology | 166.15 | 78 | -1.37 | 17.90% | |
| XOM | Exxon Mobil | | Energy | 114.62 | 36 | -1.39 | 14.64% |
| GOOGL | | Technology | 164.29 | 78 | -1.40 | 17.61% | |
| AJG | Arthur J. | | Financials | 235.17 | 22 | -1.41 | 4.58% |
| KR | Kroger Co | | Services & Goods | 54.30 | 36 | -1.43 | 18.79% |
| VLO | Valero | | Energy | 155.07 | 36 | -1.44 | 19.28% |
| CI | Cigna | | Health Care | 339.49 | 26 | -1.45 | 13.37% |
| WST | West Pharmaceutical | | Health Care | 362.80 | 58 | -1.54 | 3.03% |
| MCD | McDonald s | | Services & Goods | 269.01 | 18 | -1.56 | -9.27% |
| For chart view version of above stock list: Chart View ➞ 0 - 25 , 25 - 50 , 50 - 75 , 75 - 100 , 100 - 125 , 125 - 150 , 150 - 175 , 175 - 200 , 200 - 225 , 225 - 250 , 250 - 275 , 275 - 300 , 300 - 325 , 325 - 350 , 350 - 375 , 375 - 400 , 400 - 425 , 425 - 450 , 450 - 475 , 475 - 500 | ||
 | Click To Change The Sort Order: By Market Cap or Company Size Performance: Year-to-date, Week and Day |  |
|
Get the most comprehensive stock market coverage daily at 12Stocks.com ➞ Best Stocks Today ➞ Best Stocks Weekly ➞ Best Stocks Year-to-Date ➞ Best Stocks Trends ➞  Best Stocks Today 12Stocks.com Best Nasdaq Stocks ➞ Best S&P 500 Stocks ➞ Best Tech Stocks ➞ Best Biotech Stocks ➞ |
| Detailed Overview of S&P 500 Stocks |
| S&P 500 Technical Overview, Leaders & Laggards, Top S&P 500 ETF Funds & Detailed S&P 500 Stocks List, Charts, Trends & More |
| S&P 500: Technical Analysis, Trends & YTD Performance | |
| S&P 500 index as represented by
SPY, an exchange-traded fund [ETF], holds basket of five hundred (mostly largecap) stocks from across all major sectors of the US stock market. The S&P 500 index (contains stocks like Apple and Exxon) is up by 7.05% and is currently outperforming the overall market by 0.56% year-to-date. Below is a quick view of technical charts and trends: | |
 SPY Weekly Chart |
|
| Long Term Trend: Good | |
| Medium Term Trend: Not Good | |
 SPY Daily Chart |
|
| Short Term Trend: Very Good | |
| Overall Trend Score: 60 | |
| YTD Performance: 7.05% | |
| **Trend Scores & Views Are Only For Educational Purposes And Not For Investing | |
| 12Stocks.com: Investing in S&P 500 Index using Exchange Traded Funds | |
|
The following table shows list of key exchange traded funds (ETF) that
help investors track S&P 500 index. The following list also includes leveraged ETF funds that track twice or thrice the daily returns of S&P 500 indices. Short or inverse ETF funds move in the opposite direction to the index they track and are useful during market pullbacks or during bear markets. Quick View: Move mouse or cursor over ETF symbol (ticker) to view short-term technical chart and over ETF name to view long term chart. Click on ticker or stock name for detailed view. Click on to add stock symbol to your watchlist and to view watchlist. |
12Stocks.com List of ETFs that track S&P 500 Index
| Ticker | ETF Name | Watchlist | Recent Price | Smart Investing & Trading Score | Change % | Week % | Year-to-date % |
| SPY | SPDR S&P 500 ETF | | 508.84 | 60 | 0.75 | 0.11 | 7.05% |
| IVV | iShares Core S&P 500 ETF | | 511.36 | 60 | 0.77 | 0.12 | 7.06% |
| VOO | Vanguard 500 ETF | | 467.73 | 60 | 0.76 | 0.11 | 7.08% |
| OEF | iShares S&P 100 | | 242.65 | 60 | 1.01 | 0.45 | 8.62% |
| SSO | ProShares Ultra S&P500 | | 72.86 | 39 | 1.67 | 0.21 | 11.97% |
| UPRO | ProShares UltraPro S&P500 | | 63.93 | 39 | 2.50 | 0.17 | 16.79% |
| SH | ProShares Short S&P500 | | 12.29 | 48 | -0.73 | 0.08 | -5.39% |
| SDS | ProShares UltraShort S&P500 | | 26.52 | 48 | -1.41 | -0.04 | -11.36% |
| SPXU | ProShares UltraPro Short S&P500 | | 35.38 | 30 | -2.43 | -0.34 | -17.72% |
| SPXS | Direxion Daily S&P 500 Bear 3X ETF | | 9.57 | 30 | -2.45 | -0.42 | -17.14% |
| 12Stocks.com: Charts, Trends, Fundamental Data and Performances of S&P 500 Stocks | |
|
We now take in-depth look at all S&P 500 stocks including charts, multi-period performances and overall trends (as measured by Smart Investing & Trading Score). One can sort S&P 500 stocks (click link to choose) by Daily, Weekly and by Year-to-Date performances. Also, one can sort by size of the company or by market capitalization. |
| Select Your Default Chart Type: | |||||
| |||||
| Click on stock symbol or name for detailed view. Click on to add stock symbol to your watchlist and to view watchlist. Quick View: Move mouse or cursor over "Daily" to quickly view daily technical stock chart and over "Weekly" to view weekly technical stock chart. | |||||

 | LUV Southwest Airlines Co. |
| Sector: Transports | |
| SubSector: Regional Airlines | |
| MarketCap: 19463.3 Millions | |
| Recent Price: 26.11 Smart Investing & Trading Score: 25 | |
| Day Percent Change: -1.12% Day Change: -0.30 | |
| Week Change: -3.39% Year-to-date Change: -9.6% | |
| LUV Links: Profile News Message Board | |
| Charts:- Daily , Weekly | |
| Add LUV to Watchlist: View: Get LUV Trend Analysis ➞ | |
 | TRV The Travelers Companies, Inc. |
| Sector: Financials | |
| SubSector: Property & Casualty Insurance | |
| MarketCap: 25155.9 Millions | |
| Recent Price: 211.96 Smart Investing & Trading Score: 18 | |
| Day Percent Change: -1.13% Day Change: -2.41 | |
| Week Change: -0.7% Year-to-date Change: 11.3% | |
| TRV Links: Profile News Message Board | |
| Charts:- Daily , Weekly | |
| Add TRV to Watchlist: View: Get TRV Trend Analysis ➞ | |
 | LMT Lockheed Martin Corporation |
| Sector: Industrials | |
| SubSector: Aerospace/Defense Products & Services | |
| MarketCap: 94116.4 Millions | |
| Recent Price: 457.91 Smart Investing & Trading Score: 58 | |
| Day Percent Change: -1.14% Day Change: -5.29 | |
| Week Change: -0.73% Year-to-date Change: 1.0% | |
| LMT Links: Profile News Message Board | |
| Charts:- Daily , Weekly | |
| Add LMT to Watchlist: View: Get LMT Trend Analysis ➞ | |
 | AXP American Express Company |
| Sector: Financials | |
| SubSector: Credit Services | |
| MarketCap: 68388 Millions | |
| Recent Price: 229.79 Smart Investing & Trading Score: 53 | |
| Day Percent Change: -1.17% Day Change: -2.71 | |
| Week Change: -2.48% Year-to-date Change: 22.7% | |
| AXP Links: Profile News Message Board | |
| Charts:- Daily , Weekly | |
| Add AXP to Watchlist: View: Get AXP Trend Analysis ➞ | |
 | GILD Gilead Sciences, Inc. |
| Sector: Health Care | |
| SubSector: Biotechnology | |
| MarketCap: 99485.6 Millions | |
| Recent Price: 64.56 Smart Investing & Trading Score: 10 | |
| Day Percent Change: -1.18% Day Change: -0.77 | |
| Week Change: -1.31% Year-to-date Change: -20.3% | |
| GILD Links: Profile News Message Board | |
| Charts:- Daily , Weekly | |
| Add GILD to Watchlist: View: Get GILD Trend Analysis ➞ | |
 | CL Colgate-Palmolive Company |
| Sector: Consumer Staples | |
| SubSector: Personal Products | |
| MarketCap: 57242.7 Millions | |
| Recent Price: 91.81 Smart Investing & Trading Score: 71 | |
| Day Percent Change: -1.18% Day Change: -1.10 | |
| Week Change: 0.88% Year-to-date Change: 15.2% | |
| CL Links: Profile News Message Board | |
| Charts:- Daily , Weekly | |
| Add CL to Watchlist: View: Get CL Trend Analysis ➞ | |
 | HRL Hormel Foods Corporation |
| Sector: Consumer Staples | |
| SubSector: Meat Products | |
| MarketCap: 25590.2 Millions | |
| Recent Price: 34.99 Smart Investing & Trading Score: 32 | |
| Day Percent Change: -1.20% Day Change: -0.43 | |
| Week Change: -0.92% Year-to-date Change: 9.0% | |
| HRL Links: Profile News Message Board | |
| Charts:- Daily , Weekly | |
| Add HRL to Watchlist: View: Get HRL Trend Analysis ➞ | |
 | MCK McKesson Corporation |
| Sector: Services & Goods | |
| SubSector: Drugs Wholesale | |
| MarketCap: 24096.7 Millions | |
| Recent Price: 523.88 Smart Investing & Trading Score: 28 | |
| Day Percent Change: -1.21% Day Change: -6.39 | |
| Week Change: -3.58% Year-to-date Change: 13.2% | |
| MCK Links: Profile News Message Board | |
| Charts:- Daily , Weekly | |
| Add MCK to Watchlist: View: Get MCK Trend Analysis ➞ | |
 | GIS General Mills, Inc. |
| Sector: Consumer Staples | |
| SubSector: Processed & Packaged Goods | |
| MarketCap: 34131.7 Millions | |
| Recent Price: 69.78 Smart Investing & Trading Score: 51 | |
| Day Percent Change: -1.23% Day Change: -0.87 | |
| Week Change: -1.48% Year-to-date Change: 7.1% | |
| GIS Links: Profile News Message Board | |
| Charts:- Daily , Weekly | |
| Add GIS to Watchlist: View: Get GIS Trend Analysis ➞ | |
 | MO Altria Group, Inc. |
| Sector: Consumer Staples | |
| SubSector: Cigarettes | |
| MarketCap: 70806.3 Millions | |
| Recent Price: 43.44 Smart Investing & Trading Score: 68 | |
| Day Percent Change: -1.23% Day Change: -0.54 | |
| Week Change: 0.14% Year-to-date Change: 7.7% | |
| MO Links: Profile News Message Board | |
| Charts:- Daily , Weekly | |
| Add MO to Watchlist: View: Get MO Trend Analysis ➞ | |
 | MDLZ Mondelez International, Inc. |
| Sector: Consumer Staples | |
| SubSector: Confectioners | |
| MarketCap: 68385.8 Millions | |
| Recent Price: 69.63 Smart Investing & Trading Score: 32 | |
| Day Percent Change: -1.23% Day Change: -0.87 | |
| Week Change: -1.39% Year-to-date Change: -3.9% | |
| MDLZ Links: Profile News Message Board | |
| Charts:- Daily , Weekly | |
| Add MDLZ to Watchlist: View: Get MDLZ Trend Analysis ➞ | |
 | OXY Occidental Petroleum Corporation |
| Sector: Energy | |
| SubSector: Independent Oil & Gas | |
| MarketCap: 9152.73 Millions | |
| Recent Price: 63.85 Smart Investing & Trading Score: 36 | |
| Day Percent Change: -1.25% Day Change: -0.81 | |
| Week Change: -5.8% Year-to-date Change: 6.9% | |
| OXY Links: Profile News Message Board | |
| Charts:- Daily , Weekly | |
| Add OXY to Watchlist: View: Get OXY Trend Analysis ➞ | |
 | PANW Palo Alto Networks, Inc. |
| Sector: Technology | |
| SubSector: Networking & Communication Devices | |
| MarketCap: 16039.4 Millions | |
| Recent Price: 291.63 Smart Investing & Trading Score: 47 | |
| Day Percent Change: -1.25% Day Change: -3.69 | |
| Week Change: 0.07% Year-to-date Change: -1.1% | |
| PANW Links: Profile News Message Board | |
| Charts:- Daily , Weekly | |
| Add PANW to Watchlist: View: Get PANW Trend Analysis ➞ | |
 | CMI Cummins Inc. |
| Sector: Industrials | |
| SubSector: Diversified Machinery | |
| MarketCap: 19127.1 Millions | |
| Recent Price: 276.67 Smart Investing & Trading Score: 31 | |
| Day Percent Change: -1.29% Day Change: -3.62 | |
| Week Change: -4.97% Year-to-date Change: 15.5% | |
| CMI Links: Profile News Message Board | |
| Charts:- Daily , Weekly | |
| Add CMI to Watchlist: View: Get CMI Trend Analysis ➞ | |
 | CB Chubb Limited |
| Sector: Financials | |
| SubSector: Property & Casualty Insurance | |
| MarketCap: 51615.9 Millions | |
| Recent Price: 246.96 Smart Investing & Trading Score: 15 | |
| Day Percent Change: -1.31% Day Change: -3.29 | |
| Week Change: 0.62% Year-to-date Change: 9.3% | |
| CB Links: Profile News Message Board | |
| Charts:- Daily , Weekly | |
| Add CB to Watchlist: View: Get CB Trend Analysis ➞ | |
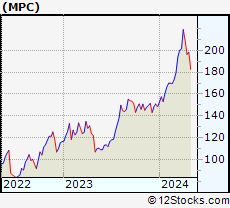 | MPC Marathon Petroleum Corporation |
| Sector: Energy | |
| SubSector: Oil & Gas Refining & Marketing | |
| MarketCap: 16862.4 Millions | |
| Recent Price: 180.54 Smart Investing & Trading Score: 51 | |
| Day Percent Change: -1.32% Day Change: -2.41 | |
| Week Change: -9% Year-to-date Change: 21.7% | |
| MPC Links: Profile News Message Board | |
| Charts:- Daily , Weekly | |
| Add MPC to Watchlist: View: Get MPC Trend Analysis ➞ | |
 | GOOG Alphabet Inc. |
| Sector: Technology | |
| SubSector: Internet Information Providers | |
| MarketCap: 730159 Millions | |
| Recent Price: 166.15 Smart Investing & Trading Score: 78 | |
| Day Percent Change: -1.37% Day Change: -2.31 | |
| Week Change: -4.34% Year-to-date Change: 17.9% | |
| GOOG Links: Profile News Message Board | |
| Charts:- Daily , Weekly | |
| Add GOOG to Watchlist: View: Get GOOG Trend Analysis ➞ | |
 | XOM Exxon Mobil Corporation |
| Sector: Energy | |
| SubSector: Major Integrated Oil & Gas | |
| MarketCap: 156450 Millions | |
| Recent Price: 114.62 Smart Investing & Trading Score: 36 | |
| Day Percent Change: -1.39% Day Change: -1.62 | |
| Week Change: -2.83% Year-to-date Change: 14.6% | |
| XOM Links: Profile News Message Board | |
| Charts:- Daily , Weekly | |
| Add XOM to Watchlist: View: Get XOM Trend Analysis ➞ | |
 | GOOGL Alphabet Inc. |
| Sector: Technology | |
| SubSector: Internet Information Providers | |
| MarketCap: 801264 Millions | |
| Recent Price: 164.29 Smart Investing & Trading Score: 78 | |
| Day Percent Change: -1.40% Day Change: -2.33 | |
| Week Change: -4.45% Year-to-date Change: 17.6% | |
| GOOGL Links: Profile News Message Board | |
| Charts:- Daily , Weekly | |
| Add GOOGL to Watchlist: View: Get GOOGL Trend Analysis ➞ | |
 | AJG Arthur J. Gallagher & Co. |
| Sector: Financials | |
| SubSector: Insurance Brokers | |
| MarketCap: 14852.2 Millions | |
| Recent Price: 235.17 Smart Investing & Trading Score: 22 | |
| Day Percent Change: -1.41% Day Change: -3.37 | |
| Week Change: 0.45% Year-to-date Change: 4.6% | |
| AJG Links: Profile News Message Board | |
| Charts:- Daily , Weekly | |
| Add AJG to Watchlist: View: Get AJG Trend Analysis ➞ | |
 | KR The Kroger Co. |
| Sector: Services & Goods | |
| SubSector: Grocery Stores | |
| MarketCap: 26718.5 Millions | |
| Recent Price: 54.30 Smart Investing & Trading Score: 36 | |
| Day Percent Change: -1.43% Day Change: -0.79 | |
| Week Change: -2.14% Year-to-date Change: 18.8% | |
| KR Links: Profile News Message Board | |
| Charts:- Daily , Weekly | |
| Add KR to Watchlist: View: Get KR Trend Analysis ➞ | |
 | VLO Valero Energy Corporation |
| Sector: Energy | |
| SubSector: Oil & Gas Refining & Marketing | |
| MarketCap: 19590.5 Millions | |
| Recent Price: 155.07 Smart Investing & Trading Score: 36 | |
| Day Percent Change: -1.44% Day Change: -2.27 | |
| Week Change: -6.47% Year-to-date Change: 19.3% | |
| VLO Links: Profile News Message Board | |
| Charts:- Daily , Weekly | |
| Add VLO to Watchlist: View: Get VLO Trend Analysis ➞ | |
 | CI Cigna Corporation |
| Sector: Health Care | |
| SubSector: Health Care Plans | |
| MarketCap: 60251.8 Millions | |
| Recent Price: 339.49 Smart Investing & Trading Score: 26 | |
| Day Percent Change: -1.45% Day Change: -5.01 | |
| Week Change: -4.23% Year-to-date Change: 13.4% | |
| CI Links: Profile News Message Board | |
| Charts:- Daily , Weekly | |
| Add CI to Watchlist: View: Get CI Trend Analysis ➞ | |
 | WST West Pharmaceutical Services, Inc. |
| Sector: Health Care | |
| SubSector: Medical Instruments & Supplies | |
| MarketCap: 9989 Millions | |
| Recent Price: 362.80 Smart Investing & Trading Score: 58 | |
| Day Percent Change: -1.54% Day Change: -5.66 | |
| Week Change: 0.66% Year-to-date Change: 3.0% | |
| WST Links: Profile News Message Board | |
| Charts:- Daily , Weekly | |
| Add WST to Watchlist: View: Get WST Trend Analysis ➞ | |
 | MCD McDonald s Corporation |
| Sector: Services & Goods | |
| SubSector: Restaurants | |
| MarketCap: 122481 Millions | |
| Recent Price: 269.01 Smart Investing & Trading Score: 18 | |
| Day Percent Change: -1.56% Day Change: -4.27 | |
| Week Change: -1.49% Year-to-date Change: -9.3% | |
| MCD Links: Profile News Message Board | |
| Charts:- Daily , Weekly | |
| Add MCD to Watchlist: View: Get MCD Trend Analysis ➞ | |
| For tabular summary view of above stock list: Summary View ➞ 0 - 25 , 25 - 50 , 50 - 75 , 75 - 100 , 100 - 125 , 125 - 150 , 150 - 175 , 175 - 200 , 200 - 225 , 225 - 250 , 250 - 275 , 275 - 300 , 300 - 325 , 325 - 350 , 350 - 375 , 375 - 400 , 400 - 425 , 425 - 450 , 450 - 475 , 475 - 500 | ||
| Click To Change The Sort Order: By Market Cap or Company Size Performance: Year-to-date, Week and Day | |
| Select Chart Type: | ||
|
Best Stocks Today 12Stocks.com |
© 2024 12Stocks.com Terms & Conditions Privacy Contact Us
All Information Provided Only For Education And Not To Be Used For Investing or Trading. See Terms & Conditions


One More Thing ... Get Best Stocks Delivered Daily!
Never Ever Miss A Move With Our Top Ten Stocks Lists
Find Best Stocks In Any Market - Bull or Bear Market
Take A Peek At Our Top Ten Stocks Lists: Daily, Weekly, Year-to-Date & Top Trends
Find Best Stocks In Any Market - Bull or Bear Market
Take A Peek At Our Top Ten Stocks Lists: Daily, Weekly, Year-to-Date & Top Trends
S&P 500 Stocks With Best Up Trends [0-bearish to 100-bullish]: Amgen [100], Apple [100], First Solar[100], Camden Property[100], Comerica [100], BorgWarner [100], Zions Ban[100], Teradyne [100], Extra Space[100], Fifth Third[100], Mid-America Apartment[100]
Best S&P 500 Stocks Year-to-Date:
NVIDIA [77.16%], Constellation [66.92%], NRG [48.12%], Chipotle Mexican[37.99%], Western Digital[34.49%], Micron [33.23%], Eaton [33.05%], Leidos Holdings[31.25%], Progressive [29.83%], Garmin [28.43%], Diamondback [28.35%] Best S&P 500 Stocks This Week:
Bio-Techne [19.34%], C.H. Robinson[16.15%], Amgen [16.13%], Garmin [15.09%], Moderna [15.09%], Aptiv [12.36%], Albemarle [10.87%], Amcor [10.59%], BorgWarner [9.69%], WestRock [9.1%], Leidos Holdings[8.98%] Best S&P 500 Stocks Daily:
Amgen [12.62%], Live Nation[8.46%], Enphase [6.67%], Apple [6.55%], Constellation [5.23%], Digital Realty[5.18%], Booking Holdings[5.15%], Motorola Solutions[5.04%], First Solar[4.37%], Builders FirstSource[4.21%], Arista Networks[4.10%]