
 Login Sign Up


| |||||
 |  | ||||

| 12Stocks.com Market Intelligence |
Best S&P 500 Stocks
|
On this page, you will find the most comprehensive analysis of S&P 500 stocks and ETFs - from latest trends to performances to charts ➞. First, here are the year-to-date (YTD) performances of the most requested S&P 500 stocks at 12Stocks.com (click stock for review):
| NVIDIA 77% | ||
| Google 23% | ||
| Merck 20% | ||
| Amazon.com 18% | ||
| Caterpillar 16% | ||
| Walmart 14% | ||
| JPMorgan Chase 14% | ||
| Chevron 11% | ||
| Goldman Sachs 11% | ||
| Microsoft 8% | ||
| Johnson & Johnson -7% | ||
| McDonald s -8% | ||
| Starbucks -8% | ||
| Apple -12% | ||
| Gilead -19% | ||
| Boeing -36% | ||
| Intel -37% | ||
| Quick: S&P 500 Stocks Lists: Performances & Trends, S&P 500 Stock Charts
Sort S&P 500 stocks: Daily, Weekly, Year-to-Date, Market Cap & Trends. Filter S&P 500 stocks list by sector: Show all, Tech, Finance, Energy, Staples, Retail, Industrial, Materials, Utilities and HealthCare |
| 12Stocks.com S&P 500 Stocks Performances & Trends Daily Report | |||||||||
|
| 
The overall Smart Investing & Trading Score is 63 (0-bearish to 100-bullish) which puts S&P 500 index in short term neutral to bullish trend. The Smart Investing & Trading Score from previous trading session is 44 and hence an improvement of trend. | ||||||||
Here are the Smart Investing & Trading Scores of the most requested S&P 500 stocks at 12Stocks.com (click stock name for detailed review):
|


| 12Stocks.com: Top Performing S&P 500 Index Stocks | ||||||||||||||||||||||||||||||||||||||||||||||||
 The top performing S&P 500 Index stocks year to date are
Now, more recently, over last week, the top performing S&P 500 Index stocks on the move are


|
||||||||||||||||||||||||||||||||||||||||||||||||
| 12Stocks.com: Investing in S&P 500 Index with Stocks | |
|
The following table helps investors and traders sort through current performance and trends (as measured by Smart Investing & Trading Score) of various
stocks in the S&P 500 Index. Quick View: Move mouse or cursor over stock symbol (ticker) to view short-term technical chart and over stock name to view long term chart. Click on  to add stock symbol to your watchlist and to add stock symbol to your watchlist and  to view watchlist. Click on any ticker or stock name for detailed market intelligence report for that stock. to view watchlist. Click on any ticker or stock name for detailed market intelligence report for that stock. |
12Stocks.com Performance of Stocks in S&P 500 Index
| Ticker | Stock Name | Watchlist | Category | Recent Price | Smart Investing & Trading Score | Change % | YTD Change% |
| MPWR | Monolithic Power |   | Technology | 677.23 | 75 | 2.56 | 7.36% |
| CSGP | CoStar | | Financials | 92.65 | 73 | 2.56 | 6.02% |
| PWR | Quanta Services | | Industrials | 261.66 | 83 | 2.54 | 21.25% |
| META | Meta Platforms | | Technology | 444.17 | 33 | 2.54 | 25.47% |
| ON | ON Semiconductor | | Technology | 68.06 | 49 | 2.53 | -18.52% |
| LYB | LyondellBasell Industries | | Materials | 102.13 | 68 | 2.46 | 7.41% |
| CMG | Chipotle Mexican | | Services & Goods | 3186.97 | 100 | 2.41 | 39.35% |
| AMD | Advanced Micro | | Technology | 157.40 | 32 | 2.37 | 6.78% |
| RCL | Royal Caribbean | | Services & Goods | 140.59 | 95 | 2.27 | 8.57% |
| ETN | Eaton | | Industrials | 324.30 | 75 | 2.27 | 34.66% |
| TECH | Bio-Techne | | Health Care | 64.06 | 35 | 2.23 | -16.98% |
| FCX | Freeport-McMoRan | | Materials | 50.50 | 88 | 2.23 | 18.63% |
| PHM | Pulte | | Industrials | 113.80 | 80 | 2.19 | 10.25% |
| FSLR | First Solar | | Technology | 178.73 | 81 | 2.12 | 3.74% |
| IDXX | IDEXX | | Health Care | 499.30 | 42 | 2.06 | -10.04% |
| ANSS | ANSYS | | Technology | 333.75 | 68 | 2.05 | -8.03% |
| ADI | Analog Devices | | Technology | 201.97 | 100 | 2.04 | 1.72% |
| ORCL | Oracle | | Technology | 117.21 | 58 | 2.02 | 11.17% |
| NXPI | NXP Semiconductors | | Technology | 242.70 | 88 | 1.94 | 5.67% |
| CL | Colgate-Palmolive | | Consumer Staples | 91.01 | 100 | 1.93 | 14.18% |
| CDNS | Cadence Design | | Technology | 282.41 | 25 | 1.92 | 3.69% |
| TXT | Textron | | Industrials | 86.51 | 33 | 1.90 | 7.57% |
| CMCSA | Comcast | | Services & Goods | 38.57 | 0 | 1.85 | -12.04% |
| MSFT | Microsoft | | Technology | 406.32 | 51 | 1.82 | 8.05% |
| GS | Goldman Sachs | | Financials | 427.57 | 100 | 1.79 | 10.84% |
| For chart view version of above stock list: Chart View ➞ 0 - 25 , 25 - 50 , 50 - 75 , 75 - 100 , 100 - 125 , 125 - 150 , 150 - 175 , 175 - 200 , 200 - 225 , 225 - 250 , 250 - 275 , 275 - 300 , 300 - 325 , 325 - 350 , 350 - 375 , 375 - 400 , 400 - 425 , 425 - 450 , 450 - 475 , 475 - 500 | ||
 | Click To Change The Sort Order: By Market Cap or Company Size Performance: Year-to-date, Week and Day |  |
|
Get the most comprehensive stock market coverage daily at 12Stocks.com ➞ Best Stocks Today ➞ Best Stocks Weekly ➞ Best Stocks Year-to-Date ➞ Best Stocks Trends ➞  Best Stocks Today 12Stocks.com Best Nasdaq Stocks ➞ Best S&P 500 Stocks ➞ Best Tech Stocks ➞ Best Biotech Stocks ➞ |
| Detailed Overview of S&P 500 Stocks |
| S&P 500 Technical Overview, Leaders & Laggards, Top S&P 500 ETF Funds & Detailed S&P 500 Stocks List, Charts, Trends & More |
| S&P 500: Technical Analysis, Trends & YTD Performance | |
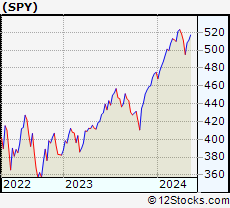
| S&P 500 index as represented by
SPY, an exchange-traded fund [ETF], holds basket of five hundred (mostly largecap) stocks from across all major sectors of the US stock market. The S&P 500 index (contains stocks like Apple and Exxon) is up by 6.93% and is currently outperforming the overall market by 0.79% year-to-date. Below is a quick view of technical charts and trends: | |
 SPY Weekly Chart |
|
| Long Term Trend: Good | |
| Medium Term Trend: Not Good | |
 SPY Daily Chart |
|
| Short Term Trend: Very Good | |
| Overall Trend Score: 63 | |
| YTD Performance: 6.93% | |
| **Trend Scores & Views Are Only For Educational Purposes And Not For Investing | |
| 12Stocks.com: Investing in S&P 500 Index using Exchange Traded Funds | |
|
The following table shows list of key exchange traded funds (ETF) that
help investors track S&P 500 index. The following list also includes leveraged ETF funds that track twice or thrice the daily returns of S&P 500 indices. Short or inverse ETF funds move in the opposite direction to the index they track and are useful during market pullbacks or during bear markets. Quick View: Move mouse or cursor over ETF symbol (ticker) to view short-term technical chart and over ETF name to view long term chart. Click on ticker or stock name for detailed view. Click on to add stock symbol to your watchlist and to view watchlist. |
12Stocks.com List of ETFs that track S&P 500 Index
| Ticker | ETF Name | Watchlist | Recent Price | Smart Investing & Trading Score | Change % | Week % | Year-to-date % |
| SPY | SPDR S&P 500 ETF | | 508.26 | 63 | 0.95 | 2.65 | 6.93% |
| IVV | iShares Core S&P 500 ETF | | 510.77 | 63 | 0.98 | 2.66 | 6.94% |
| VOO | Vanguard 500 ETF | | 467.21 | 63 | 1.00 | 2.66 | 6.96% |
| OEF | iShares S&P 100 | | 241.56 | 63 | 1.35 | 2.93 | 8.13% |
| SSO | ProShares Ultra S&P500 | | 72.71 | 63 | 1.95 | 5.21 | 11.74% |
| UPRO | ProShares UltraPro S&P500 | | 63.82 | 63 | 2.89 | 7.88 | 16.59% |
| SPXL | Direxion Daily S&P500 Bull 3X ETF | | 121.14 | 63 | 2.80 | 7.63 | 16.49% |
| SH | ProShares Short S&P500 | | 12.28 | 42 | -0.89 | -2.46 | -5.47% |
| SDS | ProShares UltraShort S&P500 | | 26.53 | 32 | -1.89 | -4.91 | -11.33% |
| SPXU | ProShares UltraPro Short S&P500 | | 35.50 | 42 | -2.79 | -7.38 | -17.44% |
| SPXS | Direxion Daily S&P 500 Bear 3X ETF | | 9.61 | 25 | -2.73 | -7.24 | -16.8% |
| 12Stocks.com: Charts, Trends, Fundamental Data and Performances of S&P 500 Stocks | |
|
We now take in-depth look at all S&P 500 stocks including charts, multi-period performances and overall trends (as measured by Smart Investing & Trading Score). One can sort S&P 500 stocks (click link to choose) by Daily, Weekly and by Year-to-Date performances. Also, one can sort by size of the company or by market capitalization. |
| Select Your Default Chart Type: | |||||
| |||||
| Click on stock symbol or name for detailed view. Click on to add stock symbol to your watchlist and to view watchlist. Quick View: Move mouse or cursor over "Daily" to quickly view daily technical stock chart and over "Weekly" to view weekly technical stock chart. | |||||

 | MPWR Monolithic Power Systems, Inc. |
| Sector: Technology | |
| SubSector: Semiconductor - Specialized | |
| MarketCap: 6436.4 Millions | |
| Recent Price: 677.23 Smart Investing & Trading Score: 75 | |
| Day Percent Change: 2.56% Day Change: 16.89 | |
| Week Change: 14.49% Year-to-date Change: 7.4% | |
| MPWR Links: Profile News Message Board | |
| Charts:- Daily , Weekly | |
| Add MPWR to Watchlist: View: Get MPWR Trend Analysis ➞ | |
 | CSGP CoStar Group, Inc. |
| Sector: Financials | |
| SubSector: Property Management | |
| MarketCap: 21454.4 Millions | |
| Recent Price: 92.65 Smart Investing & Trading Score: 73 | |
| Day Percent Change: 2.56% Day Change: 2.31 | |
| Week Change: 9.96% Year-to-date Change: 6.0% | |
| CSGP Links: Profile News Message Board | |
| Charts:- Daily , Weekly | |
| Add CSGP to Watchlist: View: Get CSGP Trend Analysis ➞ | |
 | PWR Quanta Services, Inc. |
| Sector: Industrials | |
| SubSector: General Contractors | |
| MarketCap: 3936.63 Millions | |
| Recent Price: 261.66 Smart Investing & Trading Score: 83 | |
| Day Percent Change: 2.54% Day Change: 6.47 | |
| Week Change: 7.56% Year-to-date Change: 21.3% | |
| PWR Links: Profile News Message Board | |
| Charts:- Daily , Weekly | |
| Add PWR to Watchlist: View: Get PWR Trend Analysis ➞ | |
 | META Meta Platforms, Inc. |
| Sector: Technology | |
| SubSector: Internet Content & Information | |
| MarketCap: 732990 Millions | |
| Recent Price: 444.17 Smart Investing & Trading Score: 33 | |
| Day Percent Change: 2.54% Day Change: 11.00 | |
| Week Change: -7.67% Year-to-date Change: 25.5% | |
| META Links: Profile News Message Board | |
| Charts:- Daily , Weekly | |
| Add META to Watchlist: View: Get META Trend Analysis ➞ | |
 | ON ON Semiconductor Corporation |
| Sector: Technology | |
| SubSector: Semiconductor - Broad Line | |
| MarketCap: 5183.82 Millions | |
| Recent Price: 68.06 Smart Investing & Trading Score: 49 | |
| Day Percent Change: 2.53% Day Change: 1.68 | |
| Week Change: 12.11% Year-to-date Change: -18.5% | |
| ON Links: Profile News Message Board | |
| Charts:- Daily , Weekly | |
| Add ON to Watchlist: View: Get ON Trend Analysis ➞ | |
 | LYB LyondellBasell Industries N.V. |
| Sector: Materials | |
| SubSector: Specialty Chemicals | |
| MarketCap: 16420.7 Millions | |
| Recent Price: 102.13 Smart Investing & Trading Score: 68 | |
| Day Percent Change: 2.46% Day Change: 2.45 | |
| Week Change: 1.38% Year-to-date Change: 7.4% | |
| LYB Links: Profile News Message Board | |
| Charts:- Daily , Weekly | |
| Add LYB to Watchlist: View: Get LYB Trend Analysis ➞ | |
 | CMG Chipotle Mexican Grill, Inc. |
| Sector: Services & Goods | |
| SubSector: Restaurants | |
| MarketCap: 16849.9 Millions | |
| Recent Price: 3186.97 Smart Investing & Trading Score: 100 | |
| Day Percent Change: 2.41% Day Change: 75.00 | |
| Week Change: 11.08% Year-to-date Change: 39.4% | |
| CMG Links: Profile News Message Board | |
| Charts:- Daily , Weekly | |
| Add CMG to Watchlist: View: Get CMG Trend Analysis ➞ | |
 | AMD Advanced Micro Devices, Inc. |
| Sector: Technology | |
| SubSector: Semiconductor - Broad Line | |
| MarketCap: 54275.1 Millions | |
| Recent Price: 157.40 Smart Investing & Trading Score: 32 | |
| Day Percent Change: 2.37% Day Change: 3.64 | |
| Week Change: 7.34% Year-to-date Change: 6.8% | |
| AMD Links: Profile News Message Board | |
| Charts:- Daily , Weekly | |
| Add AMD to Watchlist: View: Get AMD Trend Analysis ➞ | |
 | RCL Royal Caribbean Cruises Ltd. |
| Sector: Services & Goods | |
| SubSector: Resorts & Casinos | |
| MarketCap: 7294.14 Millions | |
| Recent Price: 140.59 Smart Investing & Trading Score: 95 | |
| Day Percent Change: 2.27% Day Change: 3.12 | |
| Week Change: 8.81% Year-to-date Change: 8.6% | |
| RCL Links: Profile News Message Board | |
| Charts:- Daily , Weekly | |
| Add RCL to Watchlist: View: Get RCL Trend Analysis ➞ | |
 | ETN Eaton Corporation plc |
| Sector: Industrials | |
| SubSector: Diversified Machinery | |
| MarketCap: 29829.4 Millions | |
| Recent Price: 324.30 Smart Investing & Trading Score: 75 | |
| Day Percent Change: 2.27% Day Change: 7.20 | |
| Week Change: 7.02% Year-to-date Change: 34.7% | |
| ETN Links: Profile News Message Board | |
| Charts:- Daily , Weekly | |
| Add ETN to Watchlist: View: Get ETN Trend Analysis ➞ | |
 | TECH Bio-Techne Corporation |
| Sector: Health Care | |
| SubSector: Biotechnology | |
| MarketCap: 6958.05 Millions | |
| Recent Price: 64.06 Smart Investing & Trading Score: 35 | |
| Day Percent Change: 2.23% Day Change: 1.40 | |
| Week Change: 3.12% Year-to-date Change: -17.0% | |
| TECH Links: Profile News Message Board | |
| Charts:- Daily , Weekly | |
| Add TECH to Watchlist: View: Get TECH Trend Analysis ➞ | |
 | FCX Freeport-McMoRan Inc. |
| Sector: Materials | |
| SubSector: Copper | |
| MarketCap: 9070.57 Millions | |
| Recent Price: 50.50 Smart Investing & Trading Score: 88 | |
| Day Percent Change: 2.23% Day Change: 1.10 | |
| Week Change: 1.79% Year-to-date Change: 18.6% | |
| FCX Links: Profile News Message Board | |
| Charts:- Daily , Weekly | |
| Add FCX to Watchlist: View: Get FCX Trend Analysis ➞ | |
 | PHM PulteGroup, Inc. |
| Sector: Industrials | |
| SubSector: Residential Construction | |
| MarketCap: 6186.46 Millions | |
| Recent Price: 113.80 Smart Investing & Trading Score: 80 | |
| Day Percent Change: 2.19% Day Change: 2.44 | |
| Week Change: 7.94% Year-to-date Change: 10.3% | |
| PHM Links: Profile News Message Board | |
| Charts:- Daily , Weekly | |
| Add PHM to Watchlist: View: Get PHM Trend Analysis ➞ | |
 | FSLR First Solar, Inc. |
| Sector: Technology | |
| SubSector: Semiconductor - Specialized | |
| MarketCap: 3617.9 Millions | |
| Recent Price: 178.73 Smart Investing & Trading Score: 81 | |
| Day Percent Change: 2.12% Day Change: 3.71 | |
| Week Change: 2.11% Year-to-date Change: 3.7% | |
| FSLR Links: Profile News Message Board | |
| Charts:- Daily , Weekly | |
| Add FSLR to Watchlist: View: Get FSLR Trend Analysis ➞ | |
 | IDXX IDEXX Laboratories, Inc. |
| Sector: Health Care | |
| SubSector: Diagnostic Substances | |
| MarketCap: 15937.1 Millions | |
| Recent Price: 499.30 Smart Investing & Trading Score: 42 | |
| Day Percent Change: 2.06% Day Change: 10.06 | |
| Week Change: 4.82% Year-to-date Change: -10.0% | |
| IDXX Links: Profile News Message Board | |
| Charts:- Daily , Weekly | |
| Add IDXX to Watchlist: View: Get IDXX Trend Analysis ➞ | |
 | ANSS ANSYS, Inc. |
| Sector: Technology | |
| SubSector: Application Software | |
| MarketCap: 19497.4 Millions | |
| Recent Price: 333.75 Smart Investing & Trading Score: 68 | |
| Day Percent Change: 2.05% Day Change: 6.71 | |
| Week Change: 3.61% Year-to-date Change: -8.0% | |
| ANSS Links: Profile News Message Board | |
| Charts:- Daily , Weekly | |
| Add ANSS to Watchlist: View: Get ANSS Trend Analysis ➞ | |
 | ADI Analog Devices, Inc. |
| Sector: Technology | |
| SubSector: Semiconductor - Integrated Circuits | |
| MarketCap: 32859 Millions | |
| Recent Price: 201.97 Smart Investing & Trading Score: 100 | |
| Day Percent Change: 2.04% Day Change: 4.03 | |
| Week Change: 10.15% Year-to-date Change: 1.7% | |
| ADI Links: Profile News Message Board | |
| Charts:- Daily , Weekly | |
| Add ADI to Watchlist: View: Get ADI Trend Analysis ➞ | |
 | ORCL Oracle Corporation |
| Sector: Technology | |
| SubSector: Application Software | |
| MarketCap: 164530 Millions | |
| Recent Price: 117.21 Smart Investing & Trading Score: 58 | |
| Day Percent Change: 2.02% Day Change: 2.32 | |
| Week Change: 2.03% Year-to-date Change: 11.2% | |
| ORCL Links: Profile News Message Board | |
| Charts:- Daily , Weekly | |
| Add ORCL to Watchlist: View: Get ORCL Trend Analysis ➞ | |
 | NXPI NXP Semiconductors N.V. |
| Sector: Technology | |
| SubSector: Semiconductor - Broad Line | |
| MarketCap: 22497.9 Millions | |
| Recent Price: 242.70 Smart Investing & Trading Score: 88 | |
| Day Percent Change: 1.94% Day Change: 4.62 | |
| Week Change: 12.82% Year-to-date Change: 5.7% | |
| NXPI Links: Profile News Message Board | |
| Charts:- Daily , Weekly | |
| Add NXPI to Watchlist: View: Get NXPI Trend Analysis ➞ | |
 | CL Colgate-Palmolive Company |
| Sector: Consumer Staples | |
| SubSector: Personal Products | |
| MarketCap: 57242.7 Millions | |
| Recent Price: 91.01 Smart Investing & Trading Score: 100 | |
| Day Percent Change: 1.93% Day Change: 1.72 | |
| Week Change: 4.45% Year-to-date Change: 14.2% | |
| CL Links: Profile News Message Board | |
| Charts:- Daily , Weekly | |
| Add CL to Watchlist: View: Get CL Trend Analysis ➞ | |
 | CDNS Cadence Design Systems, Inc. |
| Sector: Technology | |
| SubSector: Application Software | |
| MarketCap: 16865.8 Millions | |
| Recent Price: 282.41 Smart Investing & Trading Score: 25 | |
| Day Percent Change: 1.92% Day Change: 5.33 | |
| Week Change: 0.77% Year-to-date Change: 3.7% | |
| CDNS Links: Profile News Message Board | |
| Charts:- Daily , Weekly | |
| Add CDNS to Watchlist: View: Get CDNS Trend Analysis ➞ | |
 | TXT Textron Inc. |
| Sector: Industrials | |
| SubSector: Aerospace/Defense - Major Diversified | |
| MarketCap: 6123.09 Millions | |
| Recent Price: 86.51 Smart Investing & Trading Score: 33 | |
| Day Percent Change: 1.90% Day Change: 1.61 | |
| Week Change: -7.28% Year-to-date Change: 7.6% | |
| TXT Links: Profile News Message Board | |
| Charts:- Daily , Weekly | |
| Add TXT to Watchlist: View: Get TXT Trend Analysis ➞ | |
 | CMCSA Comcast Corporation |
| Sector: Services & Goods | |
| SubSector: Entertainment - Diversified | |
| MarketCap: 164849 Millions | |
| Recent Price: 38.57 Smart Investing & Trading Score: 0 | |
| Day Percent Change: 1.85% Day Change: 0.70 | |
| Week Change: -4.15% Year-to-date Change: -12.0% | |
| CMCSA Links: Profile News Message Board | |
| Charts:- Daily , Weekly | |
| Add CMCSA to Watchlist: View: Get CMCSA Trend Analysis ➞ | |
 | MSFT Microsoft Corporation |
| Sector: Technology | |
| SubSector: Business Software & Services | |
| MarketCap: 1154150 Millions | |
| Recent Price: 406.32 Smart Investing & Trading Score: 51 | |
| Day Percent Change: 1.82% Day Change: 7.28 | |
| Week Change: 1.8% Year-to-date Change: 8.1% | |
| MSFT Links: Profile News Message Board | |
| Charts:- Daily , Weekly | |
| Add MSFT to Watchlist: View: Get MSFT Trend Analysis ➞ | |
 | GS The Goldman Sachs Group, Inc. |
| Sector: Financials | |
| SubSector: Investment Brokerage - National | |
| MarketCap: 54579.3 Millions | |
| Recent Price: 427.57 Smart Investing & Trading Score: 100 | |
| Day Percent Change: 1.79% Day Change: 7.52 | |
| Week Change: 5.83% Year-to-date Change: 10.8% | |
| GS Links: Profile News Message Board | |
| Charts:- Daily , Weekly | |
| Add GS to Watchlist: View: Get GS Trend Analysis ➞ | |
| For tabular summary view of above stock list: Summary View ➞ 0 - 25 , 25 - 50 , 50 - 75 , 75 - 100 , 100 - 125 , 125 - 150 , 150 - 175 , 175 - 200 , 200 - 225 , 225 - 250 , 250 - 275 , 275 - 300 , 300 - 325 , 325 - 350 , 350 - 375 , 375 - 400 , 400 - 425 , 425 - 450 , 450 - 475 , 475 - 500 | ||
| Click To Change The Sort Order: By Market Cap or Company Size Performance: Year-to-date, Week and Day | |
| Select Chart Type: | ||
|
Best Stocks Today 12Stocks.com |
© 2024 12Stocks.com Terms & Conditions Privacy Contact Us
All Information Provided Only For Education And Not To Be Used For Investing or Trading. See Terms & Conditions


One More Thing ... Get Best Stocks Delivered Daily!
Never Ever Miss A Move With Our Top Ten Stocks Lists
Find Best Stocks In Any Market - Bull or Bear Market
Take A Peek At Our Top Ten Stocks Lists: Daily, Weekly, Year-to-Date & Top Trends
Find Best Stocks In Any Market - Bull or Bear Market
Take A Peek At Our Top Ten Stocks Lists: Daily, Weekly, Year-to-Date & Top Trends
S&P 500 Stocks With Best Up Trends [0-bearish to 100-bullish]: ResMed [100], Google [100], Google [100], KLA [100], Teradyne [100], Tractor Supply[100], Carrier Global[100], Chipotle Mexican[100], Analog Devices[100], Colgate-Palmolive [100], Goldman Sachs[100]
Best S&P 500 Stocks Year-to-Date:
NVIDIA [77.16%], Constellation [60.86%], NRG [40.83%], Chipotle Mexican[39.35%], Western Digital[36.26%], Eaton [34.66%], Micron [34.57%], Targa Resources[34.52%], Diamondback [33.97%], Marathon [33.72%], Progressive [30.61%] Best S&P 500 Stocks This Week:
ResMed [21.92%], Teradyne [18.92%], Hasbro [16.65%], NVIDIA [15.14%], Microchip [14.59%], Monolithic Power[14.49%], Tesla [14.44%], Tyler Technologies[14.23%], Wabtec [14%], Globe Life[13.5%], NXP Semiconductors[12.82%] Best S&P 500 Stocks Daily:
ResMed [18.89%], Google [10.22%], Google [9.97%], NVIDIA [6.18%], KLA [4.95%], Teradyne [4.79%], T. Rowe[4.77%], Mohawk Industries[4.70%], Broadcom [3.84%], Enphase [3.80%], L3Harris Technologies[3.46%]