
 Login Sign Up


| |||||
 |  | ||||

| 12Stocks.com Market Intelligence |
Best S&P 500 Stocks
|
On this page, you will find the most comprehensive analysis of S&P 500 stocks and ETFs - from latest trends to performances to charts ➞. First, here are the year-to-date (YTD) performances of the most requested S&P 500 stocks at 12Stocks.com (click stock for review):
| NVIDIA 79% | ||
| Amazon.com 23% | ||
| Google 20% | ||
| Merck 17% | ||
| Caterpillar 14% | ||
| Walmart 14% | ||
| Goldman Sachs 14% | ||
| JPMorgan Chase 12% | ||
| Microsoft 8% | ||
| Chevron 7% | ||
| Apple -5% | ||
| Johnson & Johnson -5% | ||
| McDonald s -9% | ||
| Gilead -20% | ||
| Starbucks -24% | ||
| Boeing -31% | ||
| Intel -39% | ||
| Quick: S&P 500 Stocks Lists: Performances & Trends, S&P 500 Stock Charts
Sort S&P 500 stocks: Daily, Weekly, Year-to-Date, Market Cap & Trends. Filter S&P 500 stocks list by sector: Show all, Tech, Finance, Energy, Staples, Retail, Industrial, Materials, Utilities and HealthCare |
| 12Stocks.com S&P 500 Stocks Performances & Trends Daily Report | |||||||||
|
| 
The overall Smart Investing & Trading Score is 60 (0-bearish to 100-bullish) which puts S&P 500 index in short term neutral to bullish trend. The Smart Investing & Trading Score from previous trading session is 30 and hence an improvement of trend. | ||||||||
Here are the Smart Investing & Trading Scores of the most requested S&P 500 stocks at 12Stocks.com (click stock name for detailed review):
|


| 12Stocks.com: Top Performing S&P 500 Index Stocks | ||||||||||||||||||||||||||||||||||||||||||||||||
 The top performing S&P 500 Index stocks year to date are
Now, more recently, over last week, the top performing S&P 500 Index stocks on the move are


|
||||||||||||||||||||||||||||||||||||||||||||||||
| 12Stocks.com: Investing in S&P 500 Index with Stocks | |
|
The following table helps investors and traders sort through current performance and trends (as measured by Smart Investing & Trading Score) of various
stocks in the S&P 500 Index. Quick View: Move mouse or cursor over stock symbol (ticker) to view short-term technical chart and over stock name to view long term chart. Click on  to add stock symbol to your watchlist and to add stock symbol to your watchlist and  to view watchlist. Click on any ticker or stock name for detailed market intelligence report for that stock. to view watchlist. Click on any ticker or stock name for detailed market intelligence report for that stock. |
12Stocks.com Performance of Stocks in S&P 500 Index
| Ticker | Stock Name | Watchlist | Category | Recent Price | Smart Investing & Trading Score | Change % | YTD Change% |
| CMI | Cummins |   | Industrials | 280.74 | 49 | 0.16 | 17.18% |
| NI | NiSource | | Utilities | 28.54 | 100 | 0.14 | 7.50% |
| OMC | Omnicom | | Services & Goods | 92.75 | 61 | 0.13 | 7.21% |
| EMR | Emerson Electric | | Industrials | 106.54 | 23 | 0.12 | 9.46% |
| WRK | WestRock | | Consumer Staples | 51.16 | 100 | 0.10 | 23.22% |
| TAP | Molson Coors | | Consumer Staples | 57.85 | 32 | 0.09 | -5.49% |
| PM | Philip Morris | | Consumer Staples | 97.40 | 95 | 0.09 | 3.53% |
| AJG | Arthur J. | | Financials | 238.72 | 57 | 0.08 | 6.15% |
| CME | CME | | Financials | 207.65 | 0 | 0.08 | -1.40% |
| HAL | Halliburton | | Energy | 36.73 | 36 | 0.08 | 1.60% |
| SRE | Sempra | | Utilities | 72.92 | 90 | 0.07 | -2.42% |
| MOH | Molina Healthcare | | Health Care | 339.68 | 18 | 0.04 | -5.99% |
| ULTA | Ulta Beauty | | Services & Goods | 397.39 | 10 | 0.02 | -18.90% |
| HLT | Hilton Worldwide | | Services & Goods | 197.54 | 32 | 0.01 | 8.48% |
| VMC | Vulcan Materials | | Industrials | 264.44 | 60 | 0.01 | 16.49% |
| PXD | Pioneer Natural | | Energy | 269.62 | 68 | 0.00 | 19.90% |
| LNT | Alliant | | Utilities | 50.85 | 100 | 0.00 | -0.88% |
| VICI | VICI Properties | | Financials | 28.80 | 69 | 0.00 | -9.66% |
| VRSN | VeriSign | | Technology | 168.32 | 18 | -0.01 | -18.28% |
| ABT | Abbott | | Health Care | 105.90 | 18 | -0.02 | -3.79% |
| COP | ConocoPhillips | | Energy | 122.23 | 26 | -0.02 | 5.31% |
| C | Citi | | Financials | 61.52 | 61 | -0.03 | 19.60% |
| CL | Colgate-Palmolive | | Consumer Staples | 92.88 | 88 | -0.03 | 16.52% |
| CTSH | Cognizant | | Technology | 66.25 | 42 | -0.03 | -12.29% |
| BKR | Baker Hughes | | Services & Goods | 31.92 | 36 | -0.03 | -6.61% |
| For chart view version of above stock list: Chart View ➞ 0 - 25 , 25 - 50 , 50 - 75 , 75 - 100 , 100 - 125 , 125 - 150 , 150 - 175 , 175 - 200 , 200 - 225 , 225 - 250 , 250 - 275 , 275 - 300 , 300 - 325 , 325 - 350 , 350 - 375 , 375 - 400 , 400 - 425 , 425 - 450 , 450 - 475 , 475 - 500 | ||
 | Click To Change The Sort Order: By Market Cap or Company Size Performance: Year-to-date, Week and Day |  |
|
Get the most comprehensive stock market coverage daily at 12Stocks.com ➞ Best Stocks Today ➞ Best Stocks Weekly ➞ Best Stocks Year-to-Date ➞ Best Stocks Trends ➞  Best Stocks Today 12Stocks.com Best Nasdaq Stocks ➞ Best S&P 500 Stocks ➞ Best Tech Stocks ➞ Best Biotech Stocks ➞ |
| Detailed Overview of S&P 500 Stocks |
| S&P 500 Technical Overview, Leaders & Laggards, Top S&P 500 ETF Funds & Detailed S&P 500 Stocks List, Charts, Trends & More |
| S&P 500: Technical Analysis, Trends & YTD Performance | |
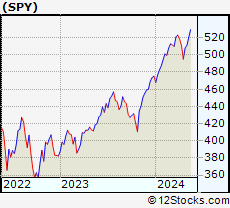
| S&P 500 index as represented by
SPY, an exchange-traded fund [ETF], holds basket of five hundred (mostly largecap) stocks from across all major sectors of the US stock market. The S&P 500 index (contains stocks like Apple and Exxon) is up by 7.57% and is currently outperforming the overall market by 0.69% year-to-date. Below is a quick view of technical charts and trends: | |
 SPY Weekly Chart |
|
| Long Term Trend: Good | |
| Medium Term Trend: Good | |
 SPY Daily Chart |
|
| Short Term Trend: Very Good | |
| Overall Trend Score: 60 | |
| YTD Performance: 7.57% | |
| **Trend Scores & Views Are Only For Educational Purposes And Not For Investing | |
| 12Stocks.com: Investing in S&P 500 Index using Exchange Traded Funds | |
|
The following table shows list of key exchange traded funds (ETF) that
help investors track S&P 500 index. The following list also includes leveraged ETF funds that track twice or thrice the daily returns of S&P 500 indices. Short or inverse ETF funds move in the opposite direction to the index they track and are useful during market pullbacks or during bear markets. Quick View: Move mouse or cursor over ETF symbol (ticker) to view short-term technical chart and over ETF name to view long term chart. Click on ticker or stock name for detailed view. Click on to add stock symbol to your watchlist and to view watchlist. |
12Stocks.com List of ETFs that track S&P 500 Index
| Ticker | ETF Name | Watchlist | Recent Price | Smart Investing & Trading Score | Change % | Week % | Year-to-date % |
| SPY | SPDR S&P 500 ETF | | 511.29 | 60 | 1.24 | 0.6 | 7.57% |
| IVV | iShares Core S&P 500 ETF | | 513.84 | 60 | 1.26 | 0.6 | 7.58% |
| VOO | Vanguard 500 ETF | | 469.98 | 60 | 1.24 | 0.59 | 7.6% |
| OEF | iShares S&P 100 | | 243.74 | 83 | 1.46 | 0.9 | 9.11% |
| SSO | ProShares Ultra S&P500 | | 73.46 | 60 | 2.51 | 1.03 | 12.89% |
| UPRO | ProShares UltraPro S&P500 | | 64.69 | 52 | 3.72 | 1.36 | 18.18% |
| SPXL | Direxion Daily S&P500 Bull 3X ETF | | 122.86 | 52 | 3.73 | 1.42 | 18.15% |
| SH | ProShares Short S&P500 | | 12.23 | 41 | -1.21 | -0.41 | -5.85% |
| SDS | ProShares UltraShort S&P500 | | 26.25 | 28 | -2.42 | -1.06 | -12.27% |
| SPXU | ProShares UltraPro Short S&P500 | | 34.89 | 23 | -3.78 | -1.72 | -18.86% |
| SPXS | Direxion Daily S&P 500 Bear 3X ETF | | 9.46 | 23 | -3.57 | -1.56 | -18.1% |
| 12Stocks.com: Charts, Trends, Fundamental Data and Performances of S&P 500 Stocks | |
|
We now take in-depth look at all S&P 500 stocks including charts, multi-period performances and overall trends (as measured by Smart Investing & Trading Score). One can sort S&P 500 stocks (click link to choose) by Daily, Weekly and by Year-to-Date performances. Also, one can sort by size of the company or by market capitalization. |
| Select Your Default Chart Type: | |||||
| |||||
| Click on stock symbol or name for detailed view. Click on to add stock symbol to your watchlist and to view watchlist. Quick View: Move mouse or cursor over "Daily" to quickly view daily technical stock chart and over "Weekly" to view weekly technical stock chart. | |||||

 | CMI Cummins Inc. |
| Sector: Industrials | |
| SubSector: Diversified Machinery | |
| MarketCap: 19127.1 Millions | |
| Recent Price: 280.74 Smart Investing & Trading Score: 49 | |
| Day Percent Change: 0.16% Day Change: 0.45 | |
| Week Change: -3.57% Year-to-date Change: 17.2% | |
| CMI Links: Profile News Message Board | |
| Charts:- Daily , Weekly | |
| Add CMI to Watchlist: View: Get CMI Trend Analysis ➞ | |
 | NI NiSource Inc. |
| Sector: Utilities | |
| SubSector: Diversified Utilities | |
| MarketCap: 9056.8 Millions | |
| Recent Price: 28.54 Smart Investing & Trading Score: 100 | |
| Day Percent Change: 0.14% Day Change: 0.04 | |
| Week Change: 2.15% Year-to-date Change: 7.5% | |
| NI Links: Profile News Message Board | |
| Charts:- Daily , Weekly | |
| Add NI to Watchlist: View: Get NI Trend Analysis ➞ | |
 | OMC Omnicom Group Inc. |
| Sector: Services & Goods | |
| SubSector: Advertising Agencies | |
| MarketCap: 11813.5 Millions | |
| Recent Price: 92.75 Smart Investing & Trading Score: 61 | |
| Day Percent Change: 0.13% Day Change: 0.12 | |
| Week Change: -3.27% Year-to-date Change: 7.2% | |
| OMC Links: Profile News Message Board | |
| Charts:- Daily , Weekly | |
| Add OMC to Watchlist: View: Get OMC Trend Analysis ➞ | |
 | EMR Emerson Electric Co. |
| Sector: Industrials | |
| SubSector: Industrial Electrical Equipment | |
| MarketCap: 30457.9 Millions | |
| Recent Price: 106.54 Smart Investing & Trading Score: 23 | |
| Day Percent Change: 0.12% Day Change: 0.13 | |
| Week Change: -3.05% Year-to-date Change: 9.5% | |
| EMR Links: Profile News Message Board | |
| Charts:- Daily , Weekly | |
| Add EMR to Watchlist: View: Get EMR Trend Analysis ➞ | |
 | WRK WestRock Company |
| Sector: Consumer Staples | |
| SubSector: Packaging & Containers | |
| MarketCap: 7835.43 Millions | |
| Recent Price: 51.16 Smart Investing & Trading Score: 100 | |
| Day Percent Change: 0.10% Day Change: 0.05 | |
| Week Change: 8.28% Year-to-date Change: 23.2% | |
| WRK Links: Profile News Message Board | |
| Charts:- Daily , Weekly | |
| Add WRK to Watchlist: View: Get WRK Trend Analysis ➞ | |
 | TAP Molson Coors Beverage Company |
| Sector: Consumer Staples | |
| SubSector: Beverages - Brewers | |
| MarketCap: 8619.97 Millions | |
| Recent Price: 57.85 Smart Investing & Trading Score: 32 | |
| Day Percent Change: 0.09% Day Change: 0.05 | |
| Week Change: -7.5% Year-to-date Change: -5.5% | |
| TAP Links: Profile News Message Board | |
| Charts:- Daily , Weekly | |
| Add TAP to Watchlist: View: Get TAP Trend Analysis ➞ | |
 | PM Philip Morris International Inc. |
| Sector: Consumer Staples | |
| SubSector: Cigarettes | |
| MarketCap: 105035 Millions | |
| Recent Price: 97.40 Smart Investing & Trading Score: 95 | |
| Day Percent Change: 0.09% Day Change: 0.09 | |
| Week Change: 2.5% Year-to-date Change: 3.5% | |
| PM Links: Profile News Message Board | |
| Charts:- Daily , Weekly | |
| Add PM to Watchlist: View: Get PM Trend Analysis ➞ | |
 | AJG Arthur J. Gallagher & Co. |
| Sector: Financials | |
| SubSector: Insurance Brokers | |
| MarketCap: 14852.2 Millions | |
| Recent Price: 238.72 Smart Investing & Trading Score: 57 | |
| Day Percent Change: 0.08% Day Change: 0.18 | |
| Week Change: 1.97% Year-to-date Change: 6.2% | |
| AJG Links: Profile News Message Board | |
| Charts:- Daily , Weekly | |
| Add AJG to Watchlist: View: Get AJG Trend Analysis ➞ | |
 | CME CME Group Inc. |
| Sector: Financials | |
| SubSector: Investment Brokerage - National | |
| MarketCap: 64145 Millions | |
| Recent Price: 207.65 Smart Investing & Trading Score: 0 | |
| Day Percent Change: 0.08% Day Change: 0.17 | |
| Week Change: -1.56% Year-to-date Change: -1.4% | |
| CME Links: Profile News Message Board | |
| Charts:- Daily , Weekly | |
| Add CME to Watchlist: View: Get CME Trend Analysis ➞ | |
 | HAL Halliburton Company |
| Sector: Energy | |
| SubSector: Oil & Gas Equipment & Services | |
| MarketCap: 5419.41 Millions | |
| Recent Price: 36.73 Smart Investing & Trading Score: 36 | |
| Day Percent Change: 0.08% Day Change: 0.03 | |
| Week Change: -4.7% Year-to-date Change: 1.6% | |
| HAL Links: Profile News Message Board | |
| Charts:- Daily , Weekly | |
| Add HAL to Watchlist: View: Get HAL Trend Analysis ➞ | |
 | SRE Sempra Energy |
| Sector: Utilities | |
| SubSector: Diversified Utilities | |
| MarketCap: 34339.9 Millions | |
| Recent Price: 72.92 Smart Investing & Trading Score: 90 | |
| Day Percent Change: 0.07% Day Change: 0.05 | |
| Week Change: 2.24% Year-to-date Change: -2.4% | |
| SRE Links: Profile News Message Board | |
| Charts:- Daily , Weekly | |
| Add SRE to Watchlist: View: Get SRE Trend Analysis ➞ | |
 | MOH Molina Healthcare, Inc. |
| Sector: Health Care | |
| SubSector: Health Care Plans | |
| MarketCap: 7235.6 Millions | |
| Recent Price: 339.68 Smart Investing & Trading Score: 18 | |
| Day Percent Change: 0.04% Day Change: 0.13 | |
| Week Change: -0.75% Year-to-date Change: -6.0% | |
| MOH Links: Profile News Message Board | |
| Charts:- Daily , Weekly | |
| Add MOH to Watchlist: View: Get MOH Trend Analysis ➞ | |
 | ULTA Ulta Beauty, Inc. |
| Sector: Services & Goods | |
| SubSector: Specialty Retail, Other | |
| MarketCap: 9429.94 Millions | |
| Recent Price: 397.39 Smart Investing & Trading Score: 10 | |
| Day Percent Change: 0.02% Day Change: 0.06 | |
| Week Change: -2.21% Year-to-date Change: -18.9% | |
| ULTA Links: Profile News Message Board | |
| Charts:- Daily , Weekly | |
| Add ULTA to Watchlist: View: Get ULTA Trend Analysis ➞ | |
 | HLT Hilton Worldwide Holdings Inc. |
| Sector: Services & Goods | |
| SubSector: Lodging | |
| MarketCap: 18064.6 Millions | |
| Recent Price: 197.54 Smart Investing & Trading Score: 32 | |
| Day Percent Change: 0.01% Day Change: 0.01 | |
| Week Change: -2.27% Year-to-date Change: 8.5% | |
| HLT Links: Profile News Message Board | |
| Charts:- Daily , Weekly | |
| Add HLT to Watchlist: View: Get HLT Trend Analysis ➞ | |
 | VMC Vulcan Materials Company |
| Sector: Industrials | |
| SubSector: General Building Materials | |
| MarketCap: 12304.7 Millions | |
| Recent Price: 264.44 Smart Investing & Trading Score: 60 | |
| Day Percent Change: 0.01% Day Change: 0.03 | |
| Week Change: 1.22% Year-to-date Change: 16.5% | |
| VMC Links: Profile News Message Board | |
| Charts:- Daily , Weekly | |
| Add VMC to Watchlist: View: Get VMC Trend Analysis ➞ | |
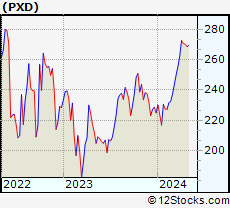 | PXD Pioneer Natural Resources Company |
| Sector: Energy | |
| SubSector: Independent Oil & Gas | |
| MarketCap: 11846.2 Millions | |
| Recent Price: 269.62 Smart Investing & Trading Score: 68 | |
| Day Percent Change: 0.00% Day Change: 0.00 | |
| Week Change: 0.28% Year-to-date Change: 19.9% | |
| PXD Links: Profile News Message Board | |
| Charts:- Daily , Weekly | |
| Add PXD to Watchlist: View: Get PXD Trend Analysis ➞ | |
 | LNT Alliant Energy Corporation |
| Sector: Utilities | |
| SubSector: Electric Utilities | |
| MarketCap: 10678.4 Millions | |
| Recent Price: 50.85 Smart Investing & Trading Score: 100 | |
| Day Percent Change: 0.00% Day Change: 0.00 | |
| Week Change: 2.54% Year-to-date Change: -0.9% | |
| LNT Links: Profile News Message Board | |
| Charts:- Daily , Weekly | |
| Add LNT to Watchlist: View: Get LNT Trend Analysis ➞ | |
 | VICI VICI Properties Inc. |
| Sector: Financials | |
| SubSector: REIT - Diversified | |
| MarketCap: 7327.03 Millions | |
| Recent Price: 28.80 Smart Investing & Trading Score: 69 | |
| Day Percent Change: 0.00% Day Change: 0.00 | |
| Week Change: 1.16% Year-to-date Change: -9.7% | |
| VICI Links: Profile News Message Board | |
| Charts:- Daily , Weekly | |
| Add VICI to Watchlist: View: Get VICI Trend Analysis ➞ | |
 | VRSN VeriSign, Inc. |
| Sector: Technology | |
| SubSector: Internet Information Providers | |
| MarketCap: 19657 Millions | |
| Recent Price: 168.32 Smart Investing & Trading Score: 18 | |
| Day Percent Change: -0.01% Day Change: -0.02 | |
| Week Change: -4.08% Year-to-date Change: -18.3% | |
| VRSN Links: Profile News Message Board | |
| Charts:- Daily , Weekly | |
| Add VRSN to Watchlist: View: Get VRSN Trend Analysis ➞ | |
 | ABT Abbott Laboratories |
| Sector: Health Care | |
| SubSector: Medical Appliances & Equipment | |
| MarketCap: 125288 Millions | |
| Recent Price: 105.90 Smart Investing & Trading Score: 18 | |
| Day Percent Change: -0.02% Day Change: -0.02 | |
| Week Change: -1.52% Year-to-date Change: -3.8% | |
| ABT Links: Profile News Message Board | |
| Charts:- Daily , Weekly | |
| Add ABT to Watchlist: View: Get ABT Trend Analysis ➞ | |
 | COP ConocoPhillips |
| Sector: Energy | |
| SubSector: Independent Oil & Gas | |
| MarketCap: 33504.3 Millions | |
| Recent Price: 122.23 Smart Investing & Trading Score: 26 | |
| Day Percent Change: -0.02% Day Change: -0.02 | |
| Week Change: -6.15% Year-to-date Change: 5.3% | |
| COP Links: Profile News Message Board | |
| Charts:- Daily , Weekly | |
| Add COP to Watchlist: View: Get COP Trend Analysis ➞ | |
 | C Citigroup Inc. |
| Sector: Financials | |
| SubSector: Money Center Banks | |
| MarketCap: 94128 Millions | |
| Recent Price: 61.52 Smart Investing & Trading Score: 61 | |
| Day Percent Change: -0.03% Day Change: -0.02 | |
| Week Change: -1.82% Year-to-date Change: 19.6% | |
| C Links: Profile News Message Board | |
| Charts:- Daily , Weekly | |
| Add C to Watchlist: View: Get C Trend Analysis ➞ | |
 | CL Colgate-Palmolive Company |
| Sector: Consumer Staples | |
| SubSector: Personal Products | |
| MarketCap: 57242.7 Millions | |
| Recent Price: 92.88 Smart Investing & Trading Score: 88 | |
| Day Percent Change: -0.03% Day Change: -0.03 | |
| Week Change: 2.05% Year-to-date Change: 16.5% | |
| CL Links: Profile News Message Board | |
| Charts:- Daily , Weekly | |
| Add CL to Watchlist: View: Get CL Trend Analysis ➞ | |
 | CTSH Cognizant Technology Solutions Corporation |
| Sector: Technology | |
| SubSector: Information Technology Services | |
| MarketCap: 26249.7 Millions | |
| Recent Price: 66.25 Smart Investing & Trading Score: 42 | |
| Day Percent Change: -0.03% Day Change: -0.02 | |
| Week Change: -1.03% Year-to-date Change: -12.3% | |
| CTSH Links: Profile News Message Board | |
| Charts:- Daily , Weekly | |
| Add CTSH to Watchlist: View: Get CTSH Trend Analysis ➞ | |
 | BKR Baker Hughes Company |
| Sector: Services & Goods | |
| SubSector: Technical Services | |
| MarketCap: 1330 Millions | |
| Recent Price: 31.92 Smart Investing & Trading Score: 36 | |
| Day Percent Change: -0.03% Day Change: -0.01 | |
| Week Change: -2.8% Year-to-date Change: -6.6% | |
| BKR Links: Profile News Message Board | |
| Charts:- Daily , Weekly | |
| Add BKR to Watchlist: View: Get BKR Trend Analysis ➞ | |
| For tabular summary view of above stock list: Summary View ➞ 0 - 25 , 25 - 50 , 50 - 75 , 75 - 100 , 100 - 125 , 125 - 150 , 150 - 175 , 175 - 200 , 200 - 225 , 225 - 250 , 250 - 275 , 275 - 300 , 300 - 325 , 325 - 350 , 350 - 375 , 375 - 400 , 400 - 425 , 425 - 450 , 450 - 475 , 475 - 500 | ||
| Click To Change The Sort Order: By Market Cap or Company Size Performance: Year-to-date, Week and Day | |
| Select Chart Type: | ||
|
Best Stocks Today 12Stocks.com |
© 2024 12Stocks.com Terms & Conditions Privacy Contact Us
All Information Provided Only For Education And Not To Be Used For Investing or Trading. See Terms & Conditions


One More Thing ... Get Best Stocks Delivered Daily!
Never Ever Miss A Move With Our Top Ten Stocks Lists
Find Best Stocks In Any Market - Bull or Bear Market
Take A Peek At Our Top Ten Stocks Lists: Daily, Weekly, Year-to-Date & Top Trends
Find Best Stocks In Any Market - Bull or Bear Market
Take A Peek At Our Top Ten Stocks Lists: Daily, Weekly, Year-to-Date & Top Trends
S&P 500 Stocks With Best Up Trends [0-bearish to 100-bullish]: Amgen [100], First Solar[100], Apple [100], Motorola Solutions[100], Camden Property[100], Aptiv [100], Rollins [100], Teradyne [100], Comerica [100], BorgWarner [100], Bio-Techne [100]
Best S&P 500 Stocks Year-to-Date:
NVIDIA [79.29%], Constellation [66.35%], NRG [48.26%], Chipotle Mexican[37.97%], Western Digital[35.48%], Micron [34.4%], Eaton [33.09%], Progressive [31.04%], Leidos Holdings[30.89%], Diamondback [29.93%], Targa Resources[29.29%] Best S&P 500 Stocks This Week:
Bio-Techne [20.65%], Moderna [15.77%], Garmin [15.7%], C.H. Robinson[15.64%], Amgen [15.3%], Aptiv [13.5%], Amcor [11.59%], BorgWarner [9.79%], Albemarle [9.6%], Pfizer [9.49%], Leidos Holdings[8.68%] Best S&P 500 Stocks Daily:
Amgen [11.82%], Enphase [7.67%], Live Nation[7.24%], First Solar[6.12%], Apple [5.98%], Motorola Solutions[5.19%], Digital Realty[4.89%], Constellation [4.87%], Arista Networks[4.79%], Camden Property[4.53%], Aptiv [3.90%]