
 Login Sign Up


| |||||
 |  | ||||

| 12Stocks.com Market Intelligence |
Best S&P 500 Stocks
|
On this page, you will find the most comprehensive analysis of S&P 500 stocks and ETFs - from latest trends to performances to charts ➞. First, here are the year-to-date (YTD) performances of the most requested S&P 500 stocks at 12Stocks.com (click stock for review):
| NVIDIA 79% | ||
| Amazon.com 23% | ||
| Google 20% | ||
| Merck 17% | ||
| Caterpillar 14% | ||
| Walmart 14% | ||
| Goldman Sachs 14% | ||
| JPMorgan Chase 12% | ||
| Microsoft 8% | ||
| Chevron 7% | ||
| Apple -5% | ||
| Johnson & Johnson -5% | ||
| McDonald s -9% | ||
| Gilead -20% | ||
| Starbucks -24% | ||
| Boeing -31% | ||
| Intel -39% | ||
| Quick: S&P 500 Stocks Lists: Performances & Trends, S&P 500 Stock Charts
Sort S&P 500 stocks: Daily, Weekly, Year-to-Date, Market Cap & Trends. Filter S&P 500 stocks list by sector: Show all, Tech, Finance, Energy, Staples, Retail, Industrial, Materials, Utilities and HealthCare |
| 12Stocks.com S&P 500 Stocks Performances & Trends Daily Report | |||||||||
|
| 
The overall Smart Investing & Trading Score is 60 (0-bearish to 100-bullish) which puts S&P 500 index in short term neutral to bullish trend. The Smart Investing & Trading Score from previous trading session is 30 and hence an improvement of trend. | ||||||||
Here are the Smart Investing & Trading Scores of the most requested S&P 500 stocks at 12Stocks.com (click stock name for detailed review):
|


| 12Stocks.com: Top Performing S&P 500 Index Stocks | ||||||||||||||||||||||||||||||||||||||||||||||||
 The top performing S&P 500 Index stocks year to date are
Now, more recently, over last week, the top performing S&P 500 Index stocks on the move are


|
||||||||||||||||||||||||||||||||||||||||||||||||
| 12Stocks.com: Investing in S&P 500 Index with Stocks | |
|
The following table helps investors and traders sort through current performance and trends (as measured by Smart Investing & Trading Score) of various
stocks in the S&P 500 Index. Quick View: Move mouse or cursor over stock symbol (ticker) to view short-term technical chart and over stock name to view long term chart. Click on  to add stock symbol to your watchlist and to add stock symbol to your watchlist and  to view watchlist. Click on any ticker or stock name for detailed market intelligence report for that stock. to view watchlist. Click on any ticker or stock name for detailed market intelligence report for that stock. |
12Stocks.com Performance of Stocks in S&P 500 Index
| Ticker | Stock Name | Watchlist | Category | Recent Price | Smart Investing & Trading Score | Change % | YTD Change% |
| ZBRA | Zebra Technologies |   | Technology | 309.59 | 75 | -1.00 | 13.27% |
| KHC | Kraft Heinz | | Consumer Staples | 36.35 | 41 | -1.01 | -1.70% |
| CLX | Clorox | | Consumer Staples | 138.23 | 0 | -1.03 | -3.06% |
| GIS | General Mills | | Consumer Staples | 69.91 | 51 | -1.05 | 7.32% |
| MCD | McDonald s | | Services & Goods | 270.32 | 25 | -1.08 | -8.83% |
| HSIC | Henry Schein | | Services & Goods | 67.78 | 0 | -1.20 | -10.47% |
| ES | Eversource | | Utilities | 60.01 | 63 | -1.22 | -2.77% |
| NOC | Northrop Grumman | | Industrials | 469.09 | 63 | -1.24 | 0.20% |
| K | Kellogg | | Consumer Staples | 60.51 | 100 | -1.26 | 8.23% |
| EXC | Exelon | | Utilities | 37.41 | 66 | -1.27 | 4.21% |
| UHS | Universal Health | | Health Care | 167.70 | 35 | -1.29 | 10.01% |
| EOG | EOG Resources | | Energy | 130.02 | 36 | -1.35 | 7.50% |
| AES | AES | | Utilities | 18.67 | 100 | -1.37 | -3.01% |
| EL | Estee Lauder | | Consumer Staples | 132.94 | 17 | -1.48 | -9.10% |
| AEE | Ameren | | Utilities | 74.09 | 71 | -1.54 | 2.42% |
| PCAR | PACCAR Inc | | Consumer Staples | 104.79 | 10 | -1.57 | 7.31% |
| REG | Regency Centers | | Financials | 59.00 | 40 | -1.70 | -11.94% |
| PYPL | PayPal Holdings | | Financials | 65.70 | 63 | -1.91 | 6.99% |
| IRM | Iron Mountain | | Technology | 75.32 | 7 | -2.18 | 7.63% |
| GL | Globe Life | | Financials | 77.55 | 45 | -2.18 | -36.29% |
| CPB | Campbell Soup | | Consumer Staples | 44.88 | 68 | -2.20 | 3.82% |
| BDX | Becton Dickinson | | Health Care | 234.68 | 52 | -2.36 | -3.75% |
| SBUX | Starbucks | | Services & Goods | 73.11 | 0 | -2.43 | -23.85% |
| MKTX | MarketAxess Holdings | | Financials | 203.82 | 47 | -2.53 | -30.40% |
| FRT | Federal Realty | | Financials | 102.01 | 63 | -2.76 | -1.01% |
| For chart view version of above stock list: Chart View ➞ 0 - 25 , 25 - 50 , 50 - 75 , 75 - 100 , 100 - 125 , 125 - 150 , 150 - 175 , 175 - 200 , 200 - 225 , 225 - 250 , 250 - 275 , 275 - 300 , 300 - 325 , 325 - 350 , 350 - 375 , 375 - 400 , 400 - 425 , 425 - 450 , 450 - 475 , 475 - 500 | ||
 | Click To Change The Sort Order: By Market Cap or Company Size Performance: Year-to-date, Week and Day |  |
|
Get the most comprehensive stock market coverage daily at 12Stocks.com ➞ Best Stocks Today ➞ Best Stocks Weekly ➞ Best Stocks Year-to-Date ➞ Best Stocks Trends ➞  Best Stocks Today 12Stocks.com Best Nasdaq Stocks ➞ Best S&P 500 Stocks ➞ Best Tech Stocks ➞ Best Biotech Stocks ➞ |
| Detailed Overview of S&P 500 Stocks |
| S&P 500 Technical Overview, Leaders & Laggards, Top S&P 500 ETF Funds & Detailed S&P 500 Stocks List, Charts, Trends & More |
| S&P 500: Technical Analysis, Trends & YTD Performance | |
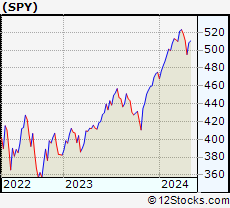
| S&P 500 index as represented by
SPY, an exchange-traded fund [ETF], holds basket of five hundred (mostly largecap) stocks from across all major sectors of the US stock market. The S&P 500 index (contains stocks like Apple and Exxon) is up by 7.57% and is currently outperforming the overall market by 0.69% year-to-date. Below is a quick view of technical charts and trends: | |
 SPY Weekly Chart |
|
| Long Term Trend: Good | |
| Medium Term Trend: Good | |
 SPY Daily Chart |
|
| Short Term Trend: Very Good | |
| Overall Trend Score: 60 | |
| YTD Performance: 7.57% | |
| **Trend Scores & Views Are Only For Educational Purposes And Not For Investing | |
| 12Stocks.com: Investing in S&P 500 Index using Exchange Traded Funds | |
|
The following table shows list of key exchange traded funds (ETF) that
help investors track S&P 500 index. The following list also includes leveraged ETF funds that track twice or thrice the daily returns of S&P 500 indices. Short or inverse ETF funds move in the opposite direction to the index they track and are useful during market pullbacks or during bear markets. Quick View: Move mouse or cursor over ETF symbol (ticker) to view short-term technical chart and over ETF name to view long term chart. Click on ticker or stock name for detailed view. Click on to add stock symbol to your watchlist and to view watchlist. |
12Stocks.com List of ETFs that track S&P 500 Index
| Ticker | ETF Name | Watchlist | Recent Price | Smart Investing & Trading Score | Change % | Week % | Year-to-date % |
| SPY | SPDR S&P 500 ETF | | 511.29 | 60 | 1.24 | 0.6 | 7.57% |
| IVV | iShares Core S&P 500 ETF | | 513.84 | 60 | 1.26 | 0.6 | 7.58% |
| VOO | Vanguard 500 ETF | | 469.98 | 60 | 1.24 | 0.59 | 7.6% |
| OEF | iShares S&P 100 | | 243.74 | 83 | 1.46 | 0.9 | 9.11% |
| SSO | ProShares Ultra S&P500 | | 73.46 | 60 | 2.51 | 1.03 | 12.89% |
| UPRO | ProShares UltraPro S&P500 | | 64.69 | 52 | 3.72 | 1.36 | 18.18% |
| SPXL | Direxion Daily S&P500 Bull 3X ETF | | 122.86 | 52 | 3.73 | 1.42 | 18.15% |
| SH | ProShares Short S&P500 | | 12.23 | 41 | -1.21 | -0.41 | -5.85% |
| SDS | ProShares UltraShort S&P500 | | 26.25 | 28 | -2.42 | -1.06 | -12.27% |
| SPXU | ProShares UltraPro Short S&P500 | | 34.89 | 23 | -3.78 | -1.72 | -18.86% |
| SPXS | Direxion Daily S&P 500 Bear 3X ETF | | 9.46 | 23 | -3.57 | -1.56 | -18.1% |
| 12Stocks.com: Charts, Trends, Fundamental Data and Performances of S&P 500 Stocks | |
|
We now take in-depth look at all S&P 500 stocks including charts, multi-period performances and overall trends (as measured by Smart Investing & Trading Score). One can sort S&P 500 stocks (click link to choose) by Daily, Weekly and by Year-to-Date performances. Also, one can sort by size of the company or by market capitalization. |
| Select Your Default Chart Type: | |||||
| |||||
| Click on stock symbol or name for detailed view. Click on to add stock symbol to your watchlist and to view watchlist. Quick View: Move mouse or cursor over "Daily" to quickly view daily technical stock chart and over "Weekly" to view weekly technical stock chart. | |||||

 | ZBRA Zebra Technologies Corporation |
| Sector: Technology | |
| SubSector: Communication Equipment | |
| MarketCap: 11474.9 Millions | |
| Recent Price: 309.59 Smart Investing & Trading Score: 75 | |
| Day Percent Change: -1.00% Day Change: -3.12 | |
| Week Change: 4.17% Year-to-date Change: 13.3% | |
| ZBRA Links: Profile News Message Board | |
| Charts:- Daily , Weekly | |
| Add ZBRA to Watchlist: View: Get ZBRA Trend Analysis ➞ | |
 | KHC The Kraft Heinz Company |
| Sector: Consumer Staples | |
| SubSector: Food - Major Diversified | |
| MarketCap: 32096.3 Millions | |
| Recent Price: 36.35 Smart Investing & Trading Score: 41 | |
| Day Percent Change: -1.01% Day Change: -0.37 | |
| Week Change: -4.74% Year-to-date Change: -1.7% | |
| KHC Links: Profile News Message Board | |
| Charts:- Daily , Weekly | |
| Add KHC to Watchlist: View: Get KHC Trend Analysis ➞ | |
 | CLX The Clorox Company |
| Sector: Consumer Staples | |
| SubSector: Housewares & Accessories | |
| MarketCap: 23688.3 Millions | |
| Recent Price: 138.23 Smart Investing & Trading Score: 0 | |
| Day Percent Change: -1.03% Day Change: -1.44 | |
| Week Change: -5.63% Year-to-date Change: -3.1% | |
| CLX Links: Profile News Message Board | |
| Charts:- Daily , Weekly | |
| Add CLX to Watchlist: View: Get CLX Trend Analysis ➞ | |
 | GIS General Mills, Inc. |
| Sector: Consumer Staples | |
| SubSector: Processed & Packaged Goods | |
| MarketCap: 34131.7 Millions | |
| Recent Price: 69.91 Smart Investing & Trading Score: 51 | |
| Day Percent Change: -1.05% Day Change: -0.74 | |
| Week Change: -1.3% Year-to-date Change: 7.3% | |
| GIS Links: Profile News Message Board | |
| Charts:- Daily , Weekly | |
| Add GIS to Watchlist: View: Get GIS Trend Analysis ➞ | |
 | MCD McDonald s Corporation |
| Sector: Services & Goods | |
| SubSector: Restaurants | |
| MarketCap: 122481 Millions | |
| Recent Price: 270.32 Smart Investing & Trading Score: 25 | |
| Day Percent Change: -1.08% Day Change: -2.96 | |
| Week Change: -1.01% Year-to-date Change: -8.8% | |
| MCD Links: Profile News Message Board | |
| Charts:- Daily , Weekly | |
| Add MCD to Watchlist: View: Get MCD Trend Analysis ➞ | |
 | HSIC Henry Schein, Inc. |
| Sector: Services & Goods | |
| SubSector: Medical Equipment Wholesale | |
| MarketCap: 6760.9 Millions | |
| Recent Price: 67.78 Smart Investing & Trading Score: 0 | |
| Day Percent Change: -1.20% Day Change: -0.82 | |
| Week Change: -7.32% Year-to-date Change: -10.5% | |
| HSIC Links: Profile News Message Board | |
| Charts:- Daily , Weekly | |
| Add HSIC to Watchlist: View: Get HSIC Trend Analysis ➞ | |
 | ES Eversource Energy |
| Sector: Utilities | |
| SubSector: Diversified Utilities | |
| MarketCap: 23963.4 Millions | |
| Recent Price: 60.01 Smart Investing & Trading Score: 63 | |
| Day Percent Change: -1.22% Day Change: -0.74 | |
| Week Change: 0.92% Year-to-date Change: -2.8% | |
| ES Links: Profile News Message Board | |
| Charts:- Daily , Weekly | |
| Add ES to Watchlist: View: Get ES Trend Analysis ➞ | |
 | NOC Northrop Grumman Corporation |
| Sector: Industrials | |
| SubSector: Aerospace/Defense - Major Diversified | |
| MarketCap: 52094.9 Millions | |
| Recent Price: 469.09 Smart Investing & Trading Score: 63 | |
| Day Percent Change: -1.24% Day Change: -5.91 | |
| Week Change: -2.36% Year-to-date Change: 0.2% | |
| NOC Links: Profile News Message Board | |
| Charts:- Daily , Weekly | |
| Add NOC to Watchlist: View: Get NOC Trend Analysis ➞ | |
 | K Kellogg Company |
| Sector: Consumer Staples | |
| SubSector: Processed & Packaged Goods | |
| MarketCap: 20264.6 Millions | |
| Recent Price: 60.51 Smart Investing & Trading Score: 100 | |
| Day Percent Change: -1.26% Day Change: -0.77 | |
| Week Change: 4.82% Year-to-date Change: 8.2% | |
| K Links: Profile News Message Board | |
| Charts:- Daily , Weekly | |
| Add K to Watchlist: View: Get K Trend Analysis ➞ | |
 | EXC Exelon Corporation |
| Sector: Utilities | |
| SubSector: Diversified Utilities | |
| MarketCap: 34091.9 Millions | |
| Recent Price: 37.41 Smart Investing & Trading Score: 66 | |
| Day Percent Change: -1.27% Day Change: -0.48 | |
| Week Change: 0.24% Year-to-date Change: 4.2% | |
| EXC Links: Profile News Message Board | |
| Charts:- Daily , Weekly | |
| Add EXC to Watchlist: View: Get EXC Trend Analysis ➞ | |
 | UHS Universal Health Services, Inc. |
| Sector: Health Care | |
| SubSector: Hospitals | |
| MarketCap: 7217.66 Millions | |
| Recent Price: 167.70 Smart Investing & Trading Score: 35 | |
| Day Percent Change: -1.29% Day Change: -2.19 | |
| Week Change: 0.99% Year-to-date Change: 10.0% | |
| UHS Links: Profile News Message Board | |
| Charts:- Daily , Weekly | |
| Add UHS to Watchlist: View: Get UHS Trend Analysis ➞ | |
 | EOG EOG Resources, Inc. |
| Sector: Energy | |
| SubSector: Independent Oil & Gas | |
| MarketCap: 24282.1 Millions | |
| Recent Price: 130.02 Smart Investing & Trading Score: 36 | |
| Day Percent Change: -1.35% Day Change: -1.78 | |
| Week Change: -4.19% Year-to-date Change: 7.5% | |
| EOG Links: Profile News Message Board | |
| Charts:- Daily , Weekly | |
| Add EOG to Watchlist: View: Get EOG Trend Analysis ➞ | |
 | AES The AES Corporation |
| Sector: Utilities | |
| SubSector: Electric Utilities | |
| MarketCap: 9173.44 Millions | |
| Recent Price: 18.67 Smart Investing & Trading Score: 100 | |
| Day Percent Change: -1.37% Day Change: -0.26 | |
| Week Change: 8.48% Year-to-date Change: -3.0% | |
| AES Links: Profile News Message Board | |
| Charts:- Daily , Weekly | |
| Add AES to Watchlist: View: Get AES Trend Analysis ➞ | |
 | EL The Estee Lauder Companies Inc. |
| Sector: Consumer Staples | |
| SubSector: Personal Products | |
| MarketCap: 59521.1 Millions | |
| Recent Price: 132.94 Smart Investing & Trading Score: 17 | |
| Day Percent Change: -1.48% Day Change: -2.00 | |
| Week Change: -9.84% Year-to-date Change: -9.1% | |
| EL Links: Profile News Message Board | |
| Charts:- Daily , Weekly | |
| Add EL to Watchlist: View: Get EL Trend Analysis ➞ | |
 | AEE Ameren Corporation |
| Sector: Utilities | |
| SubSector: Electric Utilities | |
| MarketCap: 17308.2 Millions | |
| Recent Price: 74.09 Smart Investing & Trading Score: 71 | |
| Day Percent Change: -1.54% Day Change: -1.16 | |
| Week Change: 0.58% Year-to-date Change: 2.4% | |
| AEE Links: Profile News Message Board | |
| Charts:- Daily , Weekly | |
| Add AEE to Watchlist: View: Get AEE Trend Analysis ➞ | |
 | PCAR PACCAR Inc |
| Sector: Consumer Staples | |
| SubSector: Trucks & Other Vehicles | |
| MarketCap: 19117.7 Millions | |
| Recent Price: 104.79 Smart Investing & Trading Score: 10 | |
| Day Percent Change: -1.57% Day Change: -1.67 | |
| Week Change: -6.4% Year-to-date Change: 7.3% | |
| PCAR Links: Profile News Message Board | |
| Charts:- Daily , Weekly | |
| Add PCAR to Watchlist: View: Get PCAR Trend Analysis ➞ | |
 | REG Regency Centers Corporation |
| Sector: Financials | |
| SubSector: REIT - Retail | |
| MarketCap: 6345.84 Millions | |
| Recent Price: 59.00 Smart Investing & Trading Score: 40 | |
| Day Percent Change: -1.70% Day Change: -1.02 | |
| Week Change: 1.24% Year-to-date Change: -11.9% | |
| REG Links: Profile News Message Board | |
| Charts:- Daily , Weekly | |
| Add REG to Watchlist: View: Get REG Trend Analysis ➞ | |
 | PYPL PayPal Holdings, Inc. |
| Sector: Financials | |
| SubSector: Credit Services | |
| MarketCap: 108949 Millions | |
| Recent Price: 65.70 Smart Investing & Trading Score: 63 | |
| Day Percent Change: -1.91% Day Change: -1.28 | |
| Week Change: -0.39% Year-to-date Change: 7.0% | |
| PYPL Links: Profile News Message Board | |
| Charts:- Daily , Weekly | |
| Add PYPL to Watchlist: View: Get PYPL Trend Analysis ➞ | |
 | IRM Iron Mountain Incorporated |
| Sector: Technology | |
| SubSector: Business Software & Services | |
| MarketCap: 7339.18 Millions | |
| Recent Price: 75.32 Smart Investing & Trading Score: 7 | |
| Day Percent Change: -2.18% Day Change: -1.68 | |
| Week Change: -2.84% Year-to-date Change: 7.6% | |
| IRM Links: Profile News Message Board | |
| Charts:- Daily , Weekly | |
| Add IRM to Watchlist: View: Get IRM Trend Analysis ➞ | |
 | GL Globe Life Inc. |
| Sector: Financials | |
| SubSector: Life Insurance | |
| MarketCap: 7596.46 Millions | |
| Recent Price: 77.55 Smart Investing & Trading Score: 45 | |
| Day Percent Change: -2.18% Day Change: -1.73 | |
| Week Change: 2.38% Year-to-date Change: -36.3% | |
| GL Links: Profile News Message Board | |
| Charts:- Daily , Weekly | |
| Add GL to Watchlist: View: Get GL Trend Analysis ➞ | |
 | CPB Campbell Soup Company |
| Sector: Consumer Staples | |
| SubSector: Processed & Packaged Goods | |
| MarketCap: 14468.8 Millions | |
| Recent Price: 44.88 Smart Investing & Trading Score: 68 | |
| Day Percent Change: -2.20% Day Change: -1.01 | |
| Week Change: 0.07% Year-to-date Change: 3.8% | |
| CPB Links: Profile News Message Board | |
| Charts:- Daily , Weekly | |
| Add CPB to Watchlist: View: Get CPB Trend Analysis ➞ | |
 | BDX Becton, Dickinson and Company |
| Sector: Health Care | |
| SubSector: Medical Instruments & Supplies | |
| MarketCap: 62758.4 Millions | |
| Recent Price: 234.68 Smart Investing & Trading Score: 52 | |
| Day Percent Change: -2.36% Day Change: -5.67 | |
| Week Change: 1.35% Year-to-date Change: -3.8% | |
| BDX Links: Profile News Message Board | |
| Charts:- Daily , Weekly | |
| Add BDX to Watchlist: View: Get BDX Trend Analysis ➞ | |
 | SBUX Starbucks Corporation |
| Sector: Services & Goods | |
| SubSector: Specialty Eateries | |
| MarketCap: 74909.7 Millions | |
| Recent Price: 73.11 Smart Investing & Trading Score: 0 | |
| Day Percent Change: -2.43% Day Change: -1.82 | |
| Week Change: -17.16% Year-to-date Change: -23.9% | |
| SBUX Links: Profile News Message Board | |
| Charts:- Daily , Weekly | |
| Add SBUX to Watchlist: View: Get SBUX Trend Analysis ➞ | |
 | MKTX MarketAxess Holdings Inc. |
| Sector: Financials | |
| SubSector: Investment Brokerage - National | |
| MarketCap: 12431.5 Millions | |
| Recent Price: 203.82 Smart Investing & Trading Score: 47 | |
| Day Percent Change: -2.53% Day Change: -5.30 | |
| Week Change: 1.01% Year-to-date Change: -30.4% | |
| MKTX Links: Profile News Message Board | |
| Charts:- Daily , Weekly | |
| Add MKTX to Watchlist: View: Get MKTX Trend Analysis ➞ | |
 | FRT Federal Realty Investment Trust |
| Sector: Financials | |
| SubSector: REIT - Retail | |
| MarketCap: 5878.64 Millions | |
| Recent Price: 102.01 Smart Investing & Trading Score: 63 | |
| Day Percent Change: -2.76% Day Change: -2.90 | |
| Week Change: -0.18% Year-to-date Change: -1.0% | |
| FRT Links: Profile News Message Board | |
| Charts:- Daily , Weekly | |
| Add FRT to Watchlist: View: Get FRT Trend Analysis ➞ | |
| For tabular summary view of above stock list: Summary View ➞ 0 - 25 , 25 - 50 , 50 - 75 , 75 - 100 , 100 - 125 , 125 - 150 , 150 - 175 , 175 - 200 , 200 - 225 , 225 - 250 , 250 - 275 , 275 - 300 , 300 - 325 , 325 - 350 , 350 - 375 , 375 - 400 , 400 - 425 , 425 - 450 , 450 - 475 , 475 - 500 | ||
| Click To Change The Sort Order: By Market Cap or Company Size Performance: Year-to-date, Week and Day | |
| Select Chart Type: | ||
|
Best Stocks Today 12Stocks.com |
© 2024 12Stocks.com Terms & Conditions Privacy Contact Us
All Information Provided Only For Education And Not To Be Used For Investing or Trading. See Terms & Conditions


One More Thing ... Get Best Stocks Delivered Daily!
Never Ever Miss A Move With Our Top Ten Stocks Lists
Find Best Stocks In Any Market - Bull or Bear Market
Take A Peek At Our Top Ten Stocks Lists: Daily, Weekly, Year-to-Date & Top Trends
Find Best Stocks In Any Market - Bull or Bear Market
Take A Peek At Our Top Ten Stocks Lists: Daily, Weekly, Year-to-Date & Top Trends
S&P 500 Stocks With Best Up Trends [0-bearish to 100-bullish]: Amgen [100], First Solar[100], Apple [100], Motorola Solutions[100], Camden Property[100], Aptiv [100], Rollins [100], Teradyne [100], Comerica [100], BorgWarner [100], Bio-Techne [100]
Best S&P 500 Stocks Year-to-Date:
NVIDIA [79.29%], Constellation [66.35%], NRG [48.26%], Chipotle Mexican[37.97%], Western Digital[35.48%], Micron [34.4%], Eaton [33.09%], Progressive [31.04%], Leidos Holdings[30.89%], Diamondback [29.93%], Targa Resources[29.29%] Best S&P 500 Stocks This Week:
Bio-Techne [20.65%], Moderna [15.77%], Garmin [15.7%], C.H. Robinson[15.64%], Amgen [15.3%], Aptiv [13.5%], Amcor [11.59%], BorgWarner [9.79%], Albemarle [9.6%], Pfizer [9.49%], Leidos Holdings[8.68%] Best S&P 500 Stocks Daily:
Amgen [11.82%], Enphase [7.67%], Live Nation[7.24%], First Solar[6.12%], Apple [5.98%], Motorola Solutions[5.19%], Digital Realty[4.89%], Constellation [4.87%], Arista Networks[4.79%], Camden Property[4.53%], Aptiv [3.90%]