
 Login Sign Up


| |||||
 |  | ||||

| 12Stocks.com Market Intelligence |
Best Healthcare Stocks
 | "Discover best trending healthcare stocks with 12Stocks.com." |
| - Subu Vdaygiri, Founder, 12Stocks.com |
| In a hurry? Healthcare Stocks Lists: Performance Trends Table, Stock Charts
Sort Healthcare stocks: Daily, Weekly, Year-to-Date, Market Cap & Trends. Filter Healthcare stocks list by size:All Healthcare Large Mid-Range Small |
| 12Stocks.com Healthcare Stocks Performances & Trends Daily | |||||||||
|
|  The overall Smart Investing & Trading Score is 30 (0-bearish to 100-bullish) which puts Healthcare sector in short term bearish to neutral trend. The Smart Investing & Trading Score from previous trading session is 50 and hence a deterioration of trend.
| ||||||||
Here are the Smart Investing & Trading Scores of the most requested Healthcare stocks at 12Stocks.com (click stock name for detailed review):
|


| 12Stocks.com: Investing in Healthcare sector with Stocks | |
|
The following table helps investors and traders sort through current performance and trends (as measured by Smart Investing & Trading Score) of various
stocks in the Healthcare sector. Quick View: Move mouse or cursor over stock symbol (ticker) to view short-term Technical chart and over stock name to view long term chart. Click on  to add stock symbol to your watchlist and to add stock symbol to your watchlist and  to view watchlist. Click on any ticker or stock name for detailed market intelligence report for that stock. to view watchlist. Click on any ticker or stock name for detailed market intelligence report for that stock. |
12Stocks.com Performance of Stocks in Healthcare Sector
| Ticker | Stock Name | Watchlist | Category | Recent Price | Smart Investing & Trading Score | Change % | YTD Change% |
| KURA | Kura Oncology |   | Biotechnology | 21.47 | 58 | -0.97% | 49.30% |
| UHS | Universal Health | | Hospitals | 186.34 | 58 | -0.48% | 22.23% |
| HRTX | Heron | | Biotechnology | 3.65 | 58 | -0.27% | 114.71% |
| ALVO | Alvotech | | Drug Manufacturers - Specialty & Generic | 14.21 | 58 | -0.04% | 25.04% |
| PYPD | PolyPid | | Biotechnology | 4.47 | 57 | 8.76% | 21.80% |
| ANNX | Annexon | | Biotechnology | 6.13 | 57 | 1.49% | 34.43% |
| LBPH | Longboard | | Biotechnology | 19.18 | 57 | 0.89% | 213.91% |
| KROS | Keros | | Biotechnology | 49.34 | 57 | 0.75% | 23.86% |
| PACB | Pacific Biosciences | | Biotechnology | 1.92 | 57 | -3.03% | -80.43% |
| AKBA | Akebia | | Biotechnology | 1.13 | 57 | -3.02% | -9.27% |
| CMAX | CareMax | | Health Information | 3.22 | 57 | -2.42% | 563.92% |
| KRON | Kronos Bio | | Biotechnology | 1.06 | 57 | -16.80% | -14.80% |
| AHCO | AdaptHealth | | Equipment | 11.31 | 57 | -1.82% | 55.14% |
| DH | Definitive | | Health Information | 5.91 | 57 | -1.67% | -41.36% |
| CERE | Cerevel | | Biotechnology | 41.49 | 57 | 1.08% | -2.11% |
| IMMP | Immutep | | Biotechnology | 2.70 | 56 | 5.47% | 12.50% |
| VERO | Venus Concept | | Equipment | 0.90 | 56 | 0.00% | -23.73% |
| BGXX | Bright Green | | Drug Manufacturers - Specialty & Generic | 0.28 | 56 | -4.42% | -16.31% |
| AVAH | Aveanna | | Medical Care Facilities | 2.54 | 56 | -0.78% | -5.75% |
| OLMA | Olema | | Biotechnology | 12.82 | 56 | -0.39% | -8.82% |
| IKNA | Ikena Oncology | | Biotechnology | 1.75 | 56 | -0.29% | -12.75% |
| ALHC | Alignment | | Healthcare Plans | 8.09 | 56 | -0.19% | -8.59% |
| HOOK | HOOKIPA Pharma | | Biotechnology | 0.79 | 56 | 0.91% | -2.46% |
| PTCT | PTC | | Biotechnology | 36.95 | 56 | -1.90% | 34.09% |
| NBIX | Neurocrine Biosciences | | Biotechnology | 137.54 | 55 | 2.17% | 4.39% |
| For chart view version of above stock list: Chart View ➞ 0 - 25 , 25 - 50 , 50 - 75 , 75 - 100 , 100 - 125 , 125 - 150 , 150 - 175 , 175 - 200 , 200 - 225 , 225 - 250 , 250 - 275 , 275 - 300 , 300 - 325 , 325 - 350 , 350 - 375 , 375 - 400 , 400 - 425 , 425 - 450 , 450 - 475 , 475 - 500 , 500 - 525 , 525 - 550 , 550 - 575 , 575 - 600 , 600 - 625 , 625 - 650 | ||
 | Click To Change The Sort Order: By Market Cap or Company Size Performance: Year-to-date, Week and Day |  |
|
Get the most comprehensive stock market coverage daily at 12Stocks.com ➞ Best Stocks Today ➞ Best Stocks Weekly ➞ Best Stocks Year-to-Date ➞ Best Stocks Trends ➞  Best Stocks Today 12Stocks.com Best Nasdaq Stocks ➞ Best S&P 500 Stocks ➞ Best Tech Stocks ➞ Best Biotech Stocks ➞ |
| Detailed Overview of Healthcare Stocks |
| Healthcare Technical Overview, Leaders & Laggards, Top Healthcare ETF Funds & Detailed Healthcare Stocks List, Charts, Trends & More |
| Healthcare Sector: Technical Analysis, Trends & YTD Performance | |
| Healthcare sector is composed of stocks
from pharmaceutical, biotech, diagnostics labs, insurance providers
and healthcare services. Healthcare sector, as represented by XLV, an exchange-traded fund [ETF] that holds basket of Healthcare stocks (e.g, Merck, Amgen) is up by 6.36% and is currently underperforming the overall market by -5.85% year-to-date. Below is a quick view of Technical charts and trends: |
|
 XLV Weekly Chart |
|
| Long Term Trend: Deteriorating | |
| Medium Term Trend: Very Good | |
 XLV Daily Chart |
|
| Short Term Trend: Not Good | |
| Overall Trend Score: 30 | |
| YTD Performance: 6.36% | |
| **Trend Scores & Views Are Only For Educational Purposes And Not For Investing | |
| 12Stocks.com: Top Performing Healthcare Sector Stocks | ||||||||||||||||||||||||||||||||||||||||||||||||
 The top performing Healthcare sector stocks year to date are
Now, more recently, over last week, the top performing Healthcare sector stocks on the move are


|
||||||||||||||||||||||||||||||||||||||||||||||||
| 12Stocks.com: Investing in Healthcare Sector using Exchange Traded Funds | |
|
The following table shows list of key exchange traded funds (ETF) that
help investors track Healthcare Index. For detailed view, check out our ETF Funds section of our website. Quick View: Move mouse or cursor over ETF symbol (ticker) to view short-term Technical chart and over ETF name to view long term chart. Click on ticker or stock name for detailed view. Click on to add stock symbol to your watchlist and to view watchlist. |
12Stocks.com List of ETFs that track Healthcare Index
| Ticker | ETF Name | Watchlist | Recent Price | Smart Investing & Trading Score | Change % | Week % | Year-to-date % |
| XLV | Health Care | | 145.06 | 30 | -0.68 | -0.94 | 6.36% |
| IBB | Biotechnology | | 137.48 | 63 | -0.24 | 0.56 | 1.2% |
| BBH | Biotech | | 167.21 | 50 | -0.56 | -0.59 | 1.15% |
| IHF | Healthcare Providers | | 51.86 | 0 | -0.99 | -1.03 | -1.24% |
| XHE | Health Care Equipment | | 85.40 | 28 | -0.62 | -0.15 | 1.35% |
| PSCH | SmallCap Health Care | | 42.86 | 43 | -0.05 | 0.07 | 0.14% |
| XHS | Health Care Services | | 92.35 | 57 | -0.70 | 0.49 | 3.82% |
| PTH | DWA Healthcare Momentum | | 43.49 | 87 | -0.11 | 3.3 | 11.11% |
| BTEC | Principal Healthcare Innovators | | 37.01 | 57 | -1.23 | 1.78 | 1.87% |
| RXL | Health Care | | 102.19 | 50 | 0.17 | -0.41 | 11.8% |
| RXD | Short Health Care | | 10.85 | 81 | 2.19 | 2.49 | -9.02% |
| 12Stocks.com: Charts, Trends, Fundamental Data and Performances of Healthcare Stocks | |
|
We now take in-depth look at all Healthcare stocks including charts, multi-period performances and overall trends (as measured by Smart Investing & Trading Score). One can sort Healthcare stocks (click link to choose) by Daily, Weekly and by Year-to-Date performances. Also, one can sort by size of the company or by market capitalization. |
| Select Your Default Chart Type: | |||||
| |||||
| Click on stock symbol or name for detailed view. Click on to add stock symbol to your watchlist and to view watchlist. Quick View: Move mouse or cursor over "Daily" to quickly view daily Technical stock chart and over "Weekly" to view weekly Technical stock chart. | |||||

 | KURA Kura Oncology, Inc. |
| Sector: Health Care | |
| SubSector: Biotechnology | |
| MarketCap: 401.885 Millions | |
| Recent Price: 21.47 Smart Investing & Trading Score: 58 | |
| Day Percent Change: -0.97% Day Change: -0.21 | |
| Week Change: -1.33% Year-to-date Change: 49.3% | |
| KURA Links: Profile News Message Board | |
| Charts:- Daily , Weekly | |
| Add KURA to Watchlist: View: Get Complete KURA Trend Analysis ➞ | |
 | UHS Universal Health Services, Inc. |
| Sector: Health Care | |
| SubSector: Hospitals | |
| MarketCap: 7217.66 Millions | |
| Recent Price: 186.34 Smart Investing & Trading Score: 58 | |
| Day Percent Change: -0.48% Day Change: -0.91 | |
| Week Change: -0.64% Year-to-date Change: 22.2% | |
| UHS Links: Profile News Message Board | |
| Charts:- Daily , Weekly | |
| Add UHS to Watchlist: View: Get Complete UHS Trend Analysis ➞ | |
 | HRTX Heron Therapeutics, Inc. |
| Sector: Health Care | |
| SubSector: Biotechnology | |
| MarketCap: 1172.75 Millions | |
| Recent Price: 3.65 Smart Investing & Trading Score: 58 | |
| Day Percent Change: -0.27% Day Change: -0.01 | |
| Week Change: 1.39% Year-to-date Change: 114.7% | |
| HRTX Links: Profile News Message Board | |
| Charts:- Daily , Weekly | |
| Add HRTX to Watchlist: View: Get Complete HRTX Trend Analysis ➞ | |
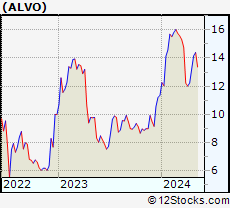 | ALVO Alvotech |
| Sector: Health Care | |
| SubSector: Drug Manufacturers - Specialty & Generic | |
| MarketCap: 2160 Millions | |
| Recent Price: 14.21 Smart Investing & Trading Score: 58 | |
| Day Percent Change: -0.04% Day Change: -0.01 | |
| Week Change: 1.18% Year-to-date Change: 25.0% | |
| ALVO Links: Profile News Message Board | |
| Charts:- Daily , Weekly | |
| Add ALVO to Watchlist: View: Get Complete ALVO Trend Analysis ➞ | |
 | PYPD PolyPid Ltd. |
| Sector: Health Care | |
| SubSector: Biotechnology | |
| MarketCap: 20487 Millions | |
| Recent Price: 4.47 Smart Investing & Trading Score: 57 | |
| Day Percent Change: 8.76% Day Change: 0.36 | |
| Week Change: 2.52% Year-to-date Change: 21.8% | |
| PYPD Links: Profile News Message Board | |
| Charts:- Daily , Weekly | |
| Add PYPD to Watchlist: View: Get Complete PYPD Trend Analysis ➞ | |
 | ANNX Annexon, Inc. |
| Sector: Health Care | |
| SubSector: Biotechnology | |
| MarketCap: 94487 Millions | |
| Recent Price: 6.13 Smart Investing & Trading Score: 57 | |
| Day Percent Change: 1.49% Day Change: 0.09 | |
| Week Change: 6.79% Year-to-date Change: 34.4% | |
| ANNX Links: Profile News Message Board | |
| Charts:- Daily , Weekly | |
| Add ANNX to Watchlist: View: Get Complete ANNX Trend Analysis ➞ | |
 | LBPH Longboard Pharmaceuticals, Inc. |
| Sector: Health Care | |
| SubSector: Biotechnology | |
| MarketCap: 169 Millions | |
| Recent Price: 19.18 Smart Investing & Trading Score: 57 | |
| Day Percent Change: 0.89% Day Change: 0.17 | |
| Week Change: 9.29% Year-to-date Change: 213.9% | |
| LBPH Links: Profile News Message Board | |
| Charts:- Daily , Weekly | |
| Add LBPH to Watchlist: View: Get Complete LBPH Trend Analysis ➞ | |
 | KROS Keros Therapeutics, Inc. |
| Sector: Health Care | |
| SubSector: Biotechnology | |
| MarketCap: 17887 Millions | |
| Recent Price: 49.34 Smart Investing & Trading Score: 57 | |
| Day Percent Change: 0.75% Day Change: 0.37 | |
| Week Change: 1.35% Year-to-date Change: 23.9% | |
| KROS Links: Profile News Message Board | |
| Charts:- Daily , Weekly | |
| Add KROS to Watchlist: View: Get Complete KROS Trend Analysis ➞ | |
 | PACB Pacific Biosciences of California, Inc. |
| Sector: Health Care | |
| SubSector: Biotechnology | |
| MarketCap: 470.685 Millions | |
| Recent Price: 1.92 Smart Investing & Trading Score: 57 | |
| Day Percent Change: -3.03% Day Change: -0.06 | |
| Week Change: -4.48% Year-to-date Change: -80.4% | |
| PACB Links: Profile News Message Board | |
| Charts:- Daily , Weekly | |
| Add PACB to Watchlist: View: Get Complete PACB Trend Analysis ➞ | |
 | AKBA Akebia Therapeutics, Inc. |
| Sector: Health Care | |
| SubSector: Biotechnology | |
| MarketCap: 794.285 Millions | |
| Recent Price: 1.13 Smart Investing & Trading Score: 57 | |
| Day Percent Change: -3.02% Day Change: -0.03 | |
| Week Change: 6.13% Year-to-date Change: -9.3% | |
| AKBA Links: Profile News Message Board | |
| Charts:- Daily , Weekly | |
| Add AKBA to Watchlist: View: Get Complete AKBA Trend Analysis ➞ | |
 | CMAX CareMax, Inc. |
| Sector: Health Care | |
| SubSector: Health Information Services | |
| MarketCap: 371 Millions | |
| Recent Price: 3.22 Smart Investing & Trading Score: 57 | |
| Day Percent Change: -2.42% Day Change: -0.08 | |
| Week Change: 21.05% Year-to-date Change: 563.9% | |
| CMAX Links: Profile News Message Board | |
| Charts:- Daily , Weekly | |
| Add CMAX to Watchlist: View: Get Complete CMAX Trend Analysis ➞ | |
 | KRON Kronos Bio, Inc. |
| Sector: Health Care | |
| SubSector: Biotechnology | |
| MarketCap: 17287 Millions | |
| Recent Price: 1.06 Smart Investing & Trading Score: 57 | |
| Day Percent Change: -16.80% Day Change: -0.22 | |
| Week Change: 43.43% Year-to-date Change: -14.8% | |
| KRON Links: Profile News Message Board | |
| Charts:- Daily , Weekly | |
| Add KRON to Watchlist: View: Get Complete KRON Trend Analysis ➞ | |
 | AHCO AdaptHealth Corp. |
| Sector: Health Care | |
| SubSector: Medical Appliances & Equipment | |
| MarketCap: 1084.8 Millions | |
| Recent Price: 11.31 Smart Investing & Trading Score: 57 | |
| Day Percent Change: -1.82% Day Change: -0.21 | |
| Week Change: 0.98% Year-to-date Change: 55.1% | |
| AHCO Links: Profile News Message Board | |
| Charts:- Daily , Weekly | |
| Add AHCO to Watchlist: View: Get Complete AHCO Trend Analysis ➞ | |
 | DH Definitive Healthcare Corp. |
| Sector: Health Care | |
| SubSector: Health Information Services | |
| MarketCap: 1690 Millions | |
| Recent Price: 5.91 Smart Investing & Trading Score: 57 | |
| Day Percent Change: -1.67% Day Change: -0.10 | |
| Week Change: 5.64% Year-to-date Change: -41.4% | |
| DH Links: Profile News Message Board | |
| Charts:- Daily , Weekly | |
| Add DH to Watchlist: View: Get Complete DH Trend Analysis ➞ | |
 | CERE Cerevel Therapeutics Holdings, Inc. |
| Sector: Health Care | |
| SubSector: Biotechnology | |
| MarketCap: 21587 Millions | |
| Recent Price: 41.49 Smart Investing & Trading Score: 57 | |
| Day Percent Change: 1.08% Day Change: 0.45 | |
| Week Change: 3.69% Year-to-date Change: -2.1% | |
| CERE Links: Profile News Message Board | |
| Charts:- Daily , Weekly | |
| Add CERE to Watchlist: View: Get Complete CERE Trend Analysis ➞ | |
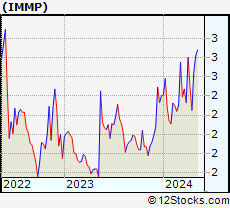 | IMMP Immutep Limited |
| Sector: Health Care | |
| SubSector: Biotechnology | |
| MarketCap: 71.5785 Millions | |
| Recent Price: 2.70 Smart Investing & Trading Score: 56 | |
| Day Percent Change: 5.47% Day Change: 0.14 | |
| Week Change: 1.12% Year-to-date Change: 12.5% | |
| IMMP Links: Profile News Message Board | |
| Charts:- Daily , Weekly | |
| Add IMMP to Watchlist: View: Get Complete IMMP Trend Analysis ➞ | |
 | VERO Venus Concept Inc. |
| Sector: Health Care | |
| SubSector: Medical Appliances & Equipment | |
| MarketCap: 101.08 Millions | |
| Recent Price: 0.90 Smart Investing & Trading Score: 56 | |
| Day Percent Change: 0.00% Day Change: 0.00 | |
| Week Change: -3.23% Year-to-date Change: -23.7% | |
| VERO Links: Profile News Message Board | |
| Charts:- Daily , Weekly | |
| Add VERO to Watchlist: View: Get Complete VERO Trend Analysis ➞ | |
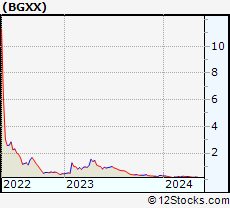 | BGXX Bright Green Corporation |
| Sector: Health Care | |
| SubSector: Drug Manufacturers - Specialty & Generic | |
| MarketCap: 172 Millions | |
| Recent Price: 0.28 Smart Investing & Trading Score: 56 | |
| Day Percent Change: -4.42% Day Change: -0.01 | |
| Week Change: 0.18% Year-to-date Change: -16.3% | |
| BGXX Links: Profile News Message Board | |
| Charts:- Daily , Weekly | |
| Add BGXX to Watchlist: View: Get Complete BGXX Trend Analysis ➞ | |
 | AVAH Aveanna Healthcare Holdings Inc. |
| Sector: Health Care | |
| SubSector: Medical Care Facilities | |
| MarketCap: 305 Millions | |
| Recent Price: 2.54 Smart Investing & Trading Score: 56 | |
| Day Percent Change: -0.78% Day Change: -0.02 | |
| Week Change: 2.01% Year-to-date Change: -5.8% | |
| AVAH Links: Profile News Message Board | |
| Charts:- Daily , Weekly | |
| Add AVAH to Watchlist: View: Get Complete AVAH Trend Analysis ➞ | |
 | OLMA Olema Pharmaceuticals, Inc. |
| Sector: Health Care | |
| SubSector: Biotechnology | |
| MarketCap: 17687 Millions | |
| Recent Price: 12.82 Smart Investing & Trading Score: 56 | |
| Day Percent Change: -0.39% Day Change: -0.05 | |
| Week Change: -2.36% Year-to-date Change: -8.8% | |
| OLMA Links: Profile News Message Board | |
| Charts:- Daily , Weekly | |
| Add OLMA to Watchlist: View: Get Complete OLMA Trend Analysis ➞ | |
 | IKNA Ikena Oncology, Inc. |
| Sector: Health Care | |
| SubSector: Biotechnology | |
| MarketCap: 277 Millions | |
| Recent Price: 1.75 Smart Investing & Trading Score: 56 | |
| Day Percent Change: -0.29% Day Change: 0.00 | |
| Week Change: -0.29% Year-to-date Change: -12.8% | |
| IKNA Links: Profile News Message Board | |
| Charts:- Daily , Weekly | |
| Add IKNA to Watchlist: View: Get Complete IKNA Trend Analysis ➞ | |
 | ALHC Alignment Healthcare, Inc. |
| Sector: Health Care | |
| SubSector: Healthcare Plans | |
| MarketCap: 1100 Millions | |
| Recent Price: 8.09 Smart Investing & Trading Score: 56 | |
| Day Percent Change: -0.19% Day Change: -0.02 | |
| Week Change: -3% Year-to-date Change: -8.6% | |
| ALHC Links: Profile News Message Board | |
| Charts:- Daily , Weekly | |
| Add ALHC to Watchlist: View: Get Complete ALHC Trend Analysis ➞ | |
 | HOOK HOOKIPA Pharma Inc. |
| Sector: Health Care | |
| SubSector: Biotechnology | |
| MarketCap: 294.785 Millions | |
| Recent Price: 0.79 Smart Investing & Trading Score: 56 | |
| Day Percent Change: 0.91% Day Change: 0.01 | |
| Week Change: -3.53% Year-to-date Change: -2.5% | |
| HOOK Links: Profile News Message Board | |
| Charts:- Daily , Weekly | |
| Add HOOK to Watchlist: View: Get Complete HOOK Trend Analysis ➞ | |
 | PTCT PTC Therapeutics, Inc. |
| Sector: Health Care | |
| SubSector: Biotechnology | |
| MarketCap: 2795.85 Millions | |
| Recent Price: 36.95 Smart Investing & Trading Score: 56 | |
| Day Percent Change: -1.90% Day Change: -0.72 | |
| Week Change: 1.19% Year-to-date Change: 34.1% | |
| PTCT Links: Profile News Message Board | |
| Charts:- Daily , Weekly | |
| Add PTCT to Watchlist: View: Get Complete PTCT Trend Analysis ➞ | |
 | NBIX Neurocrine Biosciences, Inc. |
| Sector: Health Care | |
| SubSector: Biotechnology | |
| MarketCap: 7897.85 Millions | |
| Recent Price: 137.54 Smart Investing & Trading Score: 55 | |
| Day Percent Change: 2.17% Day Change: 2.92 | |
| Week Change: 1.9% Year-to-date Change: 4.4% | |
| NBIX Links: Profile News Message Board | |
| Charts:- Daily , Weekly | |
| Add NBIX to Watchlist: View: Get Complete NBIX Trend Analysis ➞ | |
| For tabular summary view of above stock list: Summary View ➞ 0 - 25 , 25 - 50 , 50 - 75 , 75 - 100 , 100 - 125 , 125 - 150 , 150 - 175 , 175 - 200 , 200 - 225 , 225 - 250 , 250 - 275 , 275 - 300 , 300 - 325 , 325 - 350 , 350 - 375 , 375 - 400 , 400 - 425 , 425 - 450 , 450 - 475 , 475 - 500 , 500 - 525 , 525 - 550 , 550 - 575 , 575 - 600 , 600 - 625 , 625 - 650 | ||
| Click To Change The Sort Order: By Market Cap or Company Size Performance: Year-to-date, Week and Day | |
| Select Chart Type: | ||
|
Best Stocks Today 12Stocks.com |
© 2024 12Stocks.com Terms & Conditions Privacy Contact Us
All Information Provided Only For Education And Not To Be Used For Investing or Trading. See Terms & Conditions


One More Thing ... Get Best Stocks Delivered Daily!
Never Ever Miss A Move With Our Top Ten Stocks Lists
Find Best Stocks In Any Market - Bull or Bear Market
Take A Peek At Our Top Ten Stocks Lists: Daily, Weekly, Year-to-Date & Top Trends
Find Best Stocks In Any Market - Bull or Bear Market
Take A Peek At Our Top Ten Stocks Lists: Daily, Weekly, Year-to-Date & Top Trends
Healthcare Stocks With Best Up Trends [0-bearish to 100-bullish]: Vicarious Surgical[100], Monopar [100], Molecular Partners[100], Vanda [100], Replimune [100], Avidity Biosciences[100], Corbus [100], Krystal Biotech[100], Protagonist [100], yte [100], Alnylam [100]
Best Healthcare Stocks Year-to-Date:
Precision BioSciences[3119.18%], Vicarious Surgical[2141%], Avenue [2064.6%], Agenus [1881.52%], Assembly Biosciences[1791.23%], Inovio [1758.82%], Aurora Cannabis[1154.72%], Adverum Biotechnologies[925.5%], NuCana [924.34%], GeneDx [897.06%], Corbus [786.67%] Best Healthcare Stocks This Week:
Vicarious Surgical[2353.73%], Avidity Biosciences[50.86%], Molecular Partners[44.23%], Kronos Bio[43.43%], Scilex Holding[35.78%], Biomea Fusion[34.54%], Monopar [30.7%], vTv [24.44%], Dermira [22.55%], Arcutis Bio[21.48%], Corbus [21.36%] Best Healthcare Stocks Daily:
Vicarious Surgical[2733.51%], Biomea Fusion[20.43%], Monopar [18.45%], Molecular Partners[17.64%], Vanda [12.67%], PolyPid [8.76%], Tango [8.73%], Solid Biosciences[8.64%], Arcutis Bio[8.58%], Replimune [8.16%], Cue Biopharma[7.67%]