
 Login Sign Up


| |||||
 |  | ||||

| 12Stocks.com Market Intelligence |
Best Financial Stocks
| In a hurry? Financial Stocks Lists: Performance Trends Table, Stock Charts
Sort Financial stocks: Daily, Weekly, Year-to-Date, Market Cap & Trends. Filter Financial stocks list by size:All Financial Large Mid-Range Small & MicroCap |
| 12Stocks.com Financial Stocks Performances & Trends Daily | |||||||||
|
|  The overall Smart Investing & Trading Score is 95 (0-bearish to 100-bullish) which puts Financial sector in short term bullish trend. The Smart Investing & Trading Score from previous trading session is 85 and hence an improvement of trend.
| ||||||||
Here are the Smart Investing & Trading Scores of the most requested Financial stocks at 12Stocks.com (click stock name for detailed review):
|


| 12Stocks.com: Investing in Financial sector with Stocks | |
|
The following table helps investors and traders sort through current performance and trends (as measured by Smart Investing & Trading Score) of various
stocks in the Financial sector. Quick View: Move mouse or cursor over stock symbol (ticker) to view short-term Technical chart and over stock name to view long term chart. Click on  to add stock symbol to your watchlist and to add stock symbol to your watchlist and  to view watchlist. Click on any ticker or stock name for detailed market intelligence report for that stock. to view watchlist. Click on any ticker or stock name for detailed market intelligence report for that stock. |
12Stocks.com Performance of Stocks in Financial Sector
| Ticker | Stock Name | Watchlist | Category | Recent Price | Trend Score | Change % | YTD Change% |
| FHN | First Horizon |   | Regional Banks | 15.67 | 68 | -0.19% | 10.66% |
| NWLI | National Western | | Life Insurance | 489.55 | 68 | -0.05% | 1.35% |
| RRAC | Rigel Resource | | SPAC | 11.26 | 68 | -0.04% | 2.46% |
| MBINM | Merchants Bancorp | | Banks - Regional | 26.02 | 68 | -0.02% | 5.41% |
| C | Citi | | Banks | 62.00 | 68 | -1.29% | 20.53% |
| SLM | SLM | | Credit Services | 21.63 | 68 | -0.23% | 13.13% |
| NREF | NexPoint Real | | REIT | 13.37 | 67 | 1.21% | -15.03% |
| INN | Summit Hotel | | Real Estatet | 6.27 | 67 | 1.13% | -6.70% |
| WU | Western Union | | Credit Services | 13.43 | 67 | 0.90% | 12.67% |
| USA | Liberty All-Star | | Closed-End Fund - Equity | 6.80 | 67 | 0.44% | 6.58% |
| BSBK | Bogota | | Banks Regional | 6.61 | 67 | 0.15% | -17.79% |
| AUBN | Auburn National | | Regional Banks | 18.73 | 67 | -1.52% | -11.98% |
| LANDO | Gladstone Land | | REIT Industrial | 19.56 | 67 | -0.46% | 1.35% |
| IX | ORIX | | Credit Services | 105.07 | 67 | -0.27% | 12.51% |
| CUBE | CubeSmart | | REIT - Industrial | 42.27 | 67 | 1.00% | -8.80% |
| NEN | New England | | Real Estatet | 70.00 | 67 | -0.33% | 0.43% |
| NWBI | Northwest Bancshares | | S&L | 11.08 | 67 | -0.27% | -11.22% |
| WSBC | WesBanco | | Regional Banks | 28.23 | 67 | -0.21% | -10.01% |
| AKR | Acadia Realty | | Property Mgmt | 17.15 | 66 | 1.54% | 0.94% |
| SIXH | 6 Meridian | | Exchange Traded Fund | 35.68 | 66 | 0.62% | 7.15% |
| SCHW | Charles Schwab | | Brokerage | 75.54 | 66 | -1.72% | 9.80% |
| LADR | Ladder Capital | | Mortgage | 11.01 | 66 | -1.26% | -4.34% |
| NNI | Nelnet | | Credit Services | 96.32 | 66 | -1.25% | 9.18% |
| AMAL | Amalgamated Bank | | Regional Banks | 25.15 | 66 | -1.02% | -6.64% |
| SOR | Source Capital | | Closed-End Fund - Equity | 41.87 | 66 | -0.22% | 3.69% |
| For chart view version of above stock list: Chart View ➞ 0 - 25 , 25 - 50 , 50 - 75 , 75 - 100 , 100 - 125 , 125 - 150 , 150 - 175 , 175 - 200 , 200 - 225 , 225 - 250 , 250 - 275 , 275 - 300 , 300 - 325 , 325 - 350 , 350 - 375 , 375 - 400 , 400 - 425 , 425 - 450 , 450 - 475 , 475 - 500 , 500 - 525 , 525 - 550 , 550 - 575 , 575 - 600 , 600 - 625 , 625 - 650 , 650 - 675 , 675 - 700 , 700 - 725 , 725 - 750 , 750 - 775 , 775 - 800 , 800 - 825 , 825 - 850 , 850 - 875 , 875 - 900 , 900 - 925 , 925 - 950 , 950 - 975 , 975 - 1000 , 1000 - 1025 , 1025 - 1050 , 1050 - 1075 , 1075 - 1100 , 1100 - 1125 , 1125 - 1150 , 1150 - 1175 , 1175 - 1200 , 1200 - 1225 | ||
 | Click To Change The Sort Order: By Market Cap or Company Size Performance: Year-to-date, Week and Day |  |
|
Get the most comprehensive stock market coverage daily at 12Stocks.com ➞ Best Stocks Today ➞ Best Stocks Weekly ➞ Best Stocks Year-to-Date ➞ Best Stocks Trends ➞  Best Stocks Today 12Stocks.com Best Nasdaq Stocks ➞ Best S&P 500 Stocks ➞ Best Tech Stocks ➞ Best Biotech Stocks ➞ |
| Detailed Overview of Financial Stocks |
| Financial Technical Overview, Leaders & Laggards, Top Financial ETF Funds & Detailed Financial Stocks List, Charts, Trends & More |
| Financial Sector: Technical Analysis, Trends & YTD Performance | |
| Financial sector is composed of stocks
from banks, brokers, insurance, REITs
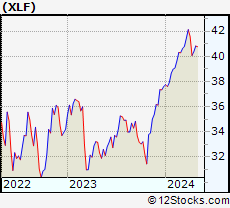
and services subsectors. Financial sector, as represented by XLF, an exchange-traded fund [ETF] that holds basket of Financial stocks (e.g, Bank of America, Goldman Sachs) is up by 9.6% and is currently outperforming the overall market by 1.48% year-to-date. Below is a quick view of Technical charts and trends: |
|
 XLF Weekly Chart |
|
| Long Term Trend: Good | |
| Medium Term Trend: Good | |
 XLF Daily Chart |
|
| Short Term Trend: Very Good | |
| Overall Trend Score: 95 | |
| YTD Performance: 9.6% | |
| **Trend Scores & Views Are Only For Educational Purposes And Not For Investing | |
| 12Stocks.com: Top Performing Financial Sector Stocks | ||||||||||||||||||||||||||||||||||||||||||||||||
 The top performing Financial sector stocks year to date are
Now, more recently, over last week, the top performing Financial sector stocks on the move are


|
||||||||||||||||||||||||||||||||||||||||||||||||
| 12Stocks.com: Investing in Financial Sector using Exchange Traded Funds | |
|
The following table shows list of key exchange traded funds (ETF) that
help investors track Financial Index. For detailed view, check out our ETF Funds section of our website. Quick View: Move mouse or cursor over ETF symbol (ticker) to view short-term Technical chart and over ETF name to view long term chart. Click on ticker or stock name for detailed view. Click on to add stock symbol to your watchlist and to view watchlist. |
12Stocks.com List of ETFs that track Financial Index
| Ticker | ETF Name | Watchlist | Recent Price | Smart Investing & Trading Score | Change % | Week % | Year-to-date % |
| XLF | Financial | | 41.21 | 95 | 0.34 | 1.63 | 9.6% |
| IAI | Broker-Dealers & Secs | | 115.55 | 100 | -0.16 | 1.12 | 6.47% |
| IYF | Financials | | 93.74 | 90 | 0.14 | 1.37 | 9.75% |
| IYG | Financial Services | | 65.00 | 95 | 0.26 | 1.42 | 8.81% |
| KRE | Regional Banking | | 49.88 | 95 | -0.32 | 0.46 | -4.86% |
| IXG | Global Financials | | 86.17 | 95 | 0.84 | 1.57 | 9.66% |
| VFH | Financials | | 100.09 | 95 | 0.24 | 1.41 | 8.49% |
| KBE | Bank | | 46.82 | 100 | -0.15 | 0.93 | 1.74% |
| FAS | Financial Bull 3X | | 103.26 | 95 | 1.02 | 4.48 | 24.94% |
| FAZ | Financial Bear 3X | | 10.61 | 5 | -0.93 | -4.24 | -22.38% |
| UYG | Financials | | 64.72 | 95 | 0.72 | 3.07 | 17.25% |
| IAT | Regional Banks | | 42.49 | 95 | -0.42 | 0.47 | 1.55% |
| KIE | Insurance | | 50.71 | 95 | 0.66 | 2.49 | 12.14% |
| PSCF | SmallCap Financials | | 47.85 | 100 | 0.48 | 1.21 | -2.7% |
| EUFN | Europe Financials | | 23.25 | 100 | 1.13 | 2.67 | 10.93% |
| PGF | Financial Preferred | | 14.81 | 57 | -0.34 | -0.27 | 1.58% |
| 12Stocks.com: Charts, Trends, Fundamental Data and Performances of Financial Stocks | |
|
We now take in-depth look at all Financial stocks including charts, multi-period performances and overall trends (as measured by Smart Investing & Trading Score). One can sort Financial stocks (click link to choose) by Daily, Weekly and by Year-to-Date performances. Also, one can sort by size of the company or by market capitalization. |
| Select Your Default Chart Type: | |||||
| |||||
| Click on stock symbol or name for detailed view. Click on to add stock symbol to your watchlist and to view watchlist. Quick View: Move mouse or cursor over "Daily" to quickly view daily Technical stock chart and over "Weekly" to view weekly Technical stock chart. | |||||

 | FHN First Horizon National Corporation |
| Sector: Financials | |
| SubSector: Regional - Southeast Banks | |
| MarketCap: 2661.05 Millions | |
| Recent Price: 15.67 Smart Investing & Trading Score: 68 | |
| Day Percent Change: -0.19% Day Change: -0.03 | |
| Week Change: -0.82% Year-to-date Change: 10.7% | |
| FHN Links: Profile News Message Board | |
| Charts:- Daily , Weekly | |
| Add FHN to Watchlist: View: Get Complete FHN Trend Analysis ➞ | |
 | NWLI National Western Life Group, Inc. |
| Sector: Financials | |
| SubSector: Life Insurance | |
| MarketCap: 529 Millions | |
| Recent Price: 489.55 Smart Investing & Trading Score: 68 | |
| Day Percent Change: -0.05% Day Change: -0.25 | |
| Week Change: 0.22% Year-to-date Change: 1.4% | |
| NWLI Links: Profile News Message Board | |
| Charts:- Daily , Weekly | |
| Add NWLI to Watchlist: View: Get Complete NWLI Trend Analysis ➞ | |
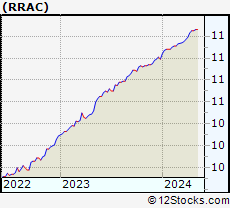 | RRAC Rigel Resource Acquisition Corp. |
| Sector: Financials | |
| SubSector: SPAC | |
| MarketCap: 402 Millions | |
| Recent Price: 11.26 Smart Investing & Trading Score: 68 | |
| Day Percent Change: -0.04% Day Change: -0.01 | |
| Week Change: 0% Year-to-date Change: 2.5% | |
| RRAC Links: Profile News Message Board | |
| Charts:- Daily , Weekly | |
| Add RRAC to Watchlist: View: Get Complete RRAC Trend Analysis ➞ | |
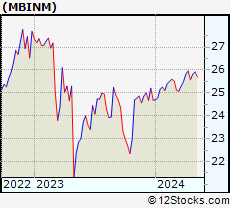 | MBINM Merchants Bancorp |
| Sector: Financials | |
| SubSector: Banks - Regional | |
| MarketCap: 1110 Millions | |
| Recent Price: 26.02 Smart Investing & Trading Score: 68 | |
| Day Percent Change: -0.02% Day Change: -0.01 | |
| Week Change: 0.41% Year-to-date Change: 5.4% | |
| MBINM Links: Profile News Message Board | |
| Charts:- Daily , Weekly | |
| Add MBINM to Watchlist: View: Get Complete MBINM Trend Analysis ➞ | |
 | C Citigroup Inc. |
| Sector: Financials | |
| SubSector: Money Center Banks | |
| MarketCap: 94128 Millions | |
| Recent Price: 62.00 Smart Investing & Trading Score: 68 | |
| Day Percent Change: -1.29% Day Change: -0.81 | |
| Week Change: 0.78% Year-to-date Change: 20.5% | |
| C Links: Profile News Message Board | |
| Charts:- Daily , Weekly | |
| Add C to Watchlist: View: Get Complete C Trend Analysis ➞ | |
 | SLM SLM Corporation |
| Sector: Financials | |
| SubSector: Credit Services | |
| MarketCap: 3099.78 Millions | |
| Recent Price: 21.63 Smart Investing & Trading Score: 68 | |
| Day Percent Change: -0.23% Day Change: -0.05 | |
| Week Change: -1.73% Year-to-date Change: 13.1% | |
| SLM Links: Profile News Message Board | |
| Charts:- Daily , Weekly | |
| Add SLM to Watchlist: View: Get Complete SLM Trend Analysis ➞ | |
 | NREF NexPoint Real Estate Finance, Inc. |
| Sector: Financials | |
| SubSector: REIT Diversified | |
| MarketCap: 97267 Millions | |
| Recent Price: 13.37 Smart Investing & Trading Score: 67 | |
| Day Percent Change: 1.21% Day Change: 0.16 | |
| Week Change: 1.21% Year-to-date Change: -15.0% | |
| NREF Links: Profile News Message Board | |
| Charts:- Daily , Weekly | |
| Add NREF to Watchlist: View: Get Complete NREF Trend Analysis ➞ | |
 | INN Summit Hotel Properties, Inc. |
| Sector: Financials | |
| SubSector: Real Estate Development | |
| MarketCap: 402.019 Millions | |
| Recent Price: 6.27 Smart Investing & Trading Score: 67 | |
| Day Percent Change: 1.13% Day Change: 0.07 | |
| Week Change: 0.32% Year-to-date Change: -6.7% | |
| INN Links: Profile News Message Board | |
| Charts:- Daily , Weekly | |
| Add INN to Watchlist: View: Get Complete INN Trend Analysis ➞ | |
 | WU The Western Union Company |
| Sector: Financials | |
| SubSector: Credit Services | |
| MarketCap: 7974.48 Millions | |
| Recent Price: 13.43 Smart Investing & Trading Score: 67 | |
| Day Percent Change: 0.90% Day Change: 0.12 | |
| Week Change: 0.45% Year-to-date Change: 12.7% | |
| WU Links: Profile News Message Board | |
| Charts:- Daily , Weekly | |
| Add WU to Watchlist: View: Get Complete WU Trend Analysis ➞ | |
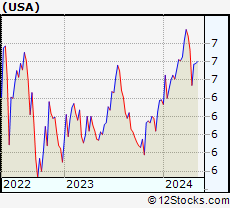 | USA Liberty All-Star Equity Fund |
| Sector: Financials | |
| SubSector: Closed-End Fund - Equity | |
| MarketCap: 839.547 Millions | |
| Recent Price: 6.80 Smart Investing & Trading Score: 67 | |
| Day Percent Change: 0.44% Day Change: 0.03 | |
| Week Change: 0.29% Year-to-date Change: 6.6% | |
| USA Links: Profile News Message Board | |
| Charts:- Daily , Weekly | |
| Add USA to Watchlist: View: Get Complete USA Trend Analysis ➞ | |
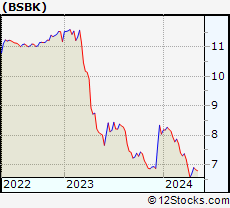 | BSBK Bogota Financial Corp. |
| Sector: Financials | |
| SubSector: Banks Regional | |
| MarketCap: 12157 Millions | |
| Recent Price: 6.61 Smart Investing & Trading Score: 67 | |
| Day Percent Change: 0.15% Day Change: 0.01 | |
| Week Change: -3.22% Year-to-date Change: -17.8% | |
| BSBK Links: Profile News Message Board | |
| Charts:- Daily , Weekly | |
| Add BSBK to Watchlist: View: Get Complete BSBK Trend Analysis ➞ | |
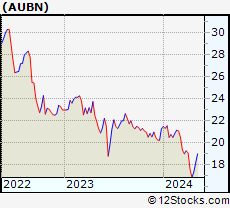 | AUBN Auburn National Bancorporation, Inc. |
| Sector: Financials | |
| SubSector: Regional - Southeast Banks | |
| MarketCap: 121.035 Millions | |
| Recent Price: 18.73 Smart Investing & Trading Score: 67 | |
| Day Percent Change: -1.52% Day Change: -0.29 | |
| Week Change: 2.8% Year-to-date Change: -12.0% | |
| AUBN Links: Profile News Message Board | |
| Charts:- Daily , Weekly | |
| Add AUBN to Watchlist: View: Get Complete AUBN Trend Analysis ➞ | |
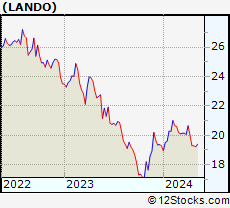 | LANDO Gladstone Land Corporation |
| Sector: Financials | |
| SubSector: REIT Industrial | |
| MarketCap: 37267 Millions | |
| Recent Price: 19.56 Smart Investing & Trading Score: 67 | |
| Day Percent Change: -0.46% Day Change: -0.09 | |
| Week Change: 1.74% Year-to-date Change: 1.4% | |
| LANDO Links: Profile News Message Board | |
| Charts:- Daily , Weekly | |
| Add LANDO to Watchlist: View: Get Complete LANDO Trend Analysis ➞ | |
 | IX ORIX Corporation |
| Sector: Financials | |
| SubSector: Credit Services | |
| MarketCap: 15483.4 Millions | |
| Recent Price: 105.07 Smart Investing & Trading Score: 67 | |
| Day Percent Change: -0.27% Day Change: -0.28 | |
| Week Change: 0.39% Year-to-date Change: 12.5% | |
| IX Links: Profile News Message Board | |
| Charts:- Daily , Weekly | |
| Add IX to Watchlist: View: Get Complete IX Trend Analysis ➞ | |
 | CUBE CubeSmart |
| Sector: Financials | |
| SubSector: REIT - Industrial | |
| MarketCap: 4562.99 Millions | |
| Recent Price: 42.27 Smart Investing & Trading Score: 67 | |
| Day Percent Change: 1.00% Day Change: 0.42 | |
| Week Change: 1.25% Year-to-date Change: -8.8% | |
| CUBE Links: Profile News Message Board | |
| Charts:- Daily , Weekly | |
| Add CUBE to Watchlist: View: Get Complete CUBE Trend Analysis ➞ | |
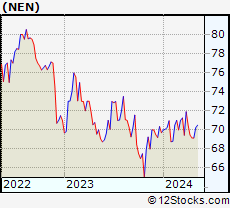 | NEN New England Realty Associates Limited Partnership |
| Sector: Financials | |
| SubSector: Real Estate Development | |
| MarketCap: 153.819 Millions | |
| Recent Price: 70.00 Smart Investing & Trading Score: 67 | |
| Day Percent Change: -0.33% Day Change: -0.23 | |
| Week Change: -0.33% Year-to-date Change: 0.4% | |
| NEN Links: Profile News Message Board | |
| Charts:- Daily , Weekly | |
| Add NEN to Watchlist: View: Get Complete NEN Trend Analysis ➞ | |
 | NWBI Northwest Bancshares, Inc. |
| Sector: Financials | |
| SubSector: Savings & Loans | |
| MarketCap: 1266.3 Millions | |
| Recent Price: 11.08 Smart Investing & Trading Score: 67 | |
| Day Percent Change: -0.27% Day Change: -0.03 | |
| Week Change: 0.09% Year-to-date Change: -11.2% | |
| NWBI Links: Profile News Message Board | |
| Charts:- Daily , Weekly | |
| Add NWBI to Watchlist: View: Get Complete NWBI Trend Analysis ➞ | |
 | WSBC WesBanco, Inc. |
| Sector: Financials | |
| SubSector: Regional - Mid-Atlantic Banks | |
| MarketCap: 1575.79 Millions | |
| Recent Price: 28.23 Smart Investing & Trading Score: 67 | |
| Day Percent Change: -0.21% Day Change: -0.06 | |
| Week Change: -0.18% Year-to-date Change: -10.0% | |
| WSBC Links: Profile News Message Board | |
| Charts:- Daily , Weekly | |
| Add WSBC to Watchlist: View: Get Complete WSBC Trend Analysis ➞ | |
 | AKR Acadia Realty Trust |
| Sector: Financials | |
| SubSector: Property Management | |
| MarketCap: 1367.42 Millions | |
| Recent Price: 17.15 Smart Investing & Trading Score: 66 | |
| Day Percent Change: 1.54% Day Change: 0.26 | |
| Week Change: 1.36% Year-to-date Change: 0.9% | |
| AKR Links: Profile News Message Board | |
| Charts:- Daily , Weekly | |
| Add AKR to Watchlist: View: Get Complete AKR Trend Analysis ➞ | |
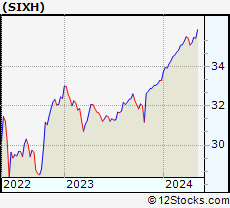 | SIXH 6 Meridian Hedged Equity Index Option Strategy ETF |
| Sector: Financials | |
| SubSector: Exchange Traded Fund | |
| MarketCap: 60157 Millions | |
| Recent Price: 35.68 Smart Investing & Trading Score: 66 | |
| Day Percent Change: 0.62% Day Change: 0.22 | |
| Week Change: 0.62% Year-to-date Change: 7.2% | |
| SIXH Links: Profile News Message Board | |
| Charts:- Daily , Weekly | |
| Add SIXH to Watchlist: View: Get Complete SIXH Trend Analysis ➞ | |
 | SCHW The Charles Schwab Corporation |
| Sector: Financials | |
| SubSector: Investment Brokerage - National | |
| MarketCap: 45115.8 Millions | |
| Recent Price: 75.54 Smart Investing & Trading Score: 66 | |
| Day Percent Change: -1.72% Day Change: -1.32 | |
| Week Change: -0.66% Year-to-date Change: 9.8% | |
| SCHW Links: Profile News Message Board | |
| Charts:- Daily , Weekly | |
| Add SCHW to Watchlist: View: Get Complete SCHW Trend Analysis ➞ | |
 | LADR Ladder Capital Corp |
| Sector: Financials | |
| SubSector: Mortgage Investment | |
| MarketCap: 660.039 Millions | |
| Recent Price: 11.01 Smart Investing & Trading Score: 66 | |
| Day Percent Change: -1.26% Day Change: -0.14 | |
| Week Change: -0.36% Year-to-date Change: -4.3% | |
| LADR Links: Profile News Message Board | |
| Charts:- Daily , Weekly | |
| Add LADR to Watchlist: View: Get Complete LADR Trend Analysis ➞ | |
 | NNI Nelnet, Inc. |
| Sector: Financials | |
| SubSector: Credit Services | |
| MarketCap: 1664.38 Millions | |
| Recent Price: 96.32 Smart Investing & Trading Score: 66 | |
| Day Percent Change: -1.25% Day Change: -1.22 | |
| Week Change: -0.26% Year-to-date Change: 9.2% | |
| NNI Links: Profile News Message Board | |
| Charts:- Daily , Weekly | |
| Add NNI to Watchlist: View: Get Complete NNI Trend Analysis ➞ | |
 | AMAL Amalgamated Bank |
| Sector: Financials | |
| SubSector: Regional - Northeast Banks | |
| MarketCap: 321.899 Millions | |
| Recent Price: 25.15 Smart Investing & Trading Score: 66 | |
| Day Percent Change: -1.02% Day Change: -0.26 | |
| Week Change: -0.91% Year-to-date Change: -6.6% | |
| AMAL Links: Profile News Message Board | |
| Charts:- Daily , Weekly | |
| Add AMAL to Watchlist: View: Get Complete AMAL Trend Analysis ➞ | |
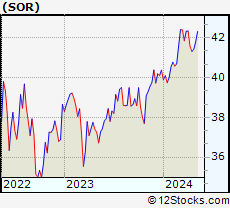 | SOR Source Capital, Inc. |
| Sector: Financials | |
| SubSector: Closed-End Fund - Equity | |
| MarketCap: 229.147 Millions | |
| Recent Price: 41.87 Smart Investing & Trading Score: 66 | |
| Day Percent Change: -0.22% Day Change: -0.09 | |
| Week Change: 0.11% Year-to-date Change: 3.7% | |
| SOR Links: Profile News Message Board | |
| Charts:- Daily , Weekly | |
| Add SOR to Watchlist: View: Get Complete SOR Trend Analysis ➞ | |
| For tabular summary view of above stock list: Summary View ➞ 0 - 25 , 25 - 50 , 50 - 75 , 75 - 100 , 100 - 125 , 125 - 150 , 150 - 175 , 175 - 200 , 200 - 225 , 225 - 250 , 250 - 275 , 275 - 300 , 300 - 325 , 325 - 350 , 350 - 375 , 375 - 400 , 400 - 425 , 425 - 450 , 450 - 475 , 475 - 500 , 500 - 525 , 525 - 550 , 550 - 575 , 575 - 600 , 600 - 625 , 625 - 650 , 650 - 675 , 675 - 700 , 700 - 725 , 725 - 750 , 750 - 775 , 775 - 800 , 800 - 825 , 825 - 850 , 850 - 875 , 875 - 900 , 900 - 925 , 925 - 950 , 950 - 975 , 975 - 1000 , 1000 - 1025 , 1025 - 1050 , 1050 - 1075 , 1075 - 1100 , 1100 - 1125 , 1125 - 1150 , 1150 - 1175 , 1175 - 1200 , 1200 - 1225 | ||
| Click To Change The Sort Order: By Market Cap or Company Size Performance: Year-to-date, Week and Day | |
| Select Chart Type: | ||
|
Best Stocks Today 12Stocks.com |
© 2024 12Stocks.com Terms & Conditions Privacy Contact Us
All Information Provided Only For Education And Not To Be Used For Investing or Trading. See Terms & Conditions


One More Thing ... Get Best Stocks Delivered Daily!
Never Ever Miss A Move With Our Top Ten Stocks Lists
Find Best Stocks In Any Market - Bull or Bear Market
Take A Peek At Our Top Ten Stocks Lists: Daily, Weekly, Year-to-Date & Top Trends
Find Best Stocks In Any Market - Bull or Bear Market
Take A Peek At Our Top Ten Stocks Lists: Daily, Weekly, Year-to-Date & Top Trends
Financial Stocks With Best Up Trends [0-bearish to 100-bullish]: Ambac [100], EverQuote [100], TOP [100], ProAssurance [100], Gladstone Commercial[100], USCB [100], Siebert [100], Eaton Vance[100], Star [100], John Hancock[100], AXIS Capital[100]
Best Financial Stocks Year-to-Date:
Root [501.43%], Banco Macro[121.01%], EverQuote [106.62%], Grupo Financiero[106.49%], Gladstone Capital[105.89%], Hippo [103.51%], Banco BBVA[102.39%], SelectQuote [77.37%], Grupo Supervielle[77.09%], Yiren Digital[65.71%], LendingTree [61.38%] Best Financial Stocks This Week:
Trupanion [28.72%], Ambac [22.97%], SelectQuote [19.12%], EverQuote [16.28%], eHealth [12.5%], Root [12.07%], Screaming Eagle[10%], Globe Life[9.81%], ProAssurance [9.62%], UBS [8.72%], IRSA Inversiones[8.64%] Best Financial Stocks Daily:
Ambac [19.31%], EverQuote [18.40%], Trupanion [13.51%], eHealth [11.32%], Root [9.93%], TOP [9.84%], ProAssurance [9.70%], UBS [7.03%], Huize Holding[6.81%], SelectQuote [6.11%], B. Riley[6.00%]