
 Login Sign Up


| |||||
 |  | ||||

| 12Stocks.com Market Intelligence |
Best Financial Stocks
| In a hurry? Financial Stocks Lists: Performance Trends Table, Stock Charts
Sort Financial stocks: Daily, Weekly, Year-to-Date, Market Cap & Trends. Filter Financial stocks list by size:All Financial Large Mid-Range Small & MicroCap |
| 12Stocks.com Financial Stocks Performances & Trends Daily | |||||||||
|
|  The overall Smart Investing & Trading Score is 75 (0-bearish to 100-bullish) which puts Financial sector in short term neutral to bullish trend. The Smart Investing & Trading Score from previous trading session is 70 and hence an improvement of trend.
| ||||||||
Here are the Smart Investing & Trading Scores of the most requested Financial stocks at 12Stocks.com (click stock name for detailed review):
|


| 12Stocks.com: Investing in Financial sector with Stocks | |
|
The following table helps investors and traders sort through current performance and trends (as measured by Smart Investing & Trading Score) of various
stocks in the Financial sector. Quick View: Move mouse or cursor over stock symbol (ticker) to view short-term Technical chart and over stock name to view long term chart. Click on  to add stock symbol to your watchlist and to add stock symbol to your watchlist and  to view watchlist. Click on any ticker or stock name for detailed market intelligence report for that stock. to view watchlist. Click on any ticker or stock name for detailed market intelligence report for that stock. |
12Stocks.com Performance of Stocks in Financial Sector
| Ticker | Stock Name | Watchlist | Category | Recent Price | Trend Score | Change % | YTD Change% |
| THFF | First |   | Regional Banks | 37.21 | 74 | 0.89% | -13.53% |
| PCK | PIMCO California | | Closed-End Fund - Debt | 5.75 | 74 | 0.89% | -0.84% |
| HIFS | Hingham Institution | | S&L | 175.19 | 74 | 0.87% | -9.88% |
| DEA | Easterly Government | | REIT - Office | 11.87 | 74 | 0.85% | -11.68% |
| TPVG | TriplePoint Venture | | Closed-End Fund - Equity | 9.63 | 74 | 0.84% | -11.33% |
| CASH | Meta | | S&L | 50.75 | 74 | 0.79% | -4.12% |
| GTY | Getty Realty | | REIT - Retail | 27.43 | 74 | 0.77% | -6.13% |
| KW | Kennedy-Wilson | | Property Mgmt | 8.58 | 74 | 0.70% | -30.69% |
| SBSI | Southside Bancshares | | Regional Banks | 28.32 | 74 | 0.60% | -9.58% |
| BKU | BankUnited | | Regional Banks | 27.60 | 74 | 0.58% | -14.89% |
| VLY | Valley National | | Regional Banks | 7.90 | 74 | 0.51% | -27.26% |
| UBSI | United Bankshares | | Regional Banks | 34.58 | 74 | 0.44% | -7.91% |
| FPI | Farmland Partners | | REIT - | 10.85 | 74 | 0.37% | -13.06% |
| WPC | W. P. | | REIT - | 56.31 | 74 | 0.16% | -13.12% |
| WSBF | Waterstone | | S&L | 11.55 | 74 | 0.09% | -18.66% |
| GAIN | Gladstone | | Investments | 14.22 | 74 | 0.07% | 0.49% |
| FSK | FS KKR | | Asset Mgmt | 19.42 | 74 | 0.00% | -2.75% |
| ONL | Orion Office | | REIT - Office | 3.27 | 74 | 0.00% | -42.83% |
| CZNC | Citizens & Northern | | Regional Banks | 17.88 | 74 | -0.56% | -20.29% |
| SAFT | Safety Insurance | | Insurance | 82.06 | 74 | -0.46% | 7.99% |
| DHIL | Diamond Hill | | Asset Mgmt | 151.37 | 74 | -0.32% | -8.59% |
| AHH | Armada Hoffler | | REIT - | 10.70 | 74 | -0.19% | -13.50% |
| SMMF | Summit | | Regional Banks | 27.30 | 74 | -0.18% | -11.05% |
| MPW | Medical Properties | | REIT | 4.64 | 73 | 2.65% | -5.50% |
| FFA | First Trust | | Closed-End Fund - Equity | 18.37 | 73 | 1.27% | 0.55% |
| For chart view version of above stock list: Chart View ➞ 0 - 25 , 25 - 50 , 50 - 75 , 75 - 100 , 100 - 125 , 125 - 150 , 150 - 175 , 175 - 200 , 200 - 225 , 225 - 250 , 250 - 275 , 275 - 300 , 300 - 325 , 325 - 350 , 350 - 375 , 375 - 400 , 400 - 425 , 425 - 450 , 450 - 475 , 475 - 500 , 500 - 525 , 525 - 550 , 550 - 575 , 575 - 600 , 600 - 625 , 625 - 650 , 650 - 675 , 675 - 700 , 700 - 725 , 725 - 750 , 750 - 775 , 775 - 800 , 800 - 825 , 825 - 850 , 850 - 875 , 875 - 900 , 900 - 925 , 925 - 950 , 950 - 975 , 975 - 1000 , 1000 - 1025 , 1025 - 1050 , 1050 - 1075 , 1075 - 1100 , 1100 - 1125 , 1125 - 1150 , 1150 - 1175 , 1175 - 1200 , 1200 - 1225 , 1225 - 1250 | ||
 | Click To Change The Sort Order: By Market Cap or Company Size Performance: Year-to-date, Week and Day |  |
|
Get the most comprehensive stock market coverage daily at 12Stocks.com ➞ Best Stocks Today ➞ Best Stocks Weekly ➞ Best Stocks Year-to-Date ➞ Best Stocks Trends ➞  Best Stocks Today 12Stocks.com Best Nasdaq Stocks ➞ Best S&P 500 Stocks ➞ Best Tech Stocks ➞ Best Biotech Stocks ➞ |
| Detailed Overview of Financial Stocks |
| Financial Technical Overview, Leaders & Laggards, Top Financial ETF Funds & Detailed Financial Stocks List, Charts, Trends & More |
| Financial Sector: Technical Analysis, Trends & YTD Performance | |
| Financial sector is composed of stocks
from banks, brokers, insurance, REITs
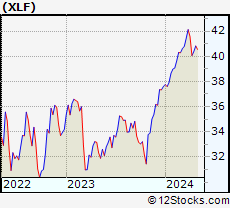
and services subsectors. Financial sector, as represented by XLF, an exchange-traded fund [ETF] that holds basket of Financial stocks (e.g, Bank of America, Goldman Sachs) is up by 9.39% and is currently outperforming the overall market by 3.75% year-to-date. Below is a quick view of Technical charts and trends: |
|
 XLF Weekly Chart |
|
| Long Term Trend: Very Good | |
| Medium Term Trend: Not Good | |
 XLF Daily Chart |
|
| Short Term Trend: Very Good | |
| Overall Trend Score: 75 | |
| YTD Performance: 9.39% | |
| **Trend Scores & Views Are Only For Educational Purposes And Not For Investing | |
| 12Stocks.com: Top Performing Financial Sector Stocks | ||||||||||||||||||||||||||||||||||||||||||||||||
 The top performing Financial sector stocks year to date are
Now, more recently, over last week, the top performing Financial sector stocks on the move are


|
||||||||||||||||||||||||||||||||||||||||||||||||
| 12Stocks.com: Investing in Financial Sector using Exchange Traded Funds | |
|
The following table shows list of key exchange traded funds (ETF) that
help investors track Financial Index. For detailed view, check out our ETF Funds section of our website. Quick View: Move mouse or cursor over ETF symbol (ticker) to view short-term Technical chart and over ETF name to view long term chart. Click on ticker or stock name for detailed view. Click on to add stock symbol to your watchlist and to view watchlist. |
12Stocks.com List of ETFs that track Financial Index
| Ticker | ETF Name | Watchlist | Recent Price | Smart Investing & Trading Score | Change % | Week % | Year-to-date % |
| XLF | Financial | | 41.13 | 75 | 0.64 | 1.86 | 9.39% |
| IAI | Broker-Dealers & Secs | | 113.10 | 75 | 0.19 | 1.86 | 4.21% |
| IYF | Financials | | 93.15 | 75 | 0.52 | 2.03 | 9.06% |
| IYG | Financial Services | | 64.88 | 75 | 0.79 | 2.3 | 8.61% |
| KRE | Regional Banking | | 48.73 | 74 | 2.08 | 2.98 | -7.06% |
| IXG | Global Financials | | 84.65 | 75 | 0.77 | 2.16 | 7.73% |
| VFH | Financials | | 99.82 | 75 | 1.54 | 2.12 | 8.19% |
| KBE | Bank | | 45.64 | 93 | 1.04 | 2.77 | -0.83% |
| FAS | Financial Bull 3X | | 103.56 | 75 | 1.94 | 5.75 | 25.3% |
| FAZ | Financial Bear 3X | | 10.58 | 25 | -1.76 | -5.54 | -22.6% |
| UYG | Financials | | 64.74 | 75 | 1.35 | 3.68 | 17.28% |
| IAT | Regional Banks | | 41.89 | 93 | 0.82 | 2.82 | 0.12% |
| KIE | Insurance | | 49.75 | 65 | 0.59 | 1.37 | 10.02% |
| PSCF | SmallCap Financials | | 46.95 | 59 | 1.54 | 3.25 | -4.53% |
| EUFN | Europe Financials | | 22.67 | 75 | 2.30 | 3.28 | 8.16% |
| PGF | Financial Preferred | | 14.72 | 39 | 1.38 | 1.31 | 0.96% |
| 12Stocks.com: Charts, Trends, Fundamental Data and Performances of Financial Stocks | |
|
We now take in-depth look at all Financial stocks including charts, multi-period performances and overall trends (as measured by Smart Investing & Trading Score). One can sort Financial stocks (click link to choose) by Daily, Weekly and by Year-to-Date performances. Also, one can sort by size of the company or by market capitalization. |
| Select Your Default Chart Type: | |||||
| |||||
| Click on stock symbol or name for detailed view. Click on to add stock symbol to your watchlist and to view watchlist. Quick View: Move mouse or cursor over "Daily" to quickly view daily Technical stock chart and over "Weekly" to view weekly Technical stock chart. | |||||

 | THFF First Financial Corporation |
| Sector: Financials | |
| SubSector: Regional - Midwest Banks | |
| MarketCap: 433.07 Millions | |
| Recent Price: 37.21 Smart Investing & Trading Score: 74 | |
| Day Percent Change: 0.89% Day Change: 0.33 | |
| Week Change: 1.64% Year-to-date Change: -13.5% | |
| THFF Links: Profile News Message Board | |
| Charts:- Daily , Weekly | |
| Add THFF to Watchlist: View: Get Complete THFF Trend Analysis ➞ | |
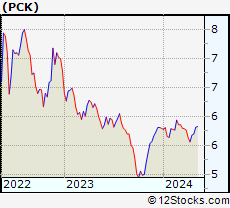 | PCK PIMCO California Municipal Income Fund II |
| Sector: Financials | |
| SubSector: Closed-End Fund - Debt | |
| MarketCap: 231.307 Millions | |
| Recent Price: 5.75 Smart Investing & Trading Score: 74 | |
| Day Percent Change: 0.89% Day Change: 0.05 | |
| Week Change: 1.25% Year-to-date Change: -0.8% | |
| PCK Links: Profile News Message Board | |
| Charts:- Daily , Weekly | |
| Add PCK to Watchlist: View: Get Complete PCK Trend Analysis ➞ | |
 | HIFS Hingham Institution for Savings |
| Sector: Financials | |
| SubSector: Savings & Loans | |
| MarketCap: 341.93 Millions | |
| Recent Price: 175.19 Smart Investing & Trading Score: 74 | |
| Day Percent Change: 0.87% Day Change: 1.51 | |
| Week Change: 2.67% Year-to-date Change: -9.9% | |
| HIFS Links: Profile News Message Board | |
| Charts:- Daily , Weekly | |
| Add HIFS to Watchlist: View: Get Complete HIFS Trend Analysis ➞ | |
 | DEA Easterly Government Properties, Inc. |
| Sector: Financials | |
| SubSector: REIT - Office | |
| MarketCap: 1832.56 Millions | |
| Recent Price: 11.87 Smart Investing & Trading Score: 74 | |
| Day Percent Change: 0.85% Day Change: 0.10 | |
| Week Change: 2.42% Year-to-date Change: -11.7% | |
| DEA Links: Profile News Message Board | |
| Charts:- Daily , Weekly | |
| Add DEA to Watchlist: View: Get Complete DEA Trend Analysis ➞ | |
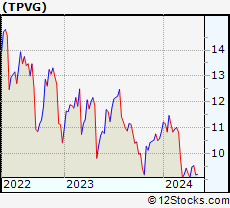 | TPVG TriplePoint Venture Growth BDC Corp. |
| Sector: Financials | |
| SubSector: Closed-End Fund - Equity | |
| MarketCap: 158.147 Millions | |
| Recent Price: 9.63 Smart Investing & Trading Score: 74 | |
| Day Percent Change: 0.84% Day Change: 0.08 | |
| Week Change: 1.37% Year-to-date Change: -11.3% | |
| TPVG Links: Profile News Message Board | |
| Charts:- Daily , Weekly | |
| Add TPVG to Watchlist: View: Get Complete TPVG Trend Analysis ➞ | |
 | CASH Meta Financial Group, Inc. |
| Sector: Financials | |
| SubSector: Savings & Loans | |
| MarketCap: 849.33 Millions | |
| Recent Price: 50.75 Smart Investing & Trading Score: 74 | |
| Day Percent Change: 0.79% Day Change: 0.40 | |
| Week Change: 0.71% Year-to-date Change: -4.1% | |
| CASH Links: Profile News Message Board | |
| Charts:- Daily , Weekly | |
| Add CASH to Watchlist: View: Get Complete CASH Trend Analysis ➞ | |
 | GTY Getty Realty Corp. |
| Sector: Financials | |
| SubSector: REIT - Retail | |
| MarketCap: 926.114 Millions | |
| Recent Price: 27.43 Smart Investing & Trading Score: 74 | |
| Day Percent Change: 0.77% Day Change: 0.21 | |
| Week Change: 1.63% Year-to-date Change: -6.1% | |
| GTY Links: Profile News Message Board | |
| Charts:- Daily , Weekly | |
| Add GTY to Watchlist: View: Get Complete GTY Trend Analysis ➞ | |
 | KW Kennedy-Wilson Holdings, Inc. |
| Sector: Financials | |
| SubSector: Property Management | |
| MarketCap: 2025.42 Millions | |
| Recent Price: 8.58 Smart Investing & Trading Score: 74 | |
| Day Percent Change: 0.70% Day Change: 0.06 | |
| Week Change: 0.94% Year-to-date Change: -30.7% | |
| KW Links: Profile News Message Board | |
| Charts:- Daily , Weekly | |
| Add KW to Watchlist: View: Get Complete KW Trend Analysis ➞ | |
 | SBSI Southside Bancshares, Inc. |
| Sector: Financials | |
| SubSector: Regional - Mid-Atlantic Banks | |
| MarketCap: 971.259 Millions | |
| Recent Price: 28.32 Smart Investing & Trading Score: 74 | |
| Day Percent Change: 0.60% Day Change: 0.17 | |
| Week Change: 0.5% Year-to-date Change: -9.6% | |
| SBSI Links: Profile News Message Board | |
| Charts:- Daily , Weekly | |
| Add SBSI to Watchlist: View: Get Complete SBSI Trend Analysis ➞ | |
 | BKU BankUnited, Inc. |
| Sector: Financials | |
| SubSector: Regional - Mid-Atlantic Banks | |
| MarketCap: 1905.99 Millions | |
| Recent Price: 27.60 Smart Investing & Trading Score: 74 | |
| Day Percent Change: 0.58% Day Change: 0.16 | |
| Week Change: 3.33% Year-to-date Change: -14.9% | |
| BKU Links: Profile News Message Board | |
| Charts:- Daily , Weekly | |
| Add BKU to Watchlist: View: Get Complete BKU Trend Analysis ➞ | |
 | VLY Valley National Bancorp |
| Sector: Financials | |
| SubSector: Regional - Northeast Banks | |
| MarketCap: 2843.09 Millions | |
| Recent Price: 7.90 Smart Investing & Trading Score: 74 | |
| Day Percent Change: 0.51% Day Change: 0.04 | |
| Week Change: 2.46% Year-to-date Change: -27.3% | |
| VLY Links: Profile News Message Board | |
| Charts:- Daily , Weekly | |
| Add VLY to Watchlist: View: Get Complete VLY Trend Analysis ➞ | |
 | UBSI United Bankshares, Inc. |
| Sector: Financials | |
| SubSector: Regional - Mid-Atlantic Banks | |
| MarketCap: 2286.79 Millions | |
| Recent Price: 34.58 Smart Investing & Trading Score: 74 | |
| Day Percent Change: 0.44% Day Change: 0.15 | |
| Week Change: 1.2% Year-to-date Change: -7.9% | |
| UBSI Links: Profile News Message Board | |
| Charts:- Daily , Weekly | |
| Add UBSI to Watchlist: View: Get Complete UBSI Trend Analysis ➞ | |
 | FPI Farmland Partners Inc. |
| Sector: Financials | |
| SubSector: REIT - Diversified | |
| MarketCap: 182.653 Millions | |
| Recent Price: 10.85 Smart Investing & Trading Score: 74 | |
| Day Percent Change: 0.37% Day Change: 0.04 | |
| Week Change: 0.93% Year-to-date Change: -13.1% | |
| FPI Links: Profile News Message Board | |
| Charts:- Daily , Weekly | |
| Add FPI to Watchlist: View: Get Complete FPI Trend Analysis ➞ | |
 | WPC W. P. Carey Inc. |
| Sector: Financials | |
| SubSector: REIT - Diversified | |
| MarketCap: 9560.03 Millions | |
| Recent Price: 56.31 Smart Investing & Trading Score: 74 | |
| Day Percent Change: 0.16% Day Change: 0.09 | |
| Week Change: 0.18% Year-to-date Change: -13.1% | |
| WPC Links: Profile News Message Board | |
| Charts:- Daily , Weekly | |
| Add WPC to Watchlist: View: Get Complete WPC Trend Analysis ➞ | |
 | WSBF Waterstone Financial, Inc. |
| Sector: Financials | |
| SubSector: Savings & Loans | |
| MarketCap: 371.93 Millions | |
| Recent Price: 11.55 Smart Investing & Trading Score: 74 | |
| Day Percent Change: 0.09% Day Change: 0.01 | |
| Week Change: -0.35% Year-to-date Change: -18.7% | |
| WSBF Links: Profile News Message Board | |
| Charts:- Daily , Weekly | |
| Add WSBF to Watchlist: View: Get Complete WSBF Trend Analysis ➞ | |
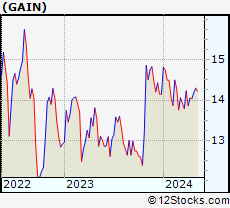 | GAIN Gladstone Investment Corporation |
| Sector: Financials | |
| SubSector: Diversified Investments | |
| MarketCap: 255.17 Millions | |
| Recent Price: 14.22 Smart Investing & Trading Score: 74 | |
| Day Percent Change: 0.07% Day Change: 0.01 | |
| Week Change: 1.28% Year-to-date Change: 0.5% | |
| GAIN Links: Profile News Message Board | |
| Charts:- Daily , Weekly | |
| Add GAIN to Watchlist: View: Get Complete GAIN Trend Analysis ➞ | |
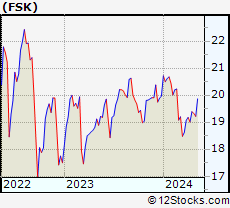 | FSK FS KKR Capital Corp. |
| Sector: Financials | |
| SubSector: Asset Management | |
| MarketCap: 1262.33 Millions | |
| Recent Price: 19.42 Smart Investing & Trading Score: 74 | |
| Day Percent Change: 0.00% Day Change: 0.00 | |
| Week Change: 0.15% Year-to-date Change: -2.8% | |
| FSK Links: Profile News Message Board | |
| Charts:- Daily , Weekly | |
| Add FSK to Watchlist: View: Get Complete FSK Trend Analysis ➞ | |
 | ONL Orion Office REIT Inc. |
| Sector: Financials | |
| SubSector: REIT - Office | |
| MarketCap: 375 Millions | |
| Recent Price: 3.27 Smart Investing & Trading Score: 74 | |
| Day Percent Change: 0.00% Day Change: 0.00 | |
| Week Change: 3.48% Year-to-date Change: -42.8% | |
| ONL Links: Profile News Message Board | |
| Charts:- Daily , Weekly | |
| Add ONL to Watchlist: View: Get Complete ONL Trend Analysis ➞ | |
 | CZNC Citizens & Northern Corporation |
| Sector: Financials | |
| SubSector: Regional - Mid-Atlantic Banks | |
| MarketCap: 274.459 Millions | |
| Recent Price: 17.88 Smart Investing & Trading Score: 74 | |
| Day Percent Change: -0.56% Day Change: -0.10 | |
| Week Change: 0.85% Year-to-date Change: -20.3% | |
| CZNC Links: Profile News Message Board | |
| Charts:- Daily , Weekly | |
| Add CZNC to Watchlist: View: Get Complete CZNC Trend Analysis ➞ | |
 | SAFT Safety Insurance Group, Inc. |
| Sector: Financials | |
| SubSector: Property & Casualty Insurance | |
| MarketCap: 1145.12 Millions | |
| Recent Price: 82.06 Smart Investing & Trading Score: 74 | |
| Day Percent Change: -0.46% Day Change: -0.38 | |
| Week Change: 0.1% Year-to-date Change: 8.0% | |
| SAFT Links: Profile News Message Board | |
| Charts:- Daily , Weekly | |
| Add SAFT to Watchlist: View: Get Complete SAFT Trend Analysis ➞ | |
 | DHIL Diamond Hill Investment Group, Inc. |
| Sector: Financials | |
| SubSector: Asset Management | |
| MarketCap: 316.203 Millions | |
| Recent Price: 151.37 Smart Investing & Trading Score: 74 | |
| Day Percent Change: -0.32% Day Change: -0.49 | |
| Week Change: 0.36% Year-to-date Change: -8.6% | |
| DHIL Links: Profile News Message Board | |
| Charts:- Daily , Weekly | |
| Add DHIL to Watchlist: View: Get Complete DHIL Trend Analysis ➞ | |
 | AHH Armada Hoffler Properties, Inc. |
| Sector: Financials | |
| SubSector: REIT - Diversified | |
| MarketCap: 550.653 Millions | |
| Recent Price: 10.70 Smart Investing & Trading Score: 74 | |
| Day Percent Change: -0.19% Day Change: -0.02 | |
| Week Change: 1.9% Year-to-date Change: -13.5% | |
| AHH Links: Profile News Message Board | |
| Charts:- Daily , Weekly | |
| Add AHH to Watchlist: View: Get Complete AHH Trend Analysis ➞ | |
 | SMMF Summit Financial Group, Inc. |
| Sector: Financials | |
| SubSector: Regional - Mid-Atlantic Banks | |
| MarketCap: 228.959 Millions | |
| Recent Price: 27.30 Smart Investing & Trading Score: 74 | |
| Day Percent Change: -0.18% Day Change: -0.05 | |
| Week Change: 0.37% Year-to-date Change: -11.1% | |
| SMMF Links: Profile News Message Board | |
| Charts:- Daily , Weekly | |
| Add SMMF to Watchlist: View: Get Complete SMMF Trend Analysis ➞ | |
 | MPW Medical Properties Trust, Inc. |
| Sector: Financials | |
| SubSector: REIT - Healthcare Facilities | |
| MarketCap: 8586.74 Millions | |
| Recent Price: 4.64 Smart Investing & Trading Score: 73 | |
| Day Percent Change: 2.65% Day Change: 0.12 | |
| Week Change: 4.98% Year-to-date Change: -5.5% | |
| MPW Links: Profile News Message Board | |
| Charts:- Daily , Weekly | |
| Add MPW to Watchlist: View: Get Complete MPW Trend Analysis ➞ | |
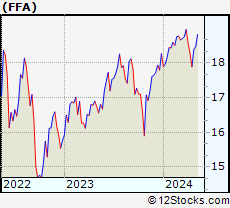 | FFA First Trust Enhanced Equity Income Fund |
| Sector: Financials | |
| SubSector: Closed-End Fund - Equity | |
| MarketCap: 206.247 Millions | |
| Recent Price: 18.37 Smart Investing & Trading Score: 73 | |
| Day Percent Change: 1.27% Day Change: 0.23 | |
| Week Change: 2.68% Year-to-date Change: 0.6% | |
| FFA Links: Profile News Message Board | |
| Charts:- Daily , Weekly | |
| Add FFA to Watchlist: View: Get Complete FFA Trend Analysis ➞ | |
| For tabular summary view of above stock list: Summary View ➞ 0 - 25 , 25 - 50 , 50 - 75 , 75 - 100 , 100 - 125 , 125 - 150 , 150 - 175 , 175 - 200 , 200 - 225 , 225 - 250 , 250 - 275 , 275 - 300 , 300 - 325 , 325 - 350 , 350 - 375 , 375 - 400 , 400 - 425 , 425 - 450 , 450 - 475 , 475 - 500 , 500 - 525 , 525 - 550 , 550 - 575 , 575 - 600 , 600 - 625 , 625 - 650 , 650 - 675 , 675 - 700 , 700 - 725 , 725 - 750 , 750 - 775 , 775 - 800 , 800 - 825 , 825 - 850 , 850 - 875 , 875 - 900 , 900 - 925 , 925 - 950 , 950 - 975 , 975 - 1000 , 1000 - 1025 , 1025 - 1050 , 1050 - 1075 , 1075 - 1100 , 1100 - 1125 , 1125 - 1150 , 1150 - 1175 , 1175 - 1200 , 1200 - 1225 , 1225 - 1250 | ||
| Click To Change The Sort Order: By Market Cap or Company Size Performance: Year-to-date, Week and Day | |
| Select Chart Type: | ||
|
Best Stocks Today 12Stocks.com |
© 2024 12Stocks.com Terms & Conditions Privacy Contact Us
All Information Provided Only For Education And Not To Be Used For Investing or Trading. See Terms & Conditions


One More Thing ... Get Best Stocks Delivered Daily!
Never Ever Miss A Move With Our Top Ten Stocks Lists
Find Best Stocks In Any Market - Bull or Bear Market
Take A Peek At Our Top Ten Stocks Lists: Daily, Weekly, Year-to-Date & Top Trends
Find Best Stocks In Any Market - Bull or Bear Market
Take A Peek At Our Top Ten Stocks Lists: Daily, Weekly, Year-to-Date & Top Trends
Financial Stocks With Best Up Trends [0-bearish to 100-bullish]: Enova [100], Piedmont Office[100], Equity Bancshares[100], Cadence Ban[100], CVB [100], Jackson [100], NBT Bancorp[100], Victory Capital[100], RLI [100], Hagerty [100], Popular [100]
Best Financial Stocks Year-to-Date:
Root [465.14%], Hippo [134.14%], Gladstone Capital[98.97%], Banco Macro[81.43%], Grupo Financiero[76.83%], Banco BBVA[72.79%], Yiren Digital[60.9%], Heritage Insurance[56.44%], Fidelis Insurance[55.2%], First [52.15%], Mercury General[52.13%] Best Financial Stocks This Week:
Oportun [35.78%], Cipher Mining[25%], Root [14.36%], Globe Life[13.52%], Iris Energy[12.73%], Coinbase Global[12.04%], Grupo Supervielle[10.55%], Franklin Street[10.11%], KB [9.93%], Banco BBVA[9.68%], LendingTree [9.55%] Best Financial Stocks Daily:
Oportun [40.00%], Globe Life[14.11%], Franklin Street[10.70%], Root [8.63%], Lemonade [8.23%], Uniti [8.10%], Heritage Insurance[7.37%], Stone Harbor[6.03%], Rocket [5.51%], Sierra Bancorp[5.44%], MicroSectors Gold[5.35%]