
 Login Sign Up


| |||||
 |  | ||||

| 12Stocks.com Market Intelligence |
Best Financial Stocks
| In a hurry? Financial Stocks Lists: Performance Trends Table, Stock Charts
Sort Financial stocks: Daily, Weekly, Year-to-Date, Market Cap & Trends. Filter Financial stocks list by size:All Financial Large Mid-Range Small & MicroCap |
| 12Stocks.com Financial Stocks Performances & Trends Daily | |||||||||
|
|  The overall Smart Investing & Trading Score is 75 (0-bearish to 100-bullish) which puts Financial sector in short term neutral to bullish trend. The Smart Investing & Trading Score from previous trading session is 70 and hence an improvement of trend.
| ||||||||
Here are the Smart Investing & Trading Scores of the most requested Financial stocks at 12Stocks.com (click stock name for detailed review):
|


| 12Stocks.com: Investing in Financial sector with Stocks | |
|
The following table helps investors and traders sort through current performance and trends (as measured by Smart Investing & Trading Score) of various
stocks in the Financial sector. Quick View: Move mouse or cursor over stock symbol (ticker) to view short-term Technical chart and over stock name to view long term chart. Click on  to add stock symbol to your watchlist and to add stock symbol to your watchlist and  to view watchlist. Click on any ticker or stock name for detailed market intelligence report for that stock. to view watchlist. Click on any ticker or stock name for detailed market intelligence report for that stock. |
12Stocks.com Performance of Stocks in Financial Sector
| Ticker | Stock Name | Watchlist | Category | Recent Price | Trend Score | Change % | YTD Change% |
| PFLT | PennantPark Floating |   | Asset Mgmt | 11.54 | 100 | 1.41% | -4.63% |
| FITB | Fifth Third | | Regional Banks | 37.06 | 100 | 1.40% | 7.45% |
| AKR | Acadia Realty | | Property Mgmt | 17.66 | 100 | 1.38% | 3.94% |
| ASB | Associated Banc-Corp | | Regional Banks | 21.27 | 100 | 1.38% | -0.56% |
| PMX | PIMCO Municipal | | Closed-End Fund - Debt | 7.47 | 100 | 1.36% | 1.08% |
| FHB | First Hawaiian | | Regional Banks | 21.96 | 100 | 1.34% | -3.94% |
| SCHW | Charles Schwab | | Brokerage | 75.23 | 100 | 1.31% | 9.35% |
| SLRC | Solar Capital | | Investments | 15.41 | 100 | 1.31% | 2.53% |
| GOOD | Gladstone Commercial | | REIT - | 13.39 | 100 | 1.29% | 1.13% |
| CFG | Citizens | | Regional Banks | 34.97 | 100 | 1.22% | 5.52% |
| CGBD | TCG BDC | | Asset Mgmt | 16.99 | 100 | 1.22% | 13.57% |
| BANF | BancFirst | | Regional - Southwest Banks | 92.36 | 100 | 1.18% | -5.11% |
| IGD | Voya Global | | Closed-End Fund - Foreign | 5.20 | 100 | 1.17% | 4.63% |
| SCM | Stellus Capital | | Asset Mgmt | 14.14 | 100 | 1.14% | 10.04% |
| CSWC | Capital Southwest | | Asset Mgmt | 25.69 | 100 | 1.10% | 8.40% |
| MAIN | Main Street | | Investments | 48.69 | 100 | 1.10% | 12.63% |
| FDUS | Fidus | | Asset Mgmt | 20.34 | 100 | 1.09% | 3.30% |
| BRT | BRT Apartments | | Mortgage | 17.94 | 100 | 1.07% | -3.50% |
| PRK | Park National | | Regional Banks | 135.31 | 100 | 1.06% | 1.84% |
| CFR | Cullen/Frost Bankers | | Regional - Southwest Banks | 114.45 | 100 | 1.04% | 5.49% |
| CHCT | Community Healthcare | | REIT | 25.96 | 100 | 1.01% | -2.55% |
| HTD | John Hancock | | Closed-End Fund - Debt | 19.61 | 100 | 0.98% | 3.37% |
| AVB | AvalonBay Communities | | REIT | 188.66 | 100 | 0.96% | 0.77% |
| DPG | Duff & Phelps Utility and Infrastructure Fund | | Closed-End Fund - Equity | 9.46 | 100 | 0.96% | 3.16% |
| NXRT | NexPoint Residential | | REIT | 33.02 | 100 | 0.95% | -4.10% |
| For chart view version of above stock list: Chart View ➞ 0 - 25 , 25 - 50 , 50 - 75 , 75 - 100 , 100 - 125 , 125 - 150 , 150 - 175 , 175 - 200 , 200 - 225 , 225 - 250 , 250 - 275 , 275 - 300 , 300 - 325 , 325 - 350 , 350 - 375 , 375 - 400 , 400 - 425 , 425 - 450 , 450 - 475 , 475 - 500 , 500 - 525 , 525 - 550 , 550 - 575 , 575 - 600 , 600 - 625 , 625 - 650 , 650 - 675 , 675 - 700 , 700 - 725 , 725 - 750 , 750 - 775 , 775 - 800 , 800 - 825 , 825 - 850 , 850 - 875 , 875 - 900 , 900 - 925 , 925 - 950 , 950 - 975 , 975 - 1000 , 1000 - 1025 , 1025 - 1050 , 1050 - 1075 , 1075 - 1100 , 1100 - 1125 , 1125 - 1150 , 1150 - 1175 , 1175 - 1200 , 1200 - 1225 , 1225 - 1250 | ||
 | Click To Change The Sort Order: By Market Cap or Company Size Performance: Year-to-date, Week and Day |  |
|
Get the most comprehensive stock market coverage daily at 12Stocks.com ➞ Best Stocks Today ➞ Best Stocks Weekly ➞ Best Stocks Year-to-Date ➞ Best Stocks Trends ➞  Best Stocks Today 12Stocks.com Best Nasdaq Stocks ➞ Best S&P 500 Stocks ➞ Best Tech Stocks ➞ Best Biotech Stocks ➞ |
| Detailed Overview of Financial Stocks |
| Financial Technical Overview, Leaders & Laggards, Top Financial ETF Funds & Detailed Financial Stocks List, Charts, Trends & More |
| Financial Sector: Technical Analysis, Trends & YTD Performance | |
| Financial sector is composed of stocks
from banks, brokers, insurance, REITs
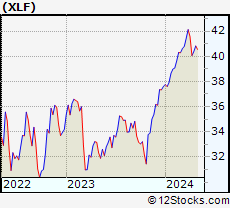
and services subsectors. Financial sector, as represented by XLF, an exchange-traded fund [ETF] that holds basket of Financial stocks (e.g, Bank of America, Goldman Sachs) is up by 9.39% and is currently outperforming the overall market by 3.75% year-to-date. Below is a quick view of Technical charts and trends: |
|
 XLF Weekly Chart |
|
| Long Term Trend: Very Good | |
| Medium Term Trend: Not Good | |
 XLF Daily Chart |
|
| Short Term Trend: Very Good | |
| Overall Trend Score: 75 | |
| YTD Performance: 9.39% | |
| **Trend Scores & Views Are Only For Educational Purposes And Not For Investing | |
| 12Stocks.com: Top Performing Financial Sector Stocks | ||||||||||||||||||||||||||||||||||||||||||||||||
 The top performing Financial sector stocks year to date are
Now, more recently, over last week, the top performing Financial sector stocks on the move are


|
||||||||||||||||||||||||||||||||||||||||||||||||
| 12Stocks.com: Investing in Financial Sector using Exchange Traded Funds | |
|
The following table shows list of key exchange traded funds (ETF) that
help investors track Financial Index. For detailed view, check out our ETF Funds section of our website. Quick View: Move mouse or cursor over ETF symbol (ticker) to view short-term Technical chart and over ETF name to view long term chart. Click on ticker or stock name for detailed view. Click on to add stock symbol to your watchlist and to view watchlist. |
12Stocks.com List of ETFs that track Financial Index
| Ticker | ETF Name | Watchlist | Recent Price | Smart Investing & Trading Score | Change % | Week % | Year-to-date % |
| XLF | Financial | | 41.13 | 75 | 0.64 | 1.86 | 9.39% |
| IAI | Broker-Dealers & Secs | | 113.10 | 75 | 0.19 | 1.86 | 4.21% |
| IYF | Financials | | 93.15 | 75 | 0.52 | 2.03 | 9.06% |
| IYG | Financial Services | | 64.88 | 83 | 0.79 | 2.3 | 8.61% |
| KRE | Regional Banking | | 48.73 | 74 | 2.08 | 2.98 | -7.06% |
| IXG | Global Financials | | 84.65 | 75 | 0.77 | 2.16 | 7.73% |
| VFH | Financials | | 99.82 | 75 | 1.54 | 2.12 | 8.19% |
| KBE | Bank | | 45.64 | 93 | 1.04 | 2.77 | -0.83% |
| FAS | Financial Bull 3X | | 103.56 | 75 | 1.94 | 5.75 | 25.3% |
| FAZ | Financial Bear 3X | | 10.58 | 25 | -1.76 | -5.54 | -22.6% |
| UYG | Financials | | 64.74 | 75 | 1.35 | 3.68 | 17.28% |
| IAT | Regional Banks | | 41.89 | 93 | 0.82 | 2.82 | 0.12% |
| KIE | Insurance | | 49.75 | 65 | 0.59 | 1.37 | 10.02% |
| PSCF | SmallCap Financials | | 46.95 | 80 | 1.54 | 3.25 | -4.53% |
| EUFN | Europe Financials | | 22.67 | 88 | 2.30 | 3.28 | 8.16% |
| PGF | Financial Preferred | | 14.72 | 44 | 1.38 | 1.31 | 0.96% |
| 12Stocks.com: Charts, Trends, Fundamental Data and Performances of Financial Stocks | |
|
We now take in-depth look at all Financial stocks including charts, multi-period performances and overall trends (as measured by Smart Investing & Trading Score). One can sort Financial stocks (click link to choose) by Daily, Weekly and by Year-to-Date performances. Also, one can sort by size of the company or by market capitalization. |
| Select Your Default Chart Type: | |||||
| |||||
| Click on stock symbol or name for detailed view. Click on to add stock symbol to your watchlist and to view watchlist. Quick View: Move mouse or cursor over "Daily" to quickly view daily Technical stock chart and over "Weekly" to view weekly Technical stock chart. | |||||

 | PFLT PennantPark Floating Rate Capital Ltd. |
| Sector: Financials | |
| SubSector: Asset Management | |
| MarketCap: 170.903 Millions | |
| Recent Price: 11.54 Smart Investing & Trading Score: 100 | |
| Day Percent Change: 1.41% Day Change: 0.16 | |
| Week Change: 1.5% Year-to-date Change: -4.6% | |
| PFLT Links: Profile News Message Board | |
| Charts:- Daily , Weekly | |
| Add PFLT to Watchlist: View: Get Complete PFLT Trend Analysis ➞ | |
 | FITB Fifth Third Bancorp |
| Sector: Financials | |
| SubSector: Regional - Midwest Banks | |
| MarketCap: 10197 Millions | |
| Recent Price: 37.06 Smart Investing & Trading Score: 100 | |
| Day Percent Change: 1.40% Day Change: 0.51 | |
| Week Change: 2.23% Year-to-date Change: 7.5% | |
| FITB Links: Profile News Message Board | |
| Charts:- Daily , Weekly | |
| Add FITB to Watchlist: View: Get Complete FITB Trend Analysis ➞ | |
 | AKR Acadia Realty Trust |
| Sector: Financials | |
| SubSector: Property Management | |
| MarketCap: 1367.42 Millions | |
| Recent Price: 17.66 Smart Investing & Trading Score: 100 | |
| Day Percent Change: 1.38% Day Change: 0.24 | |
| Week Change: 3.58% Year-to-date Change: 3.9% | |
| AKR Links: Profile News Message Board | |
| Charts:- Daily , Weekly | |
| Add AKR to Watchlist: View: Get Complete AKR Trend Analysis ➞ | |
 | ASB Associated Banc-Corp |
| Sector: Financials | |
| SubSector: Regional - Midwest Banks | |
| MarketCap: 1904.8 Millions | |
| Recent Price: 21.27 Smart Investing & Trading Score: 100 | |
| Day Percent Change: 1.38% Day Change: 0.29 | |
| Week Change: 3.5% Year-to-date Change: -0.6% | |
| ASB Links: Profile News Message Board | |
| Charts:- Daily , Weekly | |
| Add ASB to Watchlist: View: Get Complete ASB Trend Analysis ➞ | |
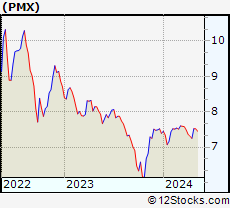 | PMX PIMCO Municipal Income Fund III |
| Sector: Financials | |
| SubSector: Closed-End Fund - Debt | |
| MarketCap: 309.807 Millions | |
| Recent Price: 7.47 Smart Investing & Trading Score: 100 | |
| Day Percent Change: 1.36% Day Change: 0.10 | |
| Week Change: 3.03% Year-to-date Change: 1.1% | |
| PMX Links: Profile News Message Board | |
| Charts:- Daily , Weekly | |
| Add PMX to Watchlist: View: Get Complete PMX Trend Analysis ➞ | |
 | FHB First Hawaiian, Inc. |
| Sector: Financials | |
| SubSector: Regional - Pacific Banks | |
| MarketCap: 2398.99 Millions | |
| Recent Price: 21.96 Smart Investing & Trading Score: 100 | |
| Day Percent Change: 1.34% Day Change: 0.29 | |
| Week Change: 4.57% Year-to-date Change: -3.9% | |
| FHB Links: Profile News Message Board | |
| Charts:- Daily , Weekly | |
| Add FHB to Watchlist: View: Get Complete FHB Trend Analysis ➞ | |
 | SCHW The Charles Schwab Corporation |
| Sector: Financials | |
| SubSector: Investment Brokerage - National | |
| MarketCap: 45115.8 Millions | |
| Recent Price: 75.23 Smart Investing & Trading Score: 100 | |
| Day Percent Change: 1.31% Day Change: 0.97 | |
| Week Change: 2.47% Year-to-date Change: 9.4% | |
| SCHW Links: Profile News Message Board | |
| Charts:- Daily , Weekly | |
| Add SCHW to Watchlist: View: Get Complete SCHW Trend Analysis ➞ | |
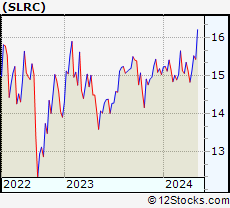 | SLRC Solar Capital Ltd. |
| Sector: Financials | |
| SubSector: Diversified Investments | |
| MarketCap: 412.87 Millions | |
| Recent Price: 15.41 Smart Investing & Trading Score: 100 | |
| Day Percent Change: 1.31% Day Change: 0.20 | |
| Week Change: 1.85% Year-to-date Change: 2.5% | |
| SLRC Links: Profile News Message Board | |
| Charts:- Daily , Weekly | |
| Add SLRC to Watchlist: View: Get Complete SLRC Trend Analysis ➞ | |
 | GOOD Gladstone Commercial Corporation |
| Sector: Financials | |
| SubSector: REIT - Diversified | |
| MarketCap: 425.253 Millions | |
| Recent Price: 13.39 Smart Investing & Trading Score: 100 | |
| Day Percent Change: 1.29% Day Change: 0.17 | |
| Week Change: 1.83% Year-to-date Change: 1.1% | |
| GOOD Links: Profile News Message Board | |
| Charts:- Daily , Weekly | |
| Add GOOD to Watchlist: View: Get Complete GOOD Trend Analysis ➞ | |
 | CFG Citizens Financial Group, Inc. |
| Sector: Financials | |
| SubSector: Regional - Mid-Atlantic Banks | |
| MarketCap: 8225.19 Millions | |
| Recent Price: 34.97 Smart Investing & Trading Score: 100 | |
| Day Percent Change: 1.22% Day Change: 0.42 | |
| Week Change: 2.88% Year-to-date Change: 5.5% | |
| CFG Links: Profile News Message Board | |
| Charts:- Daily , Weekly | |
| Add CFG to Watchlist: View: Get Complete CFG Trend Analysis ➞ | |
 | CGBD TCG BDC, Inc. |
| Sector: Financials | |
| SubSector: Asset Management | |
| MarketCap: 379.003 Millions | |
| Recent Price: 16.99 Smart Investing & Trading Score: 100 | |
| Day Percent Change: 1.22% Day Change: 0.20 | |
| Week Change: 1.61% Year-to-date Change: 13.6% | |
| CGBD Links: Profile News Message Board | |
| Charts:- Daily , Weekly | |
| Add CGBD to Watchlist: View: Get Complete CGBD Trend Analysis ➞ | |
 | BANF BancFirst Corporation |
| Sector: Financials | |
| SubSector: Regional - Southwest Banks | |
| MarketCap: 1068.65 Millions | |
| Recent Price: 92.36 Smart Investing & Trading Score: 100 | |
| Day Percent Change: 1.18% Day Change: 1.08 | |
| Week Change: 3.45% Year-to-date Change: -5.1% | |
| BANF Links: Profile News Message Board | |
| Charts:- Daily , Weekly | |
| Add BANF to Watchlist: View: Get Complete BANF Trend Analysis ➞ | |
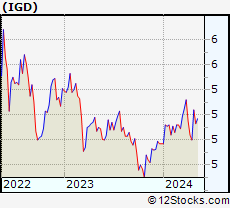 | IGD Voya Global Equity Dividend and Premium Opportunity Fund |
| Sector: Financials | |
| SubSector: Closed-End Fund - Foreign | |
| MarketCap: 393.147 Millions | |
| Recent Price: 5.20 Smart Investing & Trading Score: 100 | |
| Day Percent Change: 1.17% Day Change: 0.06 | |
| Week Change: 4% Year-to-date Change: 4.6% | |
| IGD Links: Profile News Message Board | |
| Charts:- Daily , Weekly | |
| Add IGD to Watchlist: View: Get Complete IGD Trend Analysis ➞ | |
 | SCM Stellus Capital Investment Corporation |
| Sector: Financials | |
| SubSector: Asset Management | |
| MarketCap: 127.403 Millions | |
| Recent Price: 14.14 Smart Investing & Trading Score: 100 | |
| Day Percent Change: 1.14% Day Change: 0.16 | |
| Week Change: 1.43% Year-to-date Change: 10.0% | |
| SCM Links: Profile News Message Board | |
| Charts:- Daily , Weekly | |
| Add SCM to Watchlist: View: Get Complete SCM Trend Analysis ➞ | |
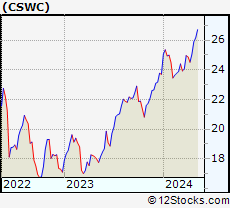 | CSWC Capital Southwest Corporation |
| Sector: Financials | |
| SubSector: Asset Management | |
| MarketCap: 213.703 Millions | |
| Recent Price: 25.69 Smart Investing & Trading Score: 100 | |
| Day Percent Change: 1.10% Day Change: 0.28 | |
| Week Change: 2.51% Year-to-date Change: 8.4% | |
| CSWC Links: Profile News Message Board | |
| Charts:- Daily , Weekly | |
| Add CSWC to Watchlist: View: Get Complete CSWC Trend Analysis ➞ | |
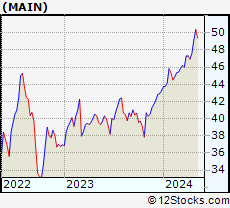 | MAIN Main Street Capital Corporation |
| Sector: Financials | |
| SubSector: Diversified Investments | |
| MarketCap: 1355.7 Millions | |
| Recent Price: 48.69 Smart Investing & Trading Score: 100 | |
| Day Percent Change: 1.10% Day Change: 0.53 | |
| Week Change: 2.25% Year-to-date Change: 12.6% | |
| MAIN Links: Profile News Message Board | |
| Charts:- Daily , Weekly | |
| Add MAIN to Watchlist: View: Get Complete MAIN Trend Analysis ➞ | |
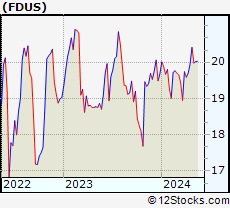 | FDUS Fidus Investment Corporation |
| Sector: Financials | |
| SubSector: Asset Management | |
| MarketCap: 161.003 Millions | |
| Recent Price: 20.34 Smart Investing & Trading Score: 100 | |
| Day Percent Change: 1.09% Day Change: 0.22 | |
| Week Change: 1.9% Year-to-date Change: 3.3% | |
| FDUS Links: Profile News Message Board | |
| Charts:- Daily , Weekly | |
| Add FDUS to Watchlist: View: Get Complete FDUS Trend Analysis ➞ | |
 | BRT BRT Apartments Corp. |
| Sector: Financials | |
| SubSector: Mortgage Investment | |
| MarketCap: 163.239 Millions | |
| Recent Price: 17.94 Smart Investing & Trading Score: 100 | |
| Day Percent Change: 1.07% Day Change: 0.19 | |
| Week Change: 3.28% Year-to-date Change: -3.5% | |
| BRT Links: Profile News Message Board | |
| Charts:- Daily , Weekly | |
| Add BRT to Watchlist: View: Get Complete BRT Trend Analysis ➞ | |
 | PRK Park National Corporation |
| Sector: Financials | |
| SubSector: Regional - Midwest Banks | |
| MarketCap: 1416.6 Millions | |
| Recent Price: 135.31 Smart Investing & Trading Score: 100 | |
| Day Percent Change: 1.06% Day Change: 1.42 | |
| Week Change: 5.7% Year-to-date Change: 1.8% | |
| PRK Links: Profile News Message Board | |
| Charts:- Daily , Weekly | |
| Add PRK to Watchlist: View: Get Complete PRK Trend Analysis ➞ | |
 | CFR Cullen/Frost Bankers, Inc. |
| Sector: Financials | |
| SubSector: Regional - Southwest Banks | |
| MarketCap: 3536.75 Millions | |
| Recent Price: 114.45 Smart Investing & Trading Score: 100 | |
| Day Percent Change: 1.04% Day Change: 1.18 | |
| Week Change: 2.6% Year-to-date Change: 5.5% | |
| CFR Links: Profile News Message Board | |
| Charts:- Daily , Weekly | |
| Add CFR to Watchlist: View: Get Complete CFR Trend Analysis ➞ | |
 | CHCT Community Healthcare Trust Incorporated |
| Sector: Financials | |
| SubSector: REIT - Healthcare Facilities | |
| MarketCap: 698.614 Millions | |
| Recent Price: 25.96 Smart Investing & Trading Score: 100 | |
| Day Percent Change: 1.01% Day Change: 0.26 | |
| Week Change: 1.76% Year-to-date Change: -2.6% | |
| CHCT Links: Profile News Message Board | |
| Charts:- Daily , Weekly | |
| Add CHCT to Watchlist: View: Get Complete CHCT Trend Analysis ➞ | |
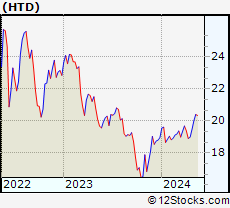 | HTD John Hancock Tax-Advantaged Dividend Income Fund |
| Sector: Financials | |
| SubSector: Closed-End Fund - Debt | |
| MarketCap: 467.107 Millions | |
| Recent Price: 19.61 Smart Investing & Trading Score: 100 | |
| Day Percent Change: 0.98% Day Change: 0.19 | |
| Week Change: 3.26% Year-to-date Change: 3.4% | |
| HTD Links: Profile News Message Board | |
| Charts:- Daily , Weekly | |
| Add HTD to Watchlist: View: Get Complete HTD Trend Analysis ➞ | |
 | AVB AvalonBay Communities, Inc. |
| Sector: Financials | |
| SubSector: REIT - Residential | |
| MarketCap: 19921.9 Millions | |
| Recent Price: 188.66 Smart Investing & Trading Score: 100 | |
| Day Percent Change: 0.96% Day Change: 1.79 | |
| Week Change: 2.46% Year-to-date Change: 0.8% | |
| AVB Links: Profile News Message Board | |
| Charts:- Daily , Weekly | |
| Add AVB to Watchlist: View: Get Complete AVB Trend Analysis ➞ | |
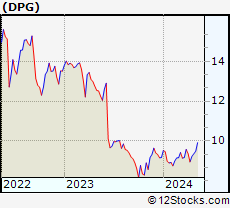 | DPG Duff & Phelps Utility and Infrastructure Fund Inc. |
| Sector: Financials | |
| SubSector: Closed-End Fund - Equity | |
| MarketCap: 301.147 Millions | |
| Recent Price: 9.46 Smart Investing & Trading Score: 100 | |
| Day Percent Change: 0.96% Day Change: 0.09 | |
| Week Change: 2.49% Year-to-date Change: 3.2% | |
| DPG Links: Profile News Message Board | |
| Charts:- Daily , Weekly | |
| Add DPG to Watchlist: View: Get Complete DPG Trend Analysis ➞ | |
 | NXRT NexPoint Residential Trust, Inc. |
| Sector: Financials | |
| SubSector: REIT - Residential | |
| MarketCap: 839.161 Millions | |
| Recent Price: 33.02 Smart Investing & Trading Score: 100 | |
| Day Percent Change: 0.95% Day Change: 0.31 | |
| Week Change: 2.83% Year-to-date Change: -4.1% | |
| NXRT Links: Profile News Message Board | |
| Charts:- Daily , Weekly | |
| Add NXRT to Watchlist: View: Get Complete NXRT Trend Analysis ➞ | |
| For tabular summary view of above stock list: Summary View ➞ 0 - 25 , 25 - 50 , 50 - 75 , 75 - 100 , 100 - 125 , 125 - 150 , 150 - 175 , 175 - 200 , 200 - 225 , 225 - 250 , 250 - 275 , 275 - 300 , 300 - 325 , 325 - 350 , 350 - 375 , 375 - 400 , 400 - 425 , 425 - 450 , 450 - 475 , 475 - 500 , 500 - 525 , 525 - 550 , 550 - 575 , 575 - 600 , 600 - 625 , 625 - 650 , 650 - 675 , 675 - 700 , 700 - 725 , 725 - 750 , 750 - 775 , 775 - 800 , 800 - 825 , 825 - 850 , 850 - 875 , 875 - 900 , 900 - 925 , 925 - 950 , 950 - 975 , 975 - 1000 , 1000 - 1025 , 1025 - 1050 , 1050 - 1075 , 1075 - 1100 , 1100 - 1125 , 1125 - 1150 , 1150 - 1175 , 1175 - 1200 , 1200 - 1225 , 1225 - 1250 | ||
| Click To Change The Sort Order: By Market Cap or Company Size Performance: Year-to-date, Week and Day | |
| Select Chart Type: | ||
|
Best Stocks Today 12Stocks.com |
© 2024 12Stocks.com Terms & Conditions Privacy Contact Us
All Information Provided Only For Education And Not To Be Used For Investing or Trading. See Terms & Conditions


One More Thing ... Get Best Stocks Delivered Daily!
Never Ever Miss A Move With Our Top Ten Stocks Lists
Find Best Stocks In Any Market - Bull or Bear Market
Take A Peek At Our Top Ten Stocks Lists: Daily, Weekly, Year-to-Date & Top Trends
Find Best Stocks In Any Market - Bull or Bear Market
Take A Peek At Our Top Ten Stocks Lists: Daily, Weekly, Year-to-Date & Top Trends
Financial Stocks With Best Up Trends [0-bearish to 100-bullish]: Enova [100], Piedmont Office[100], Equity Bancshares[100], Cadence Ban[100], CVB [100], Jackson [100], NBT Bancorp[100], Victory Capital[100], RLI [100], Hagerty [100], Popular [100]
Best Financial Stocks Year-to-Date:
Root [465.14%], Hippo [134.14%], Gladstone Capital[98.97%], Banco Macro[81.43%], Grupo Financiero[76.83%], Banco BBVA[72.79%], Yiren Digital[60.9%], Heritage Insurance[56.44%], Fidelis Insurance[55.2%], First [52.15%], Mercury General[52.13%] Best Financial Stocks This Week:
Oportun [35.78%], Cipher Mining[25%], Root [14.36%], Globe Life[13.52%], Iris Energy[12.73%], Coinbase Global[12.04%], Grupo Supervielle[10.55%], Franklin Street[10.11%], KB [9.93%], Banco BBVA[9.68%], LendingTree [9.55%] Best Financial Stocks Daily:
Oportun [40.00%], Globe Life[14.11%], Franklin Street[10.70%], Root [8.63%], Lemonade [8.23%], Uniti [8.10%], Heritage Insurance[7.37%], Stone Harbor[6.03%], Rocket [5.51%], Sierra Bancorp[5.44%], MicroSectors Gold[5.35%]