
 Login Sign Up


| |||||
 |  | ||||

| 12Stocks.com Market Intelligence |
Best Financial Stocks
| In a hurry? Financial Stocks Lists: Performance Trends Table, Stock Charts
Sort Financial stocks: Daily, Weekly, Year-to-Date, Market Cap & Trends. Filter Financial stocks list by size:All Financial Large Mid-Range Small & MicroCap |
| 12Stocks.com Financial Stocks Performances & Trends Daily | |||||||||
|
|  The overall Smart Investing & Trading Score is 75 (0-bearish to 100-bullish) which puts Financial sector in short term neutral to bullish trend. The Smart Investing & Trading Score from previous trading session is 70 and hence an improvement of trend.
| ||||||||
Here are the Smart Investing & Trading Scores of the most requested Financial stocks at 12Stocks.com (click stock name for detailed review):
|

| 12Stocks.com: Investing in Financial sector with Stocks | |
|
The following table helps investors and traders sort through current performance and trends (as measured by Smart Investing & Trading Score) of various
stocks in the Financial sector. Quick View: Move mouse or cursor over stock symbol (ticker) to view short-term Technical chart and over stock name to view long term chart. Click on  to add stock symbol to your watchlist and to add stock symbol to your watchlist and  to view watchlist. Click on any ticker or stock name for detailed market intelligence report for that stock. to view watchlist. Click on any ticker or stock name for detailed market intelligence report for that stock. |
12Stocks.com Performance of Stocks in Financial Sector
| Ticker | Stock Name | Watchlist | Category | Recent Price | Trend Score | Change % | YTD Change% |
| CRBG | Corebridge |   | Asset Mgmt | 27.13 | 68 | 0.18% | 25.14% |
| BNS | Bank of Nova Scotia | | Banks | 47.16 | 68 | 0.14% | -3.15% |
| NDAQ | Nasdaq | | Investments | 61.26 | 68 | 0.10% | 5.37% |
| LYG | Lloyds Banking | | Foreign Banks | 2.53 | 68 | 0.00% | 5.86% |
| STHO | Star | | Financials Services | 12.04 | 68 | -0.08% | -19.71% |
| AACT | Ares Acquisition | | SPAC | 10.62 | 68 | 0.09% | 1.92% |
| PGRE | Paramount | | Property Mgmt | 4.73 | 67 | 2.60% | -8.51% |
| FNF | Fidelity National | | Insurance | 50.28 | 67 | 1.70% | -1.45% |
| VRTS | Virtus | | Asset Mgmt | 235.07 | 67 | 1.42% | -2.77% |
| ROIC | Retail Opportunity | | REIT - Retail | 12.53 | 67 | 1.01% | -10.73% |
| ITIC | Investors Title | | Insurance | 161.22 | 67 | 0.01% | -0.57% |
| FCCO | First Community | | Regional - Southwest Banks | 16.89 | 67 | -0.71% | -21.55% |
| LND | BrasilAgro - | | Property Mgmt | 4.96 | 67 | -0.20% | -6.06% |
| MPB | Mid Penn | | Regional Banks | 20.43 | 67 | -0.05% | -15.86% |
| OCFC | OceanFirst | | S&L | 15.40 | 67 | 2.84% | -11.26% |
| BSRR | Sierra Bancorp | | Regional Banks | 19.46 | 67 | 2.80% | -13.70% |
| FISI | Institutions | | Regional Banks | 17.74 | 67 | 2.25% | -16.71% |
| EGBN | Eagle Bancorp | | Regional Banks | 22.29 | 67 | 2.25% | -26.05% |
| RBCAA | Republic Bancorp | | Regional Banks | 50.16 | 67 | 2.18% | -9.06% |
| FBNC | First Bancorp | | Regional Banks | 33.91 | 67 | 2.06% | -8.39% |
| PPBI | Pacific Premier | | Regional Banks | 22.56 | 67 | 1.94% | -22.50% |
| NBHC | National Bank | | Regional Banks | 34.63 | 67 | 1.94% | -6.88% |
| FBRT | Franklin BSP | | REIT - Mortgage | 12.69 | 67 | 1.85% | -6.89% |
| BANR | Banner | | Regional Banks | 46.03 | 67 | 1.79% | -14.06% |
| CVBF | CVB | | Regional Banks | 16.75 | 67 | 1.73% | -17.01% |
| For chart view version of above stock list: Chart View ➞ 0 - 25 , 25 - 50 , 50 - 75 , 75 - 100 , 100 - 125 , 125 - 150 , 150 - 175 , 175 - 200 , 200 - 225 , 225 - 250 , 250 - 275 , 275 - 300 , 300 - 325 , 325 - 350 , 350 - 375 , 375 - 400 , 400 - 425 , 425 - 450 , 450 - 475 , 475 - 500 , 500 - 525 , 525 - 550 , 550 - 575 , 575 - 600 , 600 - 625 , 625 - 650 , 650 - 675 , 675 - 700 , 700 - 725 , 725 - 750 , 750 - 775 , 775 - 800 , 800 - 825 , 825 - 850 | ||
 | Click To Change The Sort Order: By Market Cap or Company Size Performance: Year-to-date, Week and Day |  |
|
Get the most comprehensive stock market coverage daily at 12Stocks.com ➞ Best Stocks Today ➞ Best Stocks Weekly ➞ Best Stocks Year-to-Date ➞ Best Stocks Trends ➞  Best Stocks Today 12Stocks.com Best Nasdaq Stocks ➞ Best S&P 500 Stocks ➞ Best Tech Stocks ➞ Best Biotech Stocks ➞ |
| Detailed Overview of Financial Stocks |
| Financial Technical Overview, Leaders & Laggards, Top Financial ETF Funds & Detailed Financial Stocks List, Charts, Trends & More |
| Financial Sector: Technical Analysis, Trends & YTD Performance | |
| Financial sector is composed of stocks
from banks, brokers, insurance, REITs
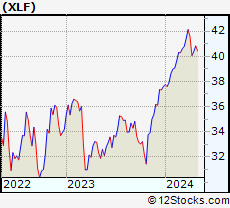
and services subsectors. Financial sector, as represented by XLF, an exchange-traded fund [ETF] that holds basket of Financial stocks (e.g, Bank of America, Goldman Sachs) is up by 9.31% and is currently outperforming the overall market by 3.82% year-to-date. Below is a quick view of Technical charts and trends: |
|
 XLF Weekly Chart |
|
| Long Term Trend: Very Good | |
| Medium Term Trend: Not Good | |
 XLF Daily Chart |
|
| Short Term Trend: Very Good | |
| Overall Trend Score: 75 | |
| YTD Performance: 9.31% | |
| **Trend Scores & Views Are Only For Educational Purposes And Not For Investing | |
| 12Stocks.com: Top Performing Financial Sector Stocks | ||||||||||||||||||||||||||||||||||||||||||||||||
 The top performing Financial sector stocks year to date are
Now, more recently, over last week, the top performing Financial sector stocks on the move are


|
||||||||||||||||||||||||||||||||||||||||||||||||
| 12Stocks.com: Investing in Financial Sector using Exchange Traded Funds | |
|
The following table shows list of key exchange traded funds (ETF) that
help investors track Financial Index. For detailed view, check out our ETF Funds section of our website. Quick View: Move mouse or cursor over ETF symbol (ticker) to view short-term Technical chart and over ETF name to view long term chart. Click on ticker or stock name for detailed view. Click on to add stock symbol to your watchlist and to view watchlist. |
12Stocks.com List of ETFs that track Financial Index
| Ticker | ETF Name | Watchlist | Recent Price | Smart Investing & Trading Score | Change % | Week % | Year-to-date % |
| XLF | Financial | | 41.10 | 75 | 0.56 | 1.78 | 9.31% |
| IAI | Broker-Dealers & Secs | | 113.16 | 75 | 0.25 | 1.92 | 4.27% |
| IYF | Financials | | 93.14 | 75 | 0.51 | 2.02 | 9.05% |
| IYG | Financial Services | | 64.83 | 75 | 0.71 | 2.23 | 8.53% |
| KRE | Regional Banking | | 48.84 | 74 | 2.33 | 3.22 | -6.84% |
| IXG | Global Financials | | 84.47 | 75 | 0.55 | 1.94 | 7.49% |
| VFH | Financials | | 99.84 | 75 | 1.56 | 2.14 | 8.22% |
| KBE | Bank | | 45.75 | 100 | 1.28 | 3.02 | -0.59% |
| FAS | Financial Bull 3X | | 103.04 | 75 | 1.42 | 5.21 | 24.66% |
| FAZ | Financial Bear 3X | | 10.56 | 25 | -2.00 | -5.76 | -22.79% |
| UYG | Financials | | 64.85 | 75 | 1.52 | 3.86 | 17.48% |
| IAT | Regional Banks | | 41.97 | 93 | 1.00 | 3.01 | 0.3% |
| KIE | Insurance | | 49.76 | 70 | 0.60 | 1.38 | 10.03% |
| PSCF | SmallCap Financials | | 46.24 | 52 | -0.01 | 1.69 | -5.99% |
| EUFN | Europe Financials | | 22.59 | 75 | 1.92 | 2.89 | 7.75% |
| PGF | Financial Preferred | | 14.66 | 32 | 1.00 | 0.93 | 0.58% |
| 12Stocks.com: Charts, Trends, Fundamental Data and Performances of Financial Stocks | |
|
We now take in-depth look at all Financial stocks including charts, multi-period performances and overall trends (as measured by Smart Investing & Trading Score). One can sort Financial stocks (click link to choose) by Daily, Weekly and by Year-to-Date performances. Also, one can sort by size of the company or by market capitalization. |
| Select Your Default Chart Type: | |||||
| |||||
| Click on stock symbol or name for detailed view. Click on to add stock symbol to your watchlist and to view watchlist. Quick View: Move mouse or cursor over "Daily" to quickly view daily Technical stock chart and over "Weekly" to view weekly Technical stock chart. | |||||

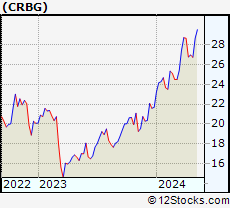 | CRBG Corebridge Financial, Inc. |
| Sector: Financials | |
| SubSector: Asset Management | |
| MarketCap: 11170 Millions | |
| Recent Price: 27.13 Smart Investing & Trading Score: 68 | |
| Day Percent Change: 0.18% Day Change: 0.05 | |
| Week Change: 0.56% Year-to-date Change: 25.1% | |
| CRBG Links: Profile News Message Board | |
| Charts:- Daily , Weekly | |
| Add CRBG to Watchlist: View: Get Complete CRBG Trend Analysis ➞ | |
 | BNS The Bank of Nova Scotia |
| Sector: Financials | |
| SubSector: Money Center Banks | |
| MarketCap: 48742.1 Millions | |
| Recent Price: 47.16 Smart Investing & Trading Score: 68 | |
| Day Percent Change: 0.14% Day Change: 0.06 | |
| Week Change: 0.89% Year-to-date Change: -3.2% | |
| BNS Links: Profile News Message Board | |
| Charts:- Daily , Weekly | |
| Add BNS to Watchlist: View: Get Complete BNS Trend Analysis ➞ | |
 | NDAQ Nasdaq, Inc. |
| Sector: Financials | |
| SubSector: Diversified Investments | |
| MarketCap: 14885.2 Millions | |
| Recent Price: 61.26 Smart Investing & Trading Score: 68 | |
| Day Percent Change: 0.10% Day Change: 0.06 | |
| Week Change: 1.51% Year-to-date Change: 5.4% | |
| NDAQ Links: Profile News Message Board | |
| Charts:- Daily , Weekly | |
| Add NDAQ to Watchlist: View: Get Complete NDAQ Trend Analysis ➞ | |
 | LYG Lloyds Banking Group plc |
| Sector: Financials | |
| SubSector: Foreign Money Center Banks | |
| MarketCap: 28885.4 Millions | |
| Recent Price: 2.53 Smart Investing & Trading Score: 68 | |
| Day Percent Change: 0.00% Day Change: 0.00 | |
| Week Change: 0.4% Year-to-date Change: 5.9% | |
| LYG Links: Profile News Message Board | |
| Charts:- Daily , Weekly | |
| Add LYG to Watchlist: View: Get Complete LYG Trend Analysis ➞ | |
 | STHO Star Holdings |
| Sector: Financials | |
| SubSector: Financials Services | |
| MarketCap: 195 Millions | |
| Recent Price: 12.04 Smart Investing & Trading Score: 68 | |
| Day Percent Change: -0.08% Day Change: -0.01 | |
| Week Change: 1.6% Year-to-date Change: -19.7% | |
| STHO Links: Profile News Message Board | |
| Charts:- Daily , Weekly | |
| Add STHO to Watchlist: View: Get Complete STHO Trend Analysis ➞ | |
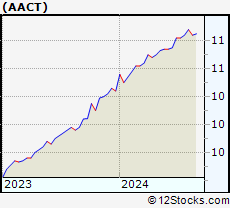 | AACT Ares Acquisition Corporation II |
| Sector: Financials | |
| SubSector: SPAC | |
| MarketCap: 639 Millions | |
| Recent Price: 10.62 Smart Investing & Trading Score: 68 | |
| Day Percent Change: 0.09% Day Change: 0.01 | |
| Week Change: 0.09% Year-to-date Change: 1.9% | |
| AACT Links: Profile News Message Board | |
| Charts:- Daily , Weekly | |
| Add AACT to Watchlist: View: Get Complete AACT Trend Analysis ➞ | |
 | PGRE Paramount Group, Inc. |
| Sector: Financials | |
| SubSector: Property Management | |
| MarketCap: 1722.72 Millions | |
| Recent Price: 4.73 Smart Investing & Trading Score: 67 | |
| Day Percent Change: 2.60% Day Change: 0.12 | |
| Week Change: 3.5% Year-to-date Change: -8.5% | |
| PGRE Links: Profile News Message Board | |
| Charts:- Daily , Weekly | |
| Add PGRE to Watchlist: View: Get Complete PGRE Trend Analysis ➞ | |
 | FNF Fidelity National Financial, Inc. |
| Sector: Financials | |
| SubSector: Surety & Title Insurance | |
| MarketCap: 6532.18 Millions | |
| Recent Price: 50.28 Smart Investing & Trading Score: 67 | |
| Day Percent Change: 1.70% Day Change: 0.84 | |
| Week Change: 3.1% Year-to-date Change: -1.5% | |
| FNF Links: Profile News Message Board | |
| Charts:- Daily , Weekly | |
| Add FNF to Watchlist: View: Get Complete FNF Trend Analysis ➞ | |
 | VRTS Virtus Investment Partners, Inc. |
| Sector: Financials | |
| SubSector: Asset Management | |
| MarketCap: 601.303 Millions | |
| Recent Price: 235.07 Smart Investing & Trading Score: 67 | |
| Day Percent Change: 1.42% Day Change: 3.29 | |
| Week Change: 4.32% Year-to-date Change: -2.8% | |
| VRTS Links: Profile News Message Board | |
| Charts:- Daily , Weekly | |
| Add VRTS to Watchlist: View: Get Complete VRTS Trend Analysis ➞ | |
 | ROIC Retail Opportunity Investments Corp. |
| Sector: Financials | |
| SubSector: REIT - Retail | |
| MarketCap: 943.414 Millions | |
| Recent Price: 12.53 Smart Investing & Trading Score: 67 | |
| Day Percent Change: 1.01% Day Change: 0.13 | |
| Week Change: 2% Year-to-date Change: -10.7% | |
| ROIC Links: Profile News Message Board | |
| Charts:- Daily , Weekly | |
| Add ROIC to Watchlist: View: Get Complete ROIC Trend Analysis ➞ | |
 | ITIC Investors Title Company |
| Sector: Financials | |
| SubSector: Surety & Title Insurance | |
| MarketCap: 219.518 Millions | |
| Recent Price: 161.22 Smart Investing & Trading Score: 67 | |
| Day Percent Change: 0.01% Day Change: 0.02 | |
| Week Change: -0.29% Year-to-date Change: -0.6% | |
| ITIC Links: Profile News Message Board | |
| Charts:- Daily , Weekly | |
| Add ITIC to Watchlist: View: Get Complete ITIC Trend Analysis ➞ | |
 | FCCO First Community Corporation |
| Sector: Financials | |
| SubSector: Regional - Southwest Banks | |
| MarketCap: 123.865 Millions | |
| Recent Price: 16.89 Smart Investing & Trading Score: 67 | |
| Day Percent Change: -0.71% Day Change: -0.12 | |
| Week Change: 5.56% Year-to-date Change: -21.6% | |
| FCCO Links: Profile News Message Board | |
| Charts:- Daily , Weekly | |
| Add FCCO to Watchlist: View: Get Complete FCCO Trend Analysis ➞ | |
 | LND BrasilAgro - Companhia Brasileira de Propriedades Agricolas |
| Sector: Financials | |
| SubSector: Property Management | |
| MarketCap: 157.842 Millions | |
| Recent Price: 4.96 Smart Investing & Trading Score: 67 | |
| Day Percent Change: -0.20% Day Change: -0.01 | |
| Week Change: -1% Year-to-date Change: -6.1% | |
| LND Links: Profile News Message Board | |
| Charts:- Daily , Weekly | |
| Add LND to Watchlist: View: Get Complete LND Trend Analysis ➞ | |
 | MPB Mid Penn Bancorp, Inc. |
| Sector: Financials | |
| SubSector: Regional - Northeast Banks | |
| MarketCap: 187.699 Millions | |
| Recent Price: 20.43 Smart Investing & Trading Score: 67 | |
| Day Percent Change: -0.05% Day Change: -0.01 | |
| Week Change: -0.34% Year-to-date Change: -15.9% | |
| MPB Links: Profile News Message Board | |
| Charts:- Daily , Weekly | |
| Add MPB to Watchlist: View: Get Complete MPB Trend Analysis ➞ | |
 | OCFC OceanFirst Financial Corp. |
| Sector: Financials | |
| SubSector: Savings & Loans | |
| MarketCap: 867.43 Millions | |
| Recent Price: 15.40 Smart Investing & Trading Score: 67 | |
| Day Percent Change: 2.84% Day Change: 0.42 | |
| Week Change: 1.48% Year-to-date Change: -11.3% | |
| OCFC Links: Profile News Message Board | |
| Charts:- Daily , Weekly | |
| Add OCFC to Watchlist: View: Get Complete OCFC Trend Analysis ➞ | |
 | BSRR Sierra Bancorp |
| Sector: Financials | |
| SubSector: Regional - Pacific Banks | |
| MarketCap: 256.929 Millions | |
| Recent Price: 19.46 Smart Investing & Trading Score: 67 | |
| Day Percent Change: 2.80% Day Change: 0.53 | |
| Week Change: 3.79% Year-to-date Change: -13.7% | |
| BSRR Links: Profile News Message Board | |
| Charts:- Daily , Weekly | |
| Add BSRR to Watchlist: View: Get Complete BSRR Trend Analysis ➞ | |
 | FISI Financial Institutions, Inc. |
| Sector: Financials | |
| SubSector: Regional - Mid-Atlantic Banks | |
| MarketCap: 253.459 Millions | |
| Recent Price: 17.74 Smart Investing & Trading Score: 67 | |
| Day Percent Change: 2.25% Day Change: 0.39 | |
| Week Change: 2.19% Year-to-date Change: -16.7% | |
| FISI Links: Profile News Message Board | |
| Charts:- Daily , Weekly | |
| Add FISI to Watchlist: View: Get Complete FISI Trend Analysis ➞ | |
 | EGBN Eagle Bancorp, Inc. |
| Sector: Financials | |
| SubSector: Regional - Mid-Atlantic Banks | |
| MarketCap: 906.559 Millions | |
| Recent Price: 22.29 Smart Investing & Trading Score: 67 | |
| Day Percent Change: 2.25% Day Change: 0.49 | |
| Week Change: 3.1% Year-to-date Change: -26.1% | |
| EGBN Links: Profile News Message Board | |
| Charts:- Daily , Weekly | |
| Add EGBN to Watchlist: View: Get Complete EGBN Trend Analysis ➞ | |
 | RBCAA Republic Bancorp, Inc. |
| Sector: Financials | |
| SubSector: Regional - Southeast Banks | |
| MarketCap: 671.835 Millions | |
| Recent Price: 50.16 Smart Investing & Trading Score: 67 | |
| Day Percent Change: 2.18% Day Change: 1.07 | |
| Week Change: 0.56% Year-to-date Change: -9.1% | |
| RBCAA Links: Profile News Message Board | |
| Charts:- Daily , Weekly | |
| Add RBCAA to Watchlist: View: Get Complete RBCAA Trend Analysis ➞ | |
 | FBNC First Bancorp |
| Sector: Financials | |
| SubSector: Regional - Mid-Atlantic Banks | |
| MarketCap: 664.959 Millions | |
| Recent Price: 33.91 Smart Investing & Trading Score: 67 | |
| Day Percent Change: 2.06% Day Change: 0.69 | |
| Week Change: 4.94% Year-to-date Change: -8.4% | |
| FBNC Links: Profile News Message Board | |
| Charts:- Daily , Weekly | |
| Add FBNC to Watchlist: View: Get Complete FBNC Trend Analysis ➞ | |
 | PPBI Pacific Premier Bancorp, Inc. |
| Sector: Financials | |
| SubSector: Regional - Pacific Banks | |
| MarketCap: 978.029 Millions | |
| Recent Price: 22.56 Smart Investing & Trading Score: 67 | |
| Day Percent Change: 1.94% Day Change: 0.43 | |
| Week Change: 1.3% Year-to-date Change: -22.5% | |
| PPBI Links: Profile News Message Board | |
| Charts:- Daily , Weekly | |
| Add PPBI to Watchlist: View: Get Complete PPBI Trend Analysis ➞ | |
 | NBHC National Bank Holdings Corporation |
| Sector: Financials | |
| SubSector: Regional - Midwest Banks | |
| MarketCap: 766.87 Millions | |
| Recent Price: 34.63 Smart Investing & Trading Score: 67 | |
| Day Percent Change: 1.94% Day Change: 0.66 | |
| Week Change: 1.88% Year-to-date Change: -6.9% | |
| NBHC Links: Profile News Message Board | |
| Charts:- Daily , Weekly | |
| Add NBHC to Watchlist: View: Get Complete NBHC Trend Analysis ➞ | |
 | FBRT Franklin BSP Realty Trust, Inc. |
| Sector: Financials | |
| SubSector: REIT - Mortgage | |
| MarketCap: 1170 Millions | |
| Recent Price: 12.69 Smart Investing & Trading Score: 67 | |
| Day Percent Change: 1.85% Day Change: 0.23 | |
| Week Change: 0.95% Year-to-date Change: -6.9% | |
| FBRT Links: Profile News Message Board | |
| Charts:- Daily , Weekly | |
| Add FBRT to Watchlist: View: Get Complete FBRT Trend Analysis ➞ | |
 | BANR Banner Corporation |
| Sector: Financials | |
| SubSector: Regional - Mid-Atlantic Banks | |
| MarketCap: 1187.09 Millions | |
| Recent Price: 46.03 Smart Investing & Trading Score: 67 | |
| Day Percent Change: 1.79% Day Change: 0.81 | |
| Week Change: 2.43% Year-to-date Change: -14.1% | |
| BANR Links: Profile News Message Board | |
| Charts:- Daily , Weekly | |
| Add BANR to Watchlist: View: Get Complete BANR Trend Analysis ➞ | |
 | CVBF CVB Financial Corp. |
| Sector: Financials | |
| SubSector: Regional - Pacific Banks | |
| MarketCap: 2699.99 Millions | |
| Recent Price: 16.75 Smart Investing & Trading Score: 67 | |
| Day Percent Change: 1.73% Day Change: 0.29 | |
| Week Change: 0.75% Year-to-date Change: -17.0% | |
| CVBF Links: Profile News Message Board | |
| Charts:- Daily , Weekly | |
| Add CVBF to Watchlist: View: Get Complete CVBF Trend Analysis ➞ | |
| For tabular summary view of above stock list: Summary View ➞ 0 - 25 , 25 - 50 , 50 - 75 , 75 - 100 , 100 - 125 , 125 - 150 , 150 - 175 , 175 - 200 , 200 - 225 , 225 - 250 , 250 - 275 , 275 - 300 , 300 - 325 , 325 - 350 , 350 - 375 , 375 - 400 , 400 - 425 , 425 - 450 , 450 - 475 , 475 - 500 , 500 - 525 , 525 - 550 , 550 - 575 , 575 - 600 , 600 - 625 , 625 - 650 , 650 - 675 , 675 - 700 , 700 - 725 , 725 - 750 , 750 - 775 , 775 - 800 , 800 - 825 , 825 - 850 | ||
| Click To Change The Sort Order: By Market Cap or Company Size Performance: Year-to-date, Week and Day | |
| Select Chart Type: | ||
|
Best Stocks Today 12Stocks.com |
© 2024 12Stocks.com Terms & Conditions Privacy Contact Us
All Information Provided Only For Education And Not To Be Used For Investing or Trading. See Terms & Conditions


One More Thing ... Get Best Stocks Delivered Daily!
Never Ever Miss A Move With Our Top Ten Stocks Lists
Find Best Stocks In Any Market - Bull or Bear Market
Take A Peek At Our Top Ten Stocks Lists: Daily, Weekly, Year-to-Date & Top Trends
Find Best Stocks In Any Market - Bull or Bear Market
Take A Peek At Our Top Ten Stocks Lists: Daily, Weekly, Year-to-Date & Top Trends
Financial Stocks With Best Up Trends [0-bearish to 100-bullish]: NBT Bancorp[100], Peoples Bancorp[100], Piedmont Office[100], Preferred Bank[100], RLI [100], Popular [100], Equity Bancshares[100], Highwoods Properties[100], Banco Santander[100], BOK [100], Heartland [100]
Best Financial Stocks Year-to-Date:
Hippo [129.8%], Banco Macro[83.68%], Grupo Financiero[80.94%], Yiren Digital[61.22%], Grupo Supervielle[54.93%], Heritage Insurance[54.52%], Fidelis Insurance[53.46%], EverQuote [52.7%], First [51.11%], Mercury General[50.13%], GEO [39.75%] Best Financial Stocks This Week:
Cipher Mining[23.83%], Grupo Supervielle[14.36%], Iris Energy[13.74%], Coinbase Global[12.08%], ServisFirst Bancshares[10.36%], Grupo Financiero[9.77%], Peakstone Realty[9.39%], KB [9.26%], LendingTree [9.14%], Hywin [8.88%], New York[7.97%] Best Financial Stocks Daily:
ServisFirst Bancshares[8.42%], Franklin Street[6.26%], Heritage Insurance[6.05%], Peakstone Realty[5.54%], Fanhua [5.14%], Upstart [4.98%], LendingTree [4.84%], TrustCo Bank[4.78%], Coinbase Global[4.68%], NBT Bancorp[4.51%], Dime Community[4.51%]