
 Login Sign Up


| |||||
 |  | ||||

| 12Stocks.com Market Intelligence |
Best Financial Stocks
| In a hurry? Financial Stocks Lists: Performance Trends Table, Stock Charts
Sort Financial stocks: Daily, Weekly, Year-to-Date, Market Cap & Trends. Filter Financial stocks list by size:All Financial Large Mid-Range Small & MicroCap |
| 12Stocks.com Financial Stocks Performances & Trends Daily | |||||||||
|
|  The overall Smart Investing & Trading Score is 56 (0-bearish to 100-bullish) which puts Financial sector in short term neutral trend. The Smart Investing & Trading Score from previous trading session is 36 and hence an improvement of trend.
| ||||||||
Here are the Smart Investing & Trading Scores of the most requested Financial stocks at 12Stocks.com (click stock name for detailed review):
|


| 12Stocks.com: Investing in Financial sector with Stocks | |
|
The following table helps investors and traders sort through current performance and trends (as measured by Smart Investing & Trading Score) of various
stocks in the Financial sector. Quick View: Move mouse or cursor over stock symbol (ticker) to view short-term Technical chart and over stock name to view long term chart. Click on  to add stock symbol to your watchlist and to add stock symbol to your watchlist and  to view watchlist. Click on any ticker or stock name for detailed market intelligence report for that stock. to view watchlist. Click on any ticker or stock name for detailed market intelligence report for that stock. |
12Stocks.com Performance of Stocks in Financial Sector
| Ticker | Stock Name | Watchlist | Category | Recent Price | Trend Score | Change % | YTD Change% |
| MTG | MGIC |   | Insurance | 19.58 | 18 | 1.03% | 1.50% |
| AROW | Arrow | | Regional Banks | 21.93 | 18 | 1.01% | -21.51% |
| CFFN | Capitol Federal | | S&L | 5.17 | 18 | 0.98% | -19.84% |
| BEN | Franklin Resources | | Asset Mgmt | 25.02 | 18 | 0.85% | -16.01% |
| MKTX | MarketAxess | | Brokerage | 203.24 | 18 | 0.65% | -30.60% |
| FISI | Institutions | | Regional Banks | 16.44 | 18 | 0.61% | -22.82% |
| HTBI | HomeTrust Bancshares | | Regional Banks | 23.97 | 18 | 0.59% | -10.96% |
| VRTS | Virtus | | Asset Mgmt | 219.80 | 18 | 0.56% | -9.08% |
| SRCE | 1st Source | | Regional Banks | 48.02 | 18 | 0.55% | -12.60% |
| HIO | Western Asset | | Closed-End Fund - Debt | 3.75 | 18 | 0.54% | -2.72% |
| CVLY | Codorus Valley | | Regional Banks | 21.46 | 18 | 0.42% | -16.50% |
| ERC | Wells Fargo | | Asset Mgmt | 8.83 | 18 | 0.34% | -6.46% |
| AGNC | AGNC | | Mortgage | 9.07 | 18 | 0.33% | -7.54% |
| HWBK | Hawthorn Bancshares | | Regional Banks | 20.56 | 18 | 0.29% | -18.96% |
| FRBA | First Bank | | Regional Banks | 12.08 | 18 | 0.17% | -17.82% |
| SMMF | Summit | | Regional Banks | 25.06 | 18 | 0.12% | -18.34% |
| DTF | DTF Tax-Free | | Closed-End Fund - Debt | 10.67 | 18 | 0.08% | -0.74% |
| SAR | Saratoga | | Investments | 22.67 | 18 | 0.00% | -12.34% |
| BAM | Brookfield Asset | | Real Estatet | 38.42 | 18 | -1.56% | -4.36% |
| BEKE | KE | | Real Estate Services | 12.75 | 18 | -1.01% | -21.34% |
| RMT | Royce Micro-Cap | | Closed-End Fund - Equity | 8.62 | 18 | -0.81% | -6.71% |
| PFIS | Peoples | | Regional Banks | 36.81 | 18 | -0.63% | -24.43% |
| NMT | Nuveen Massachusetts | | Closed-End Fund - Debt | 10.48 | 18 | -0.57% | -0.29% |
| WFH | Direxion Work | | Exchange Traded Fund | 53.21 | 18 | -0.55% | -2.45% |
| AGNCL | AGNC | | REIT - Mortgage | 22.44 | 18 | -0.53% | 2.14% |
| For chart view version of above stock list: Chart View ➞ 0 - 25 , 25 - 50 , 50 - 75 , 75 - 100 , 100 - 125 , 125 - 150 , 150 - 175 , 175 - 200 , 200 - 225 , 225 - 250 , 250 - 275 , 275 - 300 , 300 - 325 , 325 - 350 , 350 - 375 , 375 - 400 , 400 - 425 , 425 - 450 , 450 - 475 , 475 - 500 , 500 - 525 , 525 - 550 , 550 - 575 , 575 - 600 , 600 - 625 , 625 - 650 , 650 - 675 , 675 - 700 , 700 - 725 , 725 - 750 , 750 - 775 , 775 - 800 , 800 - 825 , 825 - 850 , 850 - 875 , 875 - 900 , 900 - 925 , 925 - 950 , 950 - 975 , 975 - 1000 , 1000 - 1025 , 1025 - 1050 , 1050 - 1075 , 1075 - 1100 , 1100 - 1125 , 1125 - 1150 , 1150 - 1175 , 1175 - 1200 , 1200 - 1225 , 1225 - 1250 | ||
 | Click To Change The Sort Order: By Market Cap or Company Size Performance: Year-to-date, Week and Day |  |
|
Get the most comprehensive stock market coverage daily at 12Stocks.com ➞ Best Stocks Today ➞ Best Stocks Weekly ➞ Best Stocks Year-to-Date ➞ Best Stocks Trends ➞  Best Stocks Today 12Stocks.com Best Nasdaq Stocks ➞ Best S&P 500 Stocks ➞ Best Tech Stocks ➞ Best Biotech Stocks ➞ |
| Detailed Overview of Financial Stocks |
| Financial Technical Overview, Leaders & Laggards, Top Financial ETF Funds & Detailed Financial Stocks List, Charts, Trends & More |
| Financial Sector: Technical Analysis, Trends & YTD Performance | |
| Financial sector is composed of stocks
from banks, brokers, insurance, REITs
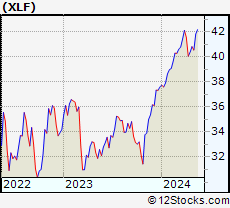
and services subsectors. Financial sector, as represented by XLF, an exchange-traded fund [ETF] that holds basket of Financial stocks (e.g, Bank of America, Goldman Sachs) is up by 5.93% and is currently outperforming the overall market by 1.74% year-to-date. Below is a quick view of Technical charts and trends: |
|
 XLF Weekly Chart |
|
| Long Term Trend: Good | |
| Medium Term Trend: Not Good | |
 XLF Daily Chart |
|
| Short Term Trend: Deteriorating | |
| Overall Trend Score: 56 | |
| YTD Performance: 5.93% | |
| **Trend Scores & Views Are Only For Educational Purposes And Not For Investing | |
| 12Stocks.com: Top Performing Financial Sector Stocks | ||||||||||||||||||||||||||||||||||||||||||||||||
 The top performing Financial sector stocks year to date are
Now, more recently, over last week, the top performing Financial sector stocks on the move are


|
||||||||||||||||||||||||||||||||||||||||||||||||
| 12Stocks.com: Investing in Financial Sector using Exchange Traded Funds | |
|
The following table shows list of key exchange traded funds (ETF) that
help investors track Financial Index. For detailed view, check out our ETF Funds section of our website. Quick View: Move mouse or cursor over ETF symbol (ticker) to view short-term Technical chart and over ETF name to view long term chart. Click on ticker or stock name for detailed view. Click on to add stock symbol to your watchlist and to view watchlist. |
12Stocks.com List of ETFs that track Financial Index
| Ticker | ETF Name | Watchlist | Recent Price | Smart Investing & Trading Score | Change % | Week % | Year-to-date % |
| XLF | Financial | | 39.83 | 56 | 0.35 | -0.57 | 5.93% |
| IAI | Broker-Dealers & Secs | | 110.39 | 56 | 0.04 | -0.4 | 1.71% |
| IYF | Financials | | 90.04 | 48 | 0.61 | -0.56 | 5.42% |
| IYG | Financial Services | | 62.67 | 56 | 0.30 | -0.85 | 4.91% |
| KRE | Regional Banking | | 46.11 | 28 | 0.61 | -0.88 | -12.05% |
| IXG | Global Financials | | 82.50 | 43 | 0.66 | -0.19 | 4.99% |
| VFH | Financials | | 96.40 | 56 | 0.39 | -0.8 | 4.49% |
| KBE | Bank | | 43.40 | 22 | 0.70 | -0.89 | -5.69% |
| FAS | Financial Bull 3X | | 94.14 | 56 | 1.00 | -2.16 | 13.9% |
| FAZ | Financial Bear 3X | | 11.66 | 40 | -0.85 | 2.19 | -14.7% |
| UYG | Financials | | 60.75 | 51 | 0.70 | -1.17 | 10.05% |
| IAT | Regional Banks | | 39.74 | 27 | 0.28 | -1.73 | -5.02% |
| KIE | Insurance | | 48.28 | 51 | 1.17 | -0.08 | 6.77% |
| PSCF | SmallCap Financials | | 44.94 | 22 | 0.18 | -1.03 | -8.62% |
| EUFN | Europe Financials | | 21.86 | 56 | 0.21 | -0.16 | 4.27% |
| PGF | Financial Preferred | | 14.44 | 18 | -0.38 | -1.67 | -0.99% |
| 12Stocks.com: Charts, Trends, Fundamental Data and Performances of Financial Stocks | |
|
We now take in-depth look at all Financial stocks including charts, multi-period performances and overall trends (as measured by Smart Investing & Trading Score). One can sort Financial stocks (click link to choose) by Daily, Weekly and by Year-to-Date performances. Also, one can sort by size of the company or by market capitalization. |
| Select Your Default Chart Type: | |||||
| |||||
| Click on stock symbol or name for detailed view. Click on to add stock symbol to your watchlist and to view watchlist. Quick View: Move mouse or cursor over "Daily" to quickly view daily Technical stock chart and over "Weekly" to view weekly Technical stock chart. | |||||

 | MTG MGIC Investment Corporation |
| Sector: Financials | |
| SubSector: Property & Casualty Insurance | |
| MarketCap: 2521.62 Millions | |
| Recent Price: 19.58 Smart Investing & Trading Score: 18 | |
| Day Percent Change: 1.03% Day Change: 0.20 | |
| Week Change: -0.81% Year-to-date Change: 1.5% | |
| MTG Links: Profile News Message Board | |
| Charts:- Daily , Weekly | |
| Add MTG to Watchlist: View: Get Complete MTG Trend Analysis ➞ | |
 | AROW Arrow Financial Corporation |
| Sector: Financials | |
| SubSector: Regional - Northeast Banks | |
| MarketCap: 413.999 Millions | |
| Recent Price: 21.93 Smart Investing & Trading Score: 18 | |
| Day Percent Change: 1.01% Day Change: 0.22 | |
| Week Change: 0% Year-to-date Change: -21.5% | |
| AROW Links: Profile News Message Board | |
| Charts:- Daily , Weekly | |
| Add AROW to Watchlist: View: Get Complete AROW Trend Analysis ➞ | |
 | CFFN Capitol Federal Financial, Inc. |
| Sector: Financials | |
| SubSector: Savings & Loans | |
| MarketCap: 1639.1 Millions | |
| Recent Price: 5.17 Smart Investing & Trading Score: 18 | |
| Day Percent Change: 0.98% Day Change: 0.05 | |
| Week Change: -2.27% Year-to-date Change: -19.8% | |
| CFFN Links: Profile News Message Board | |
| Charts:- Daily , Weekly | |
| Add CFFN to Watchlist: View: Get Complete CFFN Trend Analysis ➞ | |
 | BEN Franklin Resources, Inc. |
| Sector: Financials | |
| SubSector: Asset Management | |
| MarketCap: 9419.73 Millions | |
| Recent Price: 25.02 Smart Investing & Trading Score: 18 | |
| Day Percent Change: 0.85% Day Change: 0.21 | |
| Week Change: -1.53% Year-to-date Change: -16.0% | |
| BEN Links: Profile News Message Board | |
| Charts:- Daily , Weekly | |
| Add BEN to Watchlist: View: Get Complete BEN Trend Analysis ➞ | |
 | MKTX MarketAxess Holdings Inc. |
| Sector: Financials | |
| SubSector: Investment Brokerage - National | |
| MarketCap: 12431.5 Millions | |
| Recent Price: 203.24 Smart Investing & Trading Score: 18 | |
| Day Percent Change: 0.65% Day Change: 1.31 | |
| Week Change: -4.58% Year-to-date Change: -30.6% | |
| MKTX Links: Profile News Message Board | |
| Charts:- Daily , Weekly | |
| Add MKTX to Watchlist: View: Get Complete MKTX Trend Analysis ➞ | |
 | FISI Financial Institutions, Inc. |
| Sector: Financials | |
| SubSector: Regional - Mid-Atlantic Banks | |
| MarketCap: 253.459 Millions | |
| Recent Price: 16.44 Smart Investing & Trading Score: 18 | |
| Day Percent Change: 0.61% Day Change: 0.10 | |
| Week Change: -2.61% Year-to-date Change: -22.8% | |
| FISI Links: Profile News Message Board | |
| Charts:- Daily , Weekly | |
| Add FISI to Watchlist: View: Get Complete FISI Trend Analysis ➞ | |
 | HTBI HomeTrust Bancshares, Inc. |
| Sector: Financials | |
| SubSector: Regional - Northeast Banks | |
| MarketCap: 238.899 Millions | |
| Recent Price: 23.97 Smart Investing & Trading Score: 18 | |
| Day Percent Change: 0.59% Day Change: 0.14 | |
| Week Change: -0.83% Year-to-date Change: -11.0% | |
| HTBI Links: Profile News Message Board | |
| Charts:- Daily , Weekly | |
| Add HTBI to Watchlist: View: Get Complete HTBI Trend Analysis ➞ | |
 | VRTS Virtus Investment Partners, Inc. |
| Sector: Financials | |
| SubSector: Asset Management | |
| MarketCap: 601.303 Millions | |
| Recent Price: 219.80 Smart Investing & Trading Score: 18 | |
| Day Percent Change: 0.56% Day Change: 1.22 | |
| Week Change: -2.58% Year-to-date Change: -9.1% | |
| VRTS Links: Profile News Message Board | |
| Charts:- Daily , Weekly | |
| Add VRTS to Watchlist: View: Get Complete VRTS Trend Analysis ➞ | |
 | SRCE 1st Source Corporation |
| Sector: Financials | |
| SubSector: Regional - Midwest Banks | |
| MarketCap: 784.77 Millions | |
| Recent Price: 48.02 Smart Investing & Trading Score: 18 | |
| Day Percent Change: 0.55% Day Change: 0.27 | |
| Week Change: -0.55% Year-to-date Change: -12.6% | |
| SRCE Links: Profile News Message Board | |
| Charts:- Daily , Weekly | |
| Add SRCE to Watchlist: View: Get Complete SRCE Trend Analysis ➞ | |
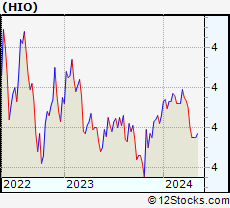 | HIO Western Asset High Income Opportunity Fund Inc. |
| Sector: Financials | |
| SubSector: Closed-End Fund - Debt | |
| MarketCap: 445.207 Millions | |
| Recent Price: 3.75 Smart Investing & Trading Score: 18 | |
| Day Percent Change: 0.54% Day Change: 0.02 | |
| Week Change: -1.18% Year-to-date Change: -2.7% | |
| HIO Links: Profile News Message Board | |
| Charts:- Daily , Weekly | |
| Add HIO to Watchlist: View: Get Complete HIO Trend Analysis ➞ | |
 | CVLY Codorus Valley Bancorp, Inc. |
| Sector: Financials | |
| SubSector: Regional - Northeast Banks | |
| MarketCap: 173.799 Millions | |
| Recent Price: 21.46 Smart Investing & Trading Score: 18 | |
| Day Percent Change: 0.42% Day Change: 0.09 | |
| Week Change: 0.42% Year-to-date Change: -16.5% | |
| CVLY Links: Profile News Message Board | |
| Charts:- Daily , Weekly | |
| Add CVLY to Watchlist: View: Get Complete CVLY Trend Analysis ➞ | |
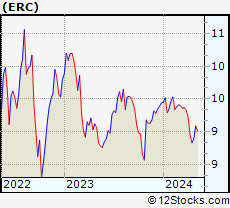 | ERC Wells Fargo Advantage Multi-Sector Income Fund |
| Sector: Financials | |
| SubSector: Asset Management | |
| MarketCap: 266.503 Millions | |
| Recent Price: 8.83 Smart Investing & Trading Score: 18 | |
| Day Percent Change: 0.34% Day Change: 0.03 | |
| Week Change: -1.45% Year-to-date Change: -6.5% | |
| ERC Links: Profile News Message Board | |
| Charts:- Daily , Weekly | |
| Add ERC to Watchlist: View: Get Complete ERC Trend Analysis ➞ | |
 | AGNC AGNC Investment Corp. |
| Sector: Financials | |
| SubSector: Mortgage Investment | |
| MarketCap: 6622.19 Millions | |
| Recent Price: 9.07 Smart Investing & Trading Score: 18 | |
| Day Percent Change: 0.33% Day Change: 0.03 | |
| Week Change: -2.58% Year-to-date Change: -7.5% | |
| AGNC Links: Profile News Message Board | |
| Charts:- Daily , Weekly | |
| Add AGNC to Watchlist: View: Get Complete AGNC Trend Analysis ➞ | |
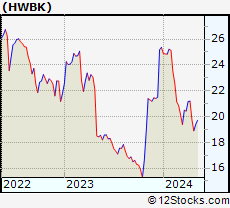 | HWBK Hawthorn Bancshares, Inc. |
| Sector: Financials | |
| SubSector: Regional - Northeast Banks | |
| MarketCap: 129.099 Millions | |
| Recent Price: 20.56 Smart Investing & Trading Score: 18 | |
| Day Percent Change: 0.29% Day Change: 0.06 | |
| Week Change: -3.02% Year-to-date Change: -19.0% | |
| HWBK Links: Profile News Message Board | |
| Charts:- Daily , Weekly | |
| Add HWBK to Watchlist: View: Get Complete HWBK Trend Analysis ➞ | |
 | FRBA First Bank |
| Sector: Financials | |
| SubSector: Regional - Mid-Atlantic Banks | |
| MarketCap: 124.859 Millions | |
| Recent Price: 12.08 Smart Investing & Trading Score: 18 | |
| Day Percent Change: 0.17% Day Change: 0.02 | |
| Week Change: -2.58% Year-to-date Change: -17.8% | |
| FRBA Links: Profile News Message Board | |
| Charts:- Daily , Weekly | |
| Add FRBA to Watchlist: View: Get Complete FRBA Trend Analysis ➞ | |
 | SMMF Summit Financial Group, Inc. |
| Sector: Financials | |
| SubSector: Regional - Mid-Atlantic Banks | |
| MarketCap: 228.959 Millions | |
| Recent Price: 25.06 Smart Investing & Trading Score: 18 | |
| Day Percent Change: 0.12% Day Change: 0.03 | |
| Week Change: -0.24% Year-to-date Change: -18.3% | |
| SMMF Links: Profile News Message Board | |
| Charts:- Daily , Weekly | |
| Add SMMF to Watchlist: View: Get Complete SMMF Trend Analysis ➞ | |
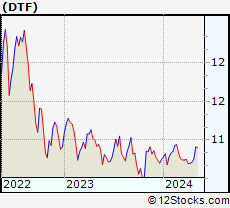 | DTF DTF Tax-Free Income Inc. |
| Sector: Financials | |
| SubSector: Closed-End Fund - Debt | |
| MarketCap: 106.407 Millions | |
| Recent Price: 10.67 Smart Investing & Trading Score: 18 | |
| Day Percent Change: 0.08% Day Change: 0.01 | |
| Week Change: -0.28% Year-to-date Change: -0.7% | |
| DTF Links: Profile News Message Board | |
| Charts:- Daily , Weekly | |
| Add DTF to Watchlist: View: Get Complete DTF Trend Analysis ➞ | |
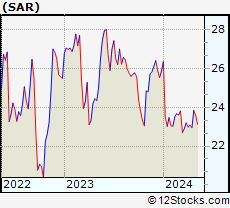 | SAR Saratoga Investment Corp. |
| Sector: Financials | |
| SubSector: Diversified Investments | |
| MarketCap: 132.67 Millions | |
| Recent Price: 22.67 Smart Investing & Trading Score: 18 | |
| Day Percent Change: 0.00% Day Change: 0.00 | |
| Week Change: -1.78% Year-to-date Change: -12.3% | |
| SAR Links: Profile News Message Board | |
| Charts:- Daily , Weekly | |
| Add SAR to Watchlist: View: Get Complete SAR Trend Analysis ➞ | |
 | BAM Brookfield Asset Management Inc. |
| Sector: Financials | |
| SubSector: Real Estate Development | |
| MarketCap: 47134.9 Millions | |
| Recent Price: 38.42 Smart Investing & Trading Score: 18 | |
| Day Percent Change: -1.56% Day Change: -0.61 | |
| Week Change: -2.44% Year-to-date Change: -4.4% | |
| BAM Links: Profile News Message Board | |
| Charts:- Daily , Weekly | |
| Add BAM to Watchlist: View: Get Complete BAM Trend Analysis ➞ | |
 | BEKE KE Holdings Inc. |
| Sector: Financials | |
| SubSector: Real Estate Services | |
| MarketCap: 80167 Millions | |
| Recent Price: 12.75 Smart Investing & Trading Score: 18 | |
| Day Percent Change: -1.01% Day Change: -0.13 | |
| Week Change: -3.12% Year-to-date Change: -21.3% | |
| BEKE Links: Profile News Message Board | |
| Charts:- Daily , Weekly | |
| Add BEKE to Watchlist: View: Get Complete BEKE Trend Analysis ➞ | |
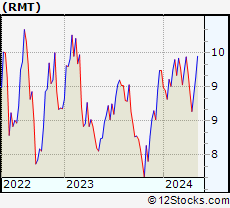 | RMT Royce Micro-Cap Trust, Inc. |
| Sector: Financials | |
| SubSector: Closed-End Fund - Equity | |
| MarketCap: 195.647 Millions | |
| Recent Price: 8.62 Smart Investing & Trading Score: 18 | |
| Day Percent Change: -0.81% Day Change: -0.07 | |
| Week Change: -3.25% Year-to-date Change: -6.7% | |
| RMT Links: Profile News Message Board | |
| Charts:- Daily , Weekly | |
| Add RMT to Watchlist: View: Get Complete RMT Trend Analysis ➞ | |
 | PFIS Peoples Financial Services Corp. |
| Sector: Financials | |
| SubSector: Regional - Northeast Banks | |
| MarketCap: 305.499 Millions | |
| Recent Price: 36.81 Smart Investing & Trading Score: 18 | |
| Day Percent Change: -0.63% Day Change: -0.23 | |
| Week Change: -1.56% Year-to-date Change: -24.4% | |
| PFIS Links: Profile News Message Board | |
| Charts:- Daily , Weekly | |
| Add PFIS to Watchlist: View: Get Complete PFIS Trend Analysis ➞ | |
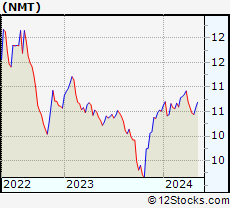 | NMT Nuveen Massachusetts Quality Municipal Income Fund |
| Sector: Financials | |
| SubSector: Closed-End Fund - Debt | |
| MarketCap: 123.407 Millions | |
| Recent Price: 10.48 Smart Investing & Trading Score: 18 | |
| Day Percent Change: -0.57% Day Change: -0.06 | |
| Week Change: -0.97% Year-to-date Change: -0.3% | |
| NMT Links: Profile News Message Board | |
| Charts:- Daily , Weekly | |
| Add NMT to Watchlist: View: Get Complete NMT Trend Analysis ➞ | |
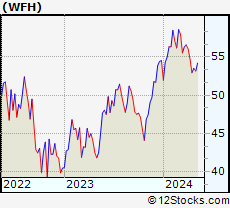 | WFH Direxion Work From Home ETF |
| Sector: Financials | |
| SubSector: Exchange Traded Fund | |
| MarketCap: 60157 Millions | |
| Recent Price: 53.21 Smart Investing & Trading Score: 18 | |
| Day Percent Change: -0.55% Day Change: -0.29 | |
| Week Change: -2.88% Year-to-date Change: -2.5% | |
| WFH Links: Profile News Message Board | |
| Charts:- Daily , Weekly | |
| Add WFH to Watchlist: View: Get Complete WFH Trend Analysis ➞ | |
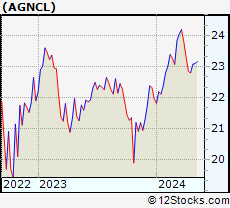 | AGNCL AGNC Investment Corp. |
| Sector: Financials | |
| SubSector: REIT - Mortgage | |
| MarketCap: 6030 Millions | |
| Recent Price: 22.44 Smart Investing & Trading Score: 18 | |
| Day Percent Change: -0.53% Day Change: -0.12 | |
| Week Change: -1.79% Year-to-date Change: 2.1% | |
| AGNCL Links: Profile News Message Board | |
| Charts:- Daily , Weekly | |
| Add AGNCL to Watchlist: View: Get Complete AGNCL Trend Analysis ➞ | |
| For tabular summary view of above stock list: Summary View ➞ 0 - 25 , 25 - 50 , 50 - 75 , 75 - 100 , 100 - 125 , 125 - 150 , 150 - 175 , 175 - 200 , 200 - 225 , 225 - 250 , 250 - 275 , 275 - 300 , 300 - 325 , 325 - 350 , 350 - 375 , 375 - 400 , 400 - 425 , 425 - 450 , 450 - 475 , 475 - 500 , 500 - 525 , 525 - 550 , 550 - 575 , 575 - 600 , 600 - 625 , 625 - 650 , 650 - 675 , 675 - 700 , 700 - 725 , 725 - 750 , 750 - 775 , 775 - 800 , 800 - 825 , 825 - 850 , 850 - 875 , 875 - 900 , 900 - 925 , 925 - 950 , 950 - 975 , 975 - 1000 , 1000 - 1025 , 1025 - 1050 , 1050 - 1075 , 1075 - 1100 , 1100 - 1125 , 1125 - 1150 , 1150 - 1175 , 1175 - 1200 , 1200 - 1225 , 1225 - 1250 | ||
| Click To Change The Sort Order: By Market Cap or Company Size Performance: Year-to-date, Week and Day | |
| Select Chart Type: | ||
|
Best Stocks Today 12Stocks.com |
© 2024 12Stocks.com Terms & Conditions Privacy Contact Us
All Information Provided Only For Education And Not To Be Used For Investing or Trading. See Terms & Conditions


One More Thing ... Get Best Stocks Delivered Daily!
Never Ever Miss A Move With Our Top Ten Stocks Lists
Find Best Stocks In Any Market - Bull or Bear Market
Take A Peek At Our Top Ten Stocks Lists: Daily, Weekly, Year-to-Date & Top Trends
Find Best Stocks In Any Market - Bull or Bear Market
Take A Peek At Our Top Ten Stocks Lists: Daily, Weekly, Year-to-Date & Top Trends
Financial Stocks With Best Up Trends [0-bearish to 100-bullish]: Medical Properties[100], Macatawa Bank[100], Stellus Capital[100], Regional Management[100], Angel Oak[95], HDFC Bank[93], Charles Schwab[93], Fidus [93], Western Asset[93], BlackRock MuniYield[93], Wells Fargo[90]
Best Financial Stocks Year-to-Date:
Root [389.97%], Hippo [128.32%], Gladstone Capital[93.22%], Banco Macro[68.33%], Grupo Financiero[62.41%], Yiren Digital[55.45%], Fidelis Insurance[53.3%], First [51.11%], Banco BBVA[48.35%], EverQuote [48.28%], Heritage Insurance[45.55%] Best Financial Stocks This Week:
Macatawa Bank[44.53%], Medical Properties[25.06%], Globe Life[10%], James River[8.87%], GoHealth [7.45%], Victory Capital[6.86%], Huize Holding[6.65%], LCNB [5.7%], Bancorp [5.53%], Green Dot[5.25%], ESSA Bancorp[4.85%] Best Financial Stocks Daily:
Cipher Mining[8.65%], Oportun [8.45%], Ally [6.73%], eHealth [6.11%], Coinbase Global[5.90%], James River[5.62%], Tejon Ranch[5.44%], C&F [5.02%], Bank OZK[4.73%], Medical Properties[4.61%], Claros Mortgage[4.52%]