
 Login Sign Up


| |||||
 |  | ||||

| 12Stocks.com Market Intelligence |
Best Financial Stocks
| In a hurry? Financial Stocks Lists: Performance Trends Table, Stock Charts
Sort Financial stocks: Daily, Weekly, Year-to-Date, Market Cap & Trends. Filter Financial stocks list by size:All Financial Large Mid-Range Small & MicroCap |
| 12Stocks.com Financial Stocks Performances & Trends Daily | |||||||||
|
|  The overall Smart Investing & Trading Score is 63 (0-bearish to 100-bullish) which puts Financial sector in short term neutral to bullish trend. The Smart Investing & Trading Score from previous trading session is 56 and hence an improvement of trend.
| ||||||||
Here are the Smart Investing & Trading Scores of the most requested Financial stocks at 12Stocks.com (click stock name for detailed review):
|


| 12Stocks.com: Investing in Financial sector with Stocks | |
|
The following table helps investors and traders sort through current performance and trends (as measured by Smart Investing & Trading Score) of various
stocks in the Financial sector. Quick View: Move mouse or cursor over stock symbol (ticker) to view short-term Technical chart and over stock name to view long term chart. Click on  to add stock symbol to your watchlist and to add stock symbol to your watchlist and  to view watchlist. Click on any ticker or stock name for detailed market intelligence report for that stock. to view watchlist. Click on any ticker or stock name for detailed market intelligence report for that stock. |
12Stocks.com Performance of Stocks in Financial Sector
| Ticker | Stock Name | Watchlist | Category | Recent Price | Trend Score | Change % | YTD Change% |
| BIT | BlackRock Multi-Sector |   | Closed-End Fund - Debt | 15.41 | 60 | 1.25% | 2.73% |
| FNF | Fidelity National | | Insurance | 50.39 | 60 | 1.02% | -1.23% |
| CVLY | Codorus Valley | | Regional Banks | 22.47 | 60 | 0.27% | -12.57% |
| FLIC | First of Long Island | | Regional Banks | 10.50 | 60 | 0.19% | -20.69% |
| BMRC | Bank of Marin Bancorp | | Regional Banks | 15.44 | 60 | 0.06% | -29.88% |
| TCBK | TriCo Bancshares | | Regional Banks | 33.85 | 60 | -1.14% | -21.22% |
| WAFDP | Washington Federal | | Banks - Regional | 15.65 | 60 | -1.01% | 3.37% |
| SFBS | ServisFirst Bancshares | | Foreign Banks | 60.75 | 60 | -0.85% | -8.82% |
| LKFN | Lakeland | | Regional Banks | 59.77 | 60 | -0.63% | -8.27% |
| CBU | Community Bank | | Regional Banks | 44.64 | 60 | -0.11% | -14.34% |
| FBNC | First Bancorp | | Regional Banks | 31.52 | 60 | -0.10% | -14.83% |
| BANR | Banner | | Regional Banks | 45.36 | 60 | -0.04% | -15.31% |
| STRS | Stratus Properties | | Real Estatet | 22.76 | 59 | 1.61% | -21.14% |
| CHMI | Cherry Hill | | Mortgage | 3.43 | 59 | 1.48% | -15.10% |
| EBC | Eastern Bankshares | | Banks Regional | 13.09 | 59 | 1.32% | -7.82% |
| WD | Walker & Dunlop | | Mortgage | 93.21 | 59 | 1.18% | -16.03% |
| NLY | Annaly Capital | | Mortgage | 18.88 | 59 | 1.02% | -2.53% |
| BLFY | Blue Foundry | | Banks - Regional | 8.76 | 59 | 0.86% | -9.09% |
| FT | Franklin Universal | | Closed-End Fund - Debt | 6.57 | 59 | 0.46% | -1.20% |
| DEI | Douglas Emmett | | REIT - | 13.37 | 59 | 0.45% | -7.79% |
| OZKAP | Bank OZK | | Banks - Regional | 16.82 | 59 | 0.30% | 0.18% |
| NTST | NetSTREIT | | REIT Retail | 17.12 | 59 | 0.20% | -4.14% |
| SUI | Sun Communities | | REIT | 119.08 | 59 | 0.13% | -10.90% |
| TOP | TOP | | Capital Markets | 2.68 | 59 | 0.00% | -27.96% |
| GBCI | Glacier Bancorp | | Regional Banks | 37.12 | 59 | -0.75% | -10.16% |
| For chart view version of above stock list: Chart View ➞ 0 - 25 , 25 - 50 , 50 - 75 , 75 - 100 , 100 - 125 , 125 - 150 , 150 - 175 , 175 - 200 , 200 - 225 , 225 - 250 , 250 - 275 , 275 - 300 , 300 - 325 , 325 - 350 , 350 - 375 , 375 - 400 , 400 - 425 , 425 - 450 , 450 - 475 , 475 - 500 , 500 - 525 , 525 - 550 , 550 - 575 , 575 - 600 , 600 - 625 , 625 - 650 , 650 - 675 , 675 - 700 , 700 - 725 , 725 - 750 , 750 - 775 , 775 - 800 , 800 - 825 , 825 - 850 , 850 - 875 , 875 - 900 , 900 - 925 , 925 - 950 , 950 - 975 , 975 - 1000 , 1000 - 1025 , 1025 - 1050 , 1050 - 1075 , 1075 - 1100 , 1100 - 1125 , 1125 - 1150 , 1150 - 1175 , 1175 - 1200 , 1200 - 1225 , 1225 - 1250 | ||
 | Click To Change The Sort Order: By Market Cap or Company Size Performance: Year-to-date, Week and Day |  |
|
Get the most comprehensive stock market coverage daily at 12Stocks.com ➞ Best Stocks Today ➞ Best Stocks Weekly ➞ Best Stocks Year-to-Date ➞ Best Stocks Trends ➞  Best Stocks Today 12Stocks.com Best Nasdaq Stocks ➞ Best S&P 500 Stocks ➞ Best Tech Stocks ➞ Best Biotech Stocks ➞ |
| Detailed Overview of Financial Stocks |
| Financial Technical Overview, Leaders & Laggards, Top Financial ETF Funds & Detailed Financial Stocks List, Charts, Trends & More |
| Financial Sector: Technical Analysis, Trends & YTD Performance | |
| Financial sector is composed of stocks
from banks, brokers, insurance, REITs
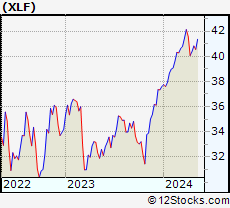
and services subsectors. Financial sector, as represented by XLF, an exchange-traded fund [ETF] that holds basket of Financial stocks (e.g, Bank of America, Goldman Sachs) is up by 8.56% and is currently outperforming the overall market by 2.42% year-to-date. Below is a quick view of Technical charts and trends: |
|
 XLF Weekly Chart |
|
| Long Term Trend: Very Good | |
| Medium Term Trend: Not Good | |
 XLF Daily Chart |
|
| Short Term Trend: Deteriorating | |
| Overall Trend Score: 63 | |
| YTD Performance: 8.56% | |
| **Trend Scores & Views Are Only For Educational Purposes And Not For Investing | |
| 12Stocks.com: Top Performing Financial Sector Stocks | ||||||||||||||||||||||||||||||||||||||||||||||||
 The top performing Financial sector stocks year to date are
Now, more recently, over last week, the top performing Financial sector stocks on the move are


|
||||||||||||||||||||||||||||||||||||||||||||||||
| 12Stocks.com: Investing in Financial Sector using Exchange Traded Funds | |
|
The following table shows list of key exchange traded funds (ETF) that
help investors track Financial Index. For detailed view, check out our ETF Funds section of our website. Quick View: Move mouse or cursor over ETF symbol (ticker) to view short-term Technical chart and over ETF name to view long term chart. Click on ticker or stock name for detailed view. Click on to add stock symbol to your watchlist and to view watchlist. |
12Stocks.com List of ETFs that track Financial Index
| Ticker | ETF Name | Watchlist | Recent Price | Smart Investing & Trading Score | Change % | Week % | Year-to-date % |
| XLF | Financial | | 40.82 | 63 | -0.15 | 1.09 | 8.56% |
| IAI | Broker-Dealers & Secs | | 113.01 | 68 | 0.77 | 1.78 | 4.13% |
| IYF | Financials | | 92.17 | 68 | -0.35 | 0.95 | 7.91% |
| IYG | Financial Services | | 64.61 | 83 | 0.08 | 1.88 | 8.16% |
| KRE | Regional Banking | | 48.19 | 74 | -0.58 | 1.84 | -8.09% |
| IXG | Global Financials | | 84.19 | 60 | -0.30 | 1.61 | 7.14% |
| VFH | Financials | | 98.93 | 75 | -0.19 | 1.21 | 7.23% |
| KBE | Bank | | 45.33 | 85 | -0.31 | 2.07 | -1.5% |
| FAS | Financial Bull 3X | | 100.63 | 55 | -0.79 | 2.76 | 21.75% |
| FAZ | Financial Bear 3X | | 10.86 | 47 | 0.65 | -3.04 | -20.56% |
| UYG | Financials | | 63.65 | 55 | -0.42 | 1.94 | 15.31% |
| IAT | Regional Banks | | 41.72 | 93 | -0.31 | 2.41 | -0.29% |
| KIE | Insurance | | 48.53 | 33 | -1.56 | -1.12 | 7.32% |
| PSCF | SmallCap Financials | | 46.36 | 65 | 0.15 | 1.96 | -5.73% |
| EUFN | Europe Financials | | 22.46 | 75 | 0.54 | 2.32 | 7.16% |
| PGF | Financial Preferred | | 14.57 | 44 | 0.00 | 0.28 | -0.07% |
| 12Stocks.com: Charts, Trends, Fundamental Data and Performances of Financial Stocks | |
|
We now take in-depth look at all Financial stocks including charts, multi-period performances and overall trends (as measured by Smart Investing & Trading Score). One can sort Financial stocks (click link to choose) by Daily, Weekly and by Year-to-Date performances. Also, one can sort by size of the company or by market capitalization. |
| Select Your Default Chart Type: | |||||
| |||||
| Click on stock symbol or name for detailed view. Click on to add stock symbol to your watchlist and to view watchlist. Quick View: Move mouse or cursor over "Daily" to quickly view daily Technical stock chart and over "Weekly" to view weekly Technical stock chart. | |||||

 | BIT BlackRock Multi-Sector Income Trust |
| Sector: Financials | |
| SubSector: Closed-End Fund - Debt | |
| MarketCap: 412.507 Millions | |
| Recent Price: 15.41 Smart Investing & Trading Score: 60 | |
| Day Percent Change: 1.25% Day Change: 0.19 | |
| Week Change: 1.85% Year-to-date Change: 2.7% | |
| BIT Links: Profile News Message Board | |
| Charts:- Daily , Weekly | |
| Add BIT to Watchlist: View: Get Complete BIT Trend Analysis ➞ | |
 | FNF Fidelity National Financial, Inc. |
| Sector: Financials | |
| SubSector: Surety & Title Insurance | |
| MarketCap: 6532.18 Millions | |
| Recent Price: 50.39 Smart Investing & Trading Score: 60 | |
| Day Percent Change: 1.02% Day Change: 0.51 | |
| Week Change: 3.32% Year-to-date Change: -1.2% | |
| FNF Links: Profile News Message Board | |
| Charts:- Daily , Weekly | |
| Add FNF to Watchlist: View: Get Complete FNF Trend Analysis ➞ | |
 | CVLY Codorus Valley Bancorp, Inc. |
| Sector: Financials | |
| SubSector: Regional - Northeast Banks | |
| MarketCap: 173.799 Millions | |
| Recent Price: 22.47 Smart Investing & Trading Score: 60 | |
| Day Percent Change: 0.27% Day Change: 0.06 | |
| Week Change: 0.58% Year-to-date Change: -12.6% | |
| CVLY Links: Profile News Message Board | |
| Charts:- Daily , Weekly | |
| Add CVLY to Watchlist: View: Get Complete CVLY Trend Analysis ➞ | |
 | FLIC The First of Long Island Corporation |
| Sector: Financials | |
| SubSector: Regional - Northeast Banks | |
| MarketCap: 352.899 Millions | |
| Recent Price: 10.50 Smart Investing & Trading Score: 60 | |
| Day Percent Change: 0.19% Day Change: 0.02 | |
| Week Change: 0.57% Year-to-date Change: -20.7% | |
| FLIC Links: Profile News Message Board | |
| Charts:- Daily , Weekly | |
| Add FLIC to Watchlist: View: Get Complete FLIC Trend Analysis ➞ | |
 | BMRC Bank of Marin Bancorp |
| Sector: Financials | |
| SubSector: Regional - Pacific Banks | |
| MarketCap: 367.929 Millions | |
| Recent Price: 15.44 Smart Investing & Trading Score: 60 | |
| Day Percent Change: 0.06% Day Change: 0.01 | |
| Week Change: -0.52% Year-to-date Change: -29.9% | |
| BMRC Links: Profile News Message Board | |
| Charts:- Daily , Weekly | |
| Add BMRC to Watchlist: View: Get Complete BMRC Trend Analysis ➞ | |
 | TCBK TriCo Bancshares |
| Sector: Financials | |
| SubSector: Regional - Pacific Banks | |
| MarketCap: 875.129 Millions | |
| Recent Price: 33.85 Smart Investing & Trading Score: 60 | |
| Day Percent Change: -1.14% Day Change: -0.39 | |
| Week Change: 0.8% Year-to-date Change: -21.2% | |
| TCBK Links: Profile News Message Board | |
| Charts:- Daily , Weekly | |
| Add TCBK to Watchlist: View: Get Complete TCBK Trend Analysis ➞ | |
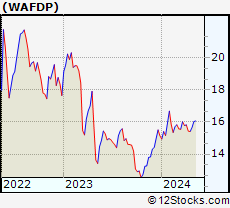 | WAFDP Washington Federal, Inc. |
| Sector: Financials | |
| SubSector: Banks - Regional | |
| MarketCap: 1740 Millions | |
| Recent Price: 15.65 Smart Investing & Trading Score: 60 | |
| Day Percent Change: -1.01% Day Change: -0.16 | |
| Week Change: 1.56% Year-to-date Change: 3.4% | |
| WAFDP Links: Profile News Message Board | |
| Charts:- Daily , Weekly | |
| Add WAFDP to Watchlist: View: Get Complete WAFDP Trend Analysis ➞ | |
 | SFBS ServisFirst Bancshares, Inc. |
| Sector: Financials | |
| SubSector: Foreign Money Center Banks | |
| MarketCap: 1596.71 Millions | |
| Recent Price: 60.75 Smart Investing & Trading Score: 60 | |
| Day Percent Change: -0.85% Day Change: -0.52 | |
| Week Change: 0.88% Year-to-date Change: -8.8% | |
| SFBS Links: Profile News Message Board | |
| Charts:- Daily , Weekly | |
| Add SFBS to Watchlist: View: Get Complete SFBS Trend Analysis ➞ | |
 | LKFN Lakeland Financial Corporation |
| Sector: Financials | |
| SubSector: Regional - Midwest Banks | |
| MarketCap: 903.27 Millions | |
| Recent Price: 59.77 Smart Investing & Trading Score: 60 | |
| Day Percent Change: -0.63% Day Change: -0.38 | |
| Week Change: -3.05% Year-to-date Change: -8.3% | |
| LKFN Links: Profile News Message Board | |
| Charts:- Daily , Weekly | |
| Add LKFN to Watchlist: View: Get Complete LKFN Trend Analysis ➞ | |
 | CBU Community Bank System, Inc. |
| Sector: Financials | |
| SubSector: Regional - Midwest Banks | |
| MarketCap: 2787.8 Millions | |
| Recent Price: 44.64 Smart Investing & Trading Score: 60 | |
| Day Percent Change: -0.11% Day Change: -0.05 | |
| Week Change: 0.31% Year-to-date Change: -14.3% | |
| CBU Links: Profile News Message Board | |
| Charts:- Daily , Weekly | |
| Add CBU to Watchlist: View: Get Complete CBU Trend Analysis ➞ | |
 | FBNC First Bancorp |
| Sector: Financials | |
| SubSector: Regional - Mid-Atlantic Banks | |
| MarketCap: 664.959 Millions | |
| Recent Price: 31.52 Smart Investing & Trading Score: 60 | |
| Day Percent Change: -0.10% Day Change: -0.03 | |
| Week Change: -2.45% Year-to-date Change: -14.8% | |
| FBNC Links: Profile News Message Board | |
| Charts:- Daily , Weekly | |
| Add FBNC to Watchlist: View: Get Complete FBNC Trend Analysis ➞ | |
 | BANR Banner Corporation |
| Sector: Financials | |
| SubSector: Regional - Mid-Atlantic Banks | |
| MarketCap: 1187.09 Millions | |
| Recent Price: 45.36 Smart Investing & Trading Score: 60 | |
| Day Percent Change: -0.04% Day Change: -0.02 | |
| Week Change: 0.93% Year-to-date Change: -15.3% | |
| BANR Links: Profile News Message Board | |
| Charts:- Daily , Weekly | |
| Add BANR to Watchlist: View: Get Complete BANR Trend Analysis ➞ | |
 | STRS Stratus Properties Inc. |
| Sector: Financials | |
| SubSector: Real Estate Development | |
| MarketCap: 167.819 Millions | |
| Recent Price: 22.76 Smart Investing & Trading Score: 59 | |
| Day Percent Change: 1.61% Day Change: 0.36 | |
| Week Change: -0.78% Year-to-date Change: -21.1% | |
| STRS Links: Profile News Message Board | |
| Charts:- Daily , Weekly | |
| Add STRS to Watchlist: View: Get Complete STRS Trend Analysis ➞ | |
 | CHMI Cherry Hill Mortgage Investment Corporation |
| Sector: Financials | |
| SubSector: Mortgage Investment | |
| MarketCap: 124.839 Millions | |
| Recent Price: 3.43 Smart Investing & Trading Score: 59 | |
| Day Percent Change: 1.48% Day Change: 0.05 | |
| Week Change: 3.94% Year-to-date Change: -15.1% | |
| CHMI Links: Profile News Message Board | |
| Charts:- Daily , Weekly | |
| Add CHMI to Watchlist: View: Get Complete CHMI Trend Analysis ➞ | |
 | EBC Eastern Bankshares, Inc. |
| Sector: Financials | |
| SubSector: Banks Regional | |
| MarketCap: 30057 Millions | |
| Recent Price: 13.09 Smart Investing & Trading Score: 59 | |
| Day Percent Change: 1.32% Day Change: 0.17 | |
| Week Change: 3.52% Year-to-date Change: -7.8% | |
| EBC Links: Profile News Message Board | |
| Charts:- Daily , Weekly | |
| Add EBC to Watchlist: View: Get Complete EBC Trend Analysis ➞ | |
 | WD Walker & Dunlop, Inc. |
| Sector: Financials | |
| SubSector: Mortgage Investment | |
| MarketCap: 1312.99 Millions | |
| Recent Price: 93.21 Smart Investing & Trading Score: 59 | |
| Day Percent Change: 1.18% Day Change: 1.09 | |
| Week Change: 2.16% Year-to-date Change: -16.0% | |
| WD Links: Profile News Message Board | |
| Charts:- Daily , Weekly | |
| Add WD to Watchlist: View: Get Complete WD Trend Analysis ➞ | |
 | NLY Annaly Capital Management, Inc. |
| Sector: Financials | |
| SubSector: Mortgage Investment | |
| MarketCap: 9127.79 Millions | |
| Recent Price: 18.88 Smart Investing & Trading Score: 59 | |
| Day Percent Change: 1.02% Day Change: 0.19 | |
| Week Change: 3.57% Year-to-date Change: -2.5% | |
| NLY Links: Profile News Message Board | |
| Charts:- Daily , Weekly | |
| Add NLY to Watchlist: View: Get Complete NLY Trend Analysis ➞ | |
 | BLFY Blue Foundry Bancorp |
| Sector: Financials | |
| SubSector: Banks - Regional | |
| MarketCap: 264 Millions | |
| Recent Price: 8.76 Smart Investing & Trading Score: 59 | |
| Day Percent Change: 0.86% Day Change: 0.08 | |
| Week Change: 3.86% Year-to-date Change: -9.1% | |
| BLFY Links: Profile News Message Board | |
| Charts:- Daily , Weekly | |
| Add BLFY to Watchlist: View: Get Complete BLFY Trend Analysis ➞ | |
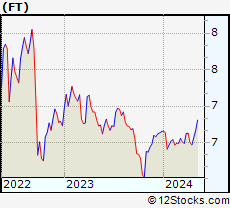 | FT Franklin Universal Trust |
| Sector: Financials | |
| SubSector: Closed-End Fund - Debt | |
| MarketCap: 135.907 Millions | |
| Recent Price: 6.57 Smart Investing & Trading Score: 59 | |
| Day Percent Change: 0.46% Day Change: 0.03 | |
| Week Change: 1.55% Year-to-date Change: -1.2% | |
| FT Links: Profile News Message Board | |
| Charts:- Daily , Weekly | |
| Add FT to Watchlist: View: Get Complete FT Trend Analysis ➞ | |
 | DEI Douglas Emmett, Inc. |
| Sector: Financials | |
| SubSector: REIT - Diversified | |
| MarketCap: 4917.83 Millions | |
| Recent Price: 13.37 Smart Investing & Trading Score: 59 | |
| Day Percent Change: 0.45% Day Change: 0.06 | |
| Week Change: 0.45% Year-to-date Change: -7.8% | |
| DEI Links: Profile News Message Board | |
| Charts:- Daily , Weekly | |
| Add DEI to Watchlist: View: Get Complete DEI Trend Analysis ➞ | |
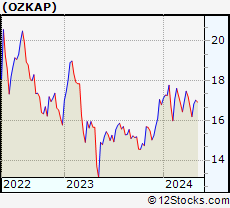 | OZKAP Bank OZK |
| Sector: Financials | |
| SubSector: Banks - Regional | |
| MarketCap: 5170 Millions | |
| Recent Price: 16.82 Smart Investing & Trading Score: 59 | |
| Day Percent Change: 0.30% Day Change: 0.05 | |
| Week Change: 3.89% Year-to-date Change: 0.2% | |
| OZKAP Links: Profile News Message Board | |
| Charts:- Daily , Weekly | |
| Add OZKAP to Watchlist: View: Get Complete OZKAP Trend Analysis ➞ | |
 | NTST NetSTREIT Corp. |
| Sector: Financials | |
| SubSector: REIT Retail | |
| MarketCap: 51267 Millions | |
| Recent Price: 17.12 Smart Investing & Trading Score: 59 | |
| Day Percent Change: 0.20% Day Change: 0.04 | |
| Week Change: 2.48% Year-to-date Change: -4.1% | |
| NTST Links: Profile News Message Board | |
| Charts:- Daily , Weekly | |
| Add NTST to Watchlist: View: Get Complete NTST Trend Analysis ➞ | |
 | SUI Sun Communities, Inc. |
| Sector: Financials | |
| SubSector: REIT - Residential | |
| MarketCap: 11280.5 Millions | |
| Recent Price: 119.08 Smart Investing & Trading Score: 59 | |
| Day Percent Change: 0.13% Day Change: 0.16 | |
| Week Change: 1.18% Year-to-date Change: -10.9% | |
| SUI Links: Profile News Message Board | |
| Charts:- Daily , Weekly | |
| Add SUI to Watchlist: View: Get Complete SUI Trend Analysis ➞ | |
 | TOP TOP Financial Group Limited |
| Sector: Financials | |
| SubSector: Capital Markets | |
| MarketCap: 329 Millions | |
| Recent Price: 2.68 Smart Investing & Trading Score: 59 | |
| Day Percent Change: 0.00% Day Change: 0.00 | |
| Week Change: 14.04% Year-to-date Change: -28.0% | |
| TOP Links: Profile News Message Board | |
| Charts:- Daily , Weekly | |
| Add TOP to Watchlist: View: Get Complete TOP Trend Analysis ➞ | |
 | GBCI Glacier Bancorp, Inc. |
| Sector: Financials | |
| SubSector: Regional - Pacific Banks | |
| MarketCap: 3142.89 Millions | |
| Recent Price: 37.12 Smart Investing & Trading Score: 59 | |
| Day Percent Change: -0.75% Day Change: -0.28 | |
| Week Change: 0.49% Year-to-date Change: -10.2% | |
| GBCI Links: Profile News Message Board | |
| Charts:- Daily , Weekly | |
| Add GBCI to Watchlist: View: Get Complete GBCI Trend Analysis ➞ | |
| For tabular summary view of above stock list: Summary View ➞ 0 - 25 , 25 - 50 , 50 - 75 , 75 - 100 , 100 - 125 , 125 - 150 , 150 - 175 , 175 - 200 , 200 - 225 , 225 - 250 , 250 - 275 , 275 - 300 , 300 - 325 , 325 - 350 , 350 - 375 , 375 - 400 , 400 - 425 , 425 - 450 , 450 - 475 , 475 - 500 , 500 - 525 , 525 - 550 , 550 - 575 , 575 - 600 , 600 - 625 , 625 - 650 , 650 - 675 , 675 - 700 , 700 - 725 , 725 - 750 , 750 - 775 , 775 - 800 , 800 - 825 , 825 - 850 , 850 - 875 , 875 - 900 , 900 - 925 , 925 - 950 , 950 - 975 , 975 - 1000 , 1000 - 1025 , 1025 - 1050 , 1050 - 1075 , 1075 - 1100 , 1100 - 1125 , 1125 - 1150 , 1150 - 1175 , 1175 - 1200 , 1200 - 1225 , 1225 - 1250 | ||
| Click To Change The Sort Order: By Market Cap or Company Size Performance: Year-to-date, Week and Day | |
| Select Chart Type: | ||
|
Best Stocks Today 12Stocks.com |
© 2024 12Stocks.com Terms & Conditions Privacy Contact Us
All Information Provided Only For Education And Not To Be Used For Investing or Trading. See Terms & Conditions


One More Thing ... Get Best Stocks Delivered Daily!
Never Ever Miss A Move With Our Top Ten Stocks Lists
Find Best Stocks In Any Market - Bull or Bear Market
Take A Peek At Our Top Ten Stocks Lists: Daily, Weekly, Year-to-Date & Top Trends
Find Best Stocks In Any Market - Bull or Bear Market
Take A Peek At Our Top Ten Stocks Lists: Daily, Weekly, Year-to-Date & Top Trends
Financial Stocks With Best Up Trends [0-bearish to 100-bullish]: KB [100], MBIA [100], Shinhan [100], B. Riley[100], Uniti [100], American Homes[100], Goldman Sachs[100], Solar Capital[100], Templeton Dragon[100], Mid-America Apartment[100], TCG BDC[100]
Best Financial Stocks Year-to-Date:
Root [510.12%], Hippo [141.6%], Gladstone Capital[100.47%], Banco Macro[79.02%], Grupo Financiero[77.82%], B. Riley[75.42%], Banco BBVA[70.04%], Yiren Digital[62.82%], EverQuote [59.72%], Heritage Insurance[57.82%], Fidelis Insurance[54.33%] Best Financial Stocks This Week:
B. Riley[84.19%], Oportun [35.78%], Root [23.46%], KB [18.21%], KE [17.23%], Cipher Mining[16.93%], TOP [14.04%], Provident Bancorp[13.99%], Globe Life[13.5%], Trustmark [12.42%], Coinbase Global[12.06%] Best Financial Stocks Daily:
Huize Holding[18.27%], KB [8.99%], KE [8.17%], Root [7.99%], MBIA [7.74%], PagSeguro Digital[7.28%], Shinhan [7.25%], Noah [6.71%], MicroSectors Gold[6.44%], B. Riley[6.14%], Coinbase Global[5.74%]