
 Login Sign Up


| |||||
 |  | ||||

| 12Stocks.com Market Intelligence |
Best Financial Stocks
| In a hurry? Financial Stocks Lists: Performance Trends Table, Stock Charts
Sort Financial stocks: Daily, Weekly, Year-to-Date, Market Cap & Trends. Filter Financial stocks list by size:All Financial Large Mid-Range Small & MicroCap |
| 12Stocks.com Financial Stocks Performances & Trends Daily | |||||||||
|
|  The overall Smart Investing & Trading Score is 36 (0-bearish to 100-bullish) which puts Financial sector in short term bearish to neutral trend. The Smart Investing & Trading Score from previous trading session is 21 and hence an improvement of trend.
| ||||||||
Here are the Smart Investing & Trading Scores of the most requested Financial stocks at 12Stocks.com (click stock name for detailed review):
|


| 12Stocks.com: Investing in Financial sector with Stocks | |
|
The following table helps investors and traders sort through current performance and trends (as measured by Smart Investing & Trading Score) of various
stocks in the Financial sector. Quick View: Move mouse or cursor over stock symbol (ticker) to view short-term Technical chart and over stock name to view long term chart. Click on  to add stock symbol to your watchlist and to add stock symbol to your watchlist and  to view watchlist. Click on any ticker or stock name for detailed market intelligence report for that stock. to view watchlist. Click on any ticker or stock name for detailed market intelligence report for that stock. |
12Stocks.com Performance of Stocks in Financial Sector
| Ticker | Stock Name | Watchlist | Category | Recent Price | Trend Score | Change % | YTD Change% |
| NWFL | Norwood |   | Regional Banks | 25.28 | 64 | 2.43% | -23.18% |
| ESGR | Enstar | | Insurance | 299.51 | 64 | 2.24% | 1.75% |
| TIPT | Tiptree | | Life Insurance | 16.47 | 64 | 2.17% | -13.13% |
| RNST | Renasant | | Banks | 30.10 | 64 | 1.79% | -10.63% |
| CATY | Cathay General | | Regional Banks | 35.78 | 64 | 1.71% | -19.72% |
| WSR | Whitestone REIT | | REIT - Retail | 11.78 | 64 | 1.55% | -4.15% |
| REG | Regency Centers | | REIT - Retail | 60.02 | 64 | 1.54% | -10.42% |
| MITT | AG Mortgage | | Mortgage | 5.76 | 64 | 1.41% | -9.29% |
| SLF | Sun Life | | Insurance | 52.06 | 64 | 1.11% | 0.39% |
| ARR | ARMOUR Residential | | Mortgage | 18.83 | 64 | 1.07% | -2.54% |
| BRX | Brixmor Property | | REIT - Retail | 22.42 | 64 | 1.04% | -3.65% |
| CXE | MFS High | | Closed-End Fund - Debt | 3.56 | 64 | 0.85% | 0.42% |
| PKBK | Parke Bancorp | | Regional Banks | 16.71 | 64 | 0.60% | -17.48% |
| PFN | PIMCO ome | | Closed-End Fund - Debt | 7.38 | 64 | 0.54% | 2.07% |
| NRK | Nuveen New | | Investments | 10.77 | 64 | 0.47% | 2.28% |
| FTF | Franklin | | Asset Mgmt | 6.29 | 64 | 0.32% | 1.13% |
| EAD | Wells Fargo | | Asset Mgmt | 6.53 | 64 | 0.31% | 0.15% |
| AUBN | Auburn National | | Regional Banks | 18.15 | 64 | 0.28% | -14.71% |
| CMU | MFS High | | Closed-End Fund - Debt | 3.27 | 64 | 0.25% | -1.27% |
| CNDA | Concord Acquisition | | SPAC | 10.57 | 64 | 0.09% | 1.83% |
| GLRE | Greenlight Capital | | Insurance | 12.53 | 64 | -0.79% | 9.72% |
| DBL | DoubleLine Opportunistic | | Closed-End Fund - Debt | 14.91 | 64 | -0.70% | -2.83% |
| DSL | DoubleLine ome | | Closed-End Fund - Debt | 12.30 | 64 | -0.16% | 0.49% |
| AJG | Arthur J. | | Insurance | 238.54 | 64 | -0.11% | 6.07% |
| NTST | NetSTREIT | | REIT Retail | 17.09 | 64 | 0.53% | -4.31% |
| For chart view version of above stock list: Chart View ➞ 0 - 25 , 25 - 50 , 50 - 75 , 75 - 100 , 100 - 125 , 125 - 150 , 150 - 175 , 175 - 200 , 200 - 225 , 225 - 250 , 250 - 275 , 275 - 300 , 300 - 325 , 325 - 350 , 350 - 375 , 375 - 400 , 400 - 425 , 425 - 450 , 450 - 475 , 475 - 500 , 500 - 525 , 525 - 550 , 550 - 575 , 575 - 600 , 600 - 625 , 625 - 650 , 650 - 675 , 675 - 700 , 700 - 725 , 725 - 750 , 750 - 775 , 775 - 800 , 800 - 825 , 825 - 850 , 850 - 875 , 875 - 900 , 900 - 925 , 925 - 950 , 950 - 975 , 975 - 1000 , 1000 - 1025 , 1025 - 1050 , 1050 - 1075 , 1075 - 1100 , 1100 - 1125 , 1125 - 1150 , 1150 - 1175 , 1175 - 1200 , 1200 - 1225 , 1225 - 1250 | ||
 | Click To Change The Sort Order: By Market Cap or Company Size Performance: Year-to-date, Week and Day |  |
|
Get the most comprehensive stock market coverage daily at 12Stocks.com ➞ Best Stocks Today ➞ Best Stocks Weekly ➞ Best Stocks Year-to-Date ➞ Best Stocks Trends ➞  Best Stocks Today 12Stocks.com Best Nasdaq Stocks ➞ Best S&P 500 Stocks ➞ Best Tech Stocks ➞ Best Biotech Stocks ➞ |
| Detailed Overview of Financial Stocks |
| Financial Technical Overview, Leaders & Laggards, Top Financial ETF Funds & Detailed Financial Stocks List, Charts, Trends & More |
| Financial Sector: Technical Analysis, Trends & YTD Performance | |
| Financial sector is composed of stocks
from banks, brokers, insurance, REITs
and services subsectors. Financial sector, as represented by XLF, an exchange-traded fund [ETF] that holds basket of Financial stocks (e.g, Bank of America, Goldman Sachs) is up by 7.61% and is currently outperforming the overall market by 1.99% year-to-date. Below is a quick view of Technical charts and trends: |
|
 XLF Weekly Chart |
|
| Long Term Trend: Good | |
| Medium Term Trend: Good | |
 XLF Daily Chart |
|
| Short Term Trend: Not Good | |
| Overall Trend Score: 36 | |
| YTD Performance: 7.61% | |
| **Trend Scores & Views Are Only For Educational Purposes And Not For Investing | |
| 12Stocks.com: Top Performing Financial Sector Stocks | ||||||||||||||||||||||||||||||||||||||||||||||||
 The top performing Financial sector stocks year to date are
Now, more recently, over last week, the top performing Financial sector stocks on the move are


|
||||||||||||||||||||||||||||||||||||||||||||||||
| 12Stocks.com: Investing in Financial Sector using Exchange Traded Funds | |
|
The following table shows list of key exchange traded funds (ETF) that
help investors track Financial Index. For detailed view, check out our ETF Funds section of our website. Quick View: Move mouse or cursor over ETF symbol (ticker) to view short-term Technical chart and over ETF name to view long term chart. Click on ticker or stock name for detailed view. Click on to add stock symbol to your watchlist and to view watchlist. |
12Stocks.com List of ETFs that track Financial Index
| Ticker | ETF Name | Watchlist | Recent Price | Smart Investing & Trading Score | Change % | Week % | Year-to-date % |
| XLF | Financial | | 40.46 | 36 | 0.25 | -0.88 | 7.61% |
| IAI | Broker-Dealers & Secs | | 113.16 | 78 | 0.97 | 0.13 | 4.27% |
| IYF | Financials | | 92.12 | 59 | 0.49 | -0.05 | 7.86% |
| IYG | Financial Services | | 63.89 | 21 | 0.55 | -1.11 | 6.95% |
| KRE | Regional Banking | | 49.02 | 86 | 1.64 | 1.72 | -6.5% |
| IXG | Global Financials | | 84.11 | 66 | 0.61 | -0.1 | 7.04% |
| VFH | Financials | | 98.37 | 21 | 0.62 | -0.57 | 6.62% |
| KBE | Bank | | 45.86 | 100 | 1.30 | 1.17 | -0.35% |
| FAS | Financial Bull 3X | | 97.90 | 15 | 0.62 | -2.71 | 18.45% |
| FAZ | Financial Bear 3X | | 11.18 | 39 | -0.71 | 2.95 | -18.22% |
| UYG | Financials | | 62.44 | 28 | 0.47 | -1.9 | 13.12% |
| IAT | Regional Banks | | 41.90 | 79 | 0.96 | 0.43 | 0.14% |
| KIE | Insurance | | 49.29 | 54 | 0.28 | 1.57 | 9% |
| PSCF | SmallCap Financials | | 46.92 | 63 | 1.47 | 1.21 | -4.6% |
| EUFN | Europe Financials | | 22.59 | 71 | 1.62 | 0.58 | 7.78% |
| PGF | Financial Preferred | | 14.64 | 32 | 0.27 | 0.48 | 0.41% |
| 12Stocks.com: Charts, Trends, Fundamental Data and Performances of Financial Stocks | |
|
We now take in-depth look at all Financial stocks including charts, multi-period performances and overall trends (as measured by Smart Investing & Trading Score). One can sort Financial stocks (click link to choose) by Daily, Weekly and by Year-to-Date performances. Also, one can sort by size of the company or by market capitalization. |
| Select Your Default Chart Type: | |||||
| |||||
| Click on stock symbol or name for detailed view. Click on to add stock symbol to your watchlist and to view watchlist. Quick View: Move mouse or cursor over "Daily" to quickly view daily Technical stock chart and over "Weekly" to view weekly Technical stock chart. | |||||

 | NWFL Norwood Financial Corp. |
| Sector: Financials | |
| SubSector: Regional - Northeast Banks | |
| MarketCap: 201.899 Millions | |
| Recent Price: 25.28 Smart Investing & Trading Score: 64 | |
| Day Percent Change: 2.43% Day Change: 0.60 | |
| Week Change: 3.73% Year-to-date Change: -23.2% | |
| NWFL Links: Profile News Message Board | |
| Charts:- Daily , Weekly | |
| Add NWFL to Watchlist: View: Get Complete NWFL Trend Analysis ➞ | |
 | ESGR Enstar Group Limited |
| Sector: Financials | |
| SubSector: Property & Casualty Insurance | |
| MarketCap: 2886.02 Millions | |
| Recent Price: 299.51 Smart Investing & Trading Score: 64 | |
| Day Percent Change: 2.24% Day Change: 6.56 | |
| Week Change: 3.89% Year-to-date Change: 1.8% | |
| ESGR Links: Profile News Message Board | |
| Charts:- Daily , Weekly | |
| Add ESGR to Watchlist: View: Get Complete ESGR Trend Analysis ➞ | |
 | TIPT Tiptree Inc. |
| Sector: Financials | |
| SubSector: Life Insurance | |
| MarketCap: 183.486 Millions | |
| Recent Price: 16.47 Smart Investing & Trading Score: 64 | |
| Day Percent Change: 2.17% Day Change: 0.35 | |
| Week Change: 3.13% Year-to-date Change: -13.1% | |
| TIPT Links: Profile News Message Board | |
| Charts:- Daily , Weekly | |
| Add TIPT to Watchlist: View: Get Complete TIPT Trend Analysis ➞ | |
 | RNST Renasant Corporation |
| Sector: Financials | |
| SubSector: Money Center Banks | |
| MarketCap: 1279.39 Millions | |
| Recent Price: 30.10 Smart Investing & Trading Score: 64 | |
| Day Percent Change: 1.79% Day Change: 0.53 | |
| Week Change: 0.84% Year-to-date Change: -10.6% | |
| RNST Links: Profile News Message Board | |
| Charts:- Daily , Weekly | |
| Add RNST to Watchlist: View: Get Complete RNST Trend Analysis ➞ | |
 | CATY Cathay General Bancorp |
| Sector: Financials | |
| SubSector: Regional - Pacific Banks | |
| MarketCap: 1781.99 Millions | |
| Recent Price: 35.78 Smart Investing & Trading Score: 64 | |
| Day Percent Change: 1.71% Day Change: 0.60 | |
| Week Change: 2.11% Year-to-date Change: -19.7% | |
| CATY Links: Profile News Message Board | |
| Charts:- Daily , Weekly | |
| Add CATY to Watchlist: View: Get Complete CATY Trend Analysis ➞ | |
 | WSR Whitestone REIT |
| Sector: Financials | |
| SubSector: REIT - Retail | |
| MarketCap: 316.114 Millions | |
| Recent Price: 11.78 Smart Investing & Trading Score: 64 | |
| Day Percent Change: 1.55% Day Change: 0.18 | |
| Week Change: 3.61% Year-to-date Change: -4.2% | |
| WSR Links: Profile News Message Board | |
| Charts:- Daily , Weekly | |
| Add WSR to Watchlist: View: Get Complete WSR Trend Analysis ➞ | |
 | REG Regency Centers Corporation |
| Sector: Financials | |
| SubSector: REIT - Retail | |
| MarketCap: 6345.84 Millions | |
| Recent Price: 60.02 Smart Investing & Trading Score: 64 | |
| Day Percent Change: 1.54% Day Change: 0.91 | |
| Week Change: 2.99% Year-to-date Change: -10.4% | |
| REG Links: Profile News Message Board | |
| Charts:- Daily , Weekly | |
| Add REG to Watchlist: View: Get Complete REG Trend Analysis ➞ | |
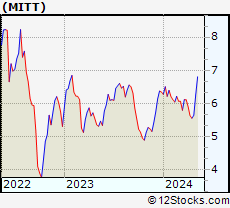 | MITT AG Mortgage Investment Trust, Inc. |
| Sector: Financials | |
| SubSector: Mortgage Investment | |
| MarketCap: 197.839 Millions | |
| Recent Price: 5.76 Smart Investing & Trading Score: 64 | |
| Day Percent Change: 1.41% Day Change: 0.08 | |
| Week Change: 1.95% Year-to-date Change: -9.3% | |
| MITT Links: Profile News Message Board | |
| Charts:- Daily , Weekly | |
| Add MITT to Watchlist: View: Get Complete MITT Trend Analysis ➞ | |
 | SLF Sun Life Financial Inc. |
| Sector: Financials | |
| SubSector: Property & Casualty Insurance | |
| MarketCap: 17722 Millions | |
| Recent Price: 52.06 Smart Investing & Trading Score: 64 | |
| Day Percent Change: 1.11% Day Change: 0.57 | |
| Week Change: 0.75% Year-to-date Change: 0.4% | |
| SLF Links: Profile News Message Board | |
| Charts:- Daily , Weekly | |
| Add SLF to Watchlist: View: Get Complete SLF Trend Analysis ➞ | |
 | ARR ARMOUR Residential REIT, Inc. |
| Sector: Financials | |
| SubSector: Mortgage Investment | |
| MarketCap: 578.739 Millions | |
| Recent Price: 18.83 Smart Investing & Trading Score: 64 | |
| Day Percent Change: 1.07% Day Change: 0.20 | |
| Week Change: 1.67% Year-to-date Change: -2.5% | |
| ARR Links: Profile News Message Board | |
| Charts:- Daily , Weekly | |
| Add ARR to Watchlist: View: Get Complete ARR Trend Analysis ➞ | |
 | BRX Brixmor Property Group Inc. |
| Sector: Financials | |
| SubSector: REIT - Retail | |
| MarketCap: 3561.54 Millions | |
| Recent Price: 22.42 Smart Investing & Trading Score: 64 | |
| Day Percent Change: 1.04% Day Change: 0.23 | |
| Week Change: 3.22% Year-to-date Change: -3.7% | |
| BRX Links: Profile News Message Board | |
| Charts:- Daily , Weekly | |
| Add BRX to Watchlist: View: Get Complete BRX Trend Analysis ➞ | |
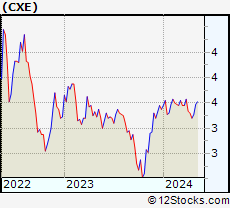 | CXE MFS High Income Municipal Trust |
| Sector: Financials | |
| SubSector: Closed-End Fund - Debt | |
| MarketCap: 129.807 Millions | |
| Recent Price: 3.56 Smart Investing & Trading Score: 64 | |
| Day Percent Change: 0.85% Day Change: 0.03 | |
| Week Change: 1.57% Year-to-date Change: 0.4% | |
| CXE Links: Profile News Message Board | |
| Charts:- Daily , Weekly | |
| Add CXE to Watchlist: View: Get Complete CXE Trend Analysis ➞ | |
 | PKBK Parke Bancorp, Inc. |
| Sector: Financials | |
| SubSector: Regional - Northeast Banks | |
| MarketCap: 165.799 Millions | |
| Recent Price: 16.71 Smart Investing & Trading Score: 64 | |
| Day Percent Change: 0.60% Day Change: 0.10 | |
| Week Change: 1.52% Year-to-date Change: -17.5% | |
| PKBK Links: Profile News Message Board | |
| Charts:- Daily , Weekly | |
| Add PKBK to Watchlist: View: Get Complete PKBK Trend Analysis ➞ | |
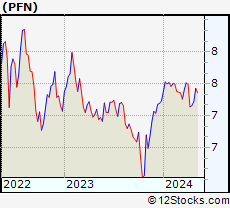 | PFN PIMCO Income Strategy Fund II |
| Sector: Financials | |
| SubSector: Closed-End Fund - Debt | |
| MarketCap: 469.507 Millions | |
| Recent Price: 7.38 Smart Investing & Trading Score: 64 | |
| Day Percent Change: 0.54% Day Change: 0.04 | |
| Week Change: 2.22% Year-to-date Change: 2.1% | |
| PFN Links: Profile News Message Board | |
| Charts:- Daily , Weekly | |
| Add PFN to Watchlist: View: Get Complete PFN Trend Analysis ➞ | |
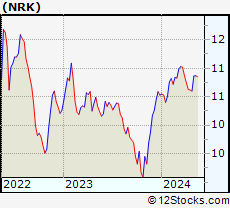 | NRK Nuveen New York AMT-Free Quality Municipal Income Fund |
| Sector: Financials | |
| SubSector: Diversified Investments | |
| MarketCap: 1006.7 Millions | |
| Recent Price: 10.77 Smart Investing & Trading Score: 64 | |
| Day Percent Change: 0.47% Day Change: 0.05 | |
| Week Change: 1.6% Year-to-date Change: 2.3% | |
| NRK Links: Profile News Message Board | |
| Charts:- Daily , Weekly | |
| Add NRK to Watchlist: View: Get Complete NRK Trend Analysis ➞ | |
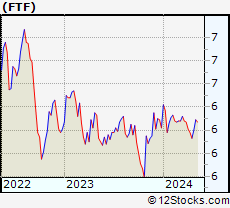 | FTF Franklin Limited Duration Income Trust |
| Sector: Financials | |
| SubSector: Asset Management | |
| MarketCap: 210.603 Millions | |
| Recent Price: 6.29 Smart Investing & Trading Score: 64 | |
| Day Percent Change: 0.32% Day Change: 0.02 | |
| Week Change: 1.45% Year-to-date Change: 1.1% | |
| FTF Links: Profile News Message Board | |
| Charts:- Daily , Weekly | |
| Add FTF to Watchlist: View: Get Complete FTF Trend Analysis ➞ | |
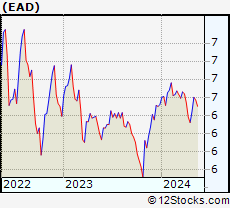 | EAD Wells Fargo Advantage Funds - Wells Fargo Income Opportunities Fund |
| Sector: Financials | |
| SubSector: Asset Management | |
| MarketCap: 332.403 Millions | |
| Recent Price: 6.53 Smart Investing & Trading Score: 64 | |
| Day Percent Change: 0.31% Day Change: 0.02 | |
| Week Change: 1.4% Year-to-date Change: 0.2% | |
| EAD Links: Profile News Message Board | |
| Charts:- Daily , Weekly | |
| Add EAD to Watchlist: View: Get Complete EAD Trend Analysis ➞ | |
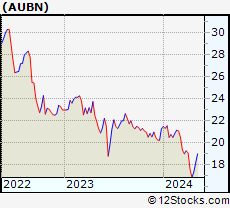 | AUBN Auburn National Bancorporation, Inc. |
| Sector: Financials | |
| SubSector: Regional - Southeast Banks | |
| MarketCap: 121.035 Millions | |
| Recent Price: 18.15 Smart Investing & Trading Score: 64 | |
| Day Percent Change: 0.28% Day Change: 0.05 | |
| Week Change: 4.61% Year-to-date Change: -14.7% | |
| AUBN Links: Profile News Message Board | |
| Charts:- Daily , Weekly | |
| Add AUBN to Watchlist: View: Get Complete AUBN Trend Analysis ➞ | |
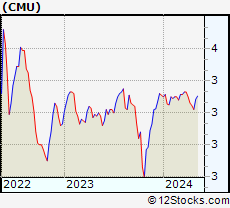 | CMU MFS High Yield Municipal Trust |
| Sector: Financials | |
| SubSector: Closed-End Fund - Debt | |
| MarketCap: 103.307 Millions | |
| Recent Price: 3.27 Smart Investing & Trading Score: 64 | |
| Day Percent Change: 0.25% Day Change: 0.01 | |
| Week Change: 1.46% Year-to-date Change: -1.3% | |
| CMU Links: Profile News Message Board | |
| Charts:- Daily , Weekly | |
| Add CMU to Watchlist: View: Get Complete CMU Trend Analysis ➞ | |
 | CNDA Concord Acquisition Corp II |
| Sector: Financials | |
| SubSector: SPAC | |
| MarketCap: 359 Millions | |
| Recent Price: 10.57 Smart Investing & Trading Score: 64 | |
| Day Percent Change: 0.09% Day Change: 0.01 | |
| Week Change: 0.09% Year-to-date Change: 1.8% | |
| CNDA Links: Profile News Message Board | |
| Charts:- Daily , Weekly | |
| Add CNDA to Watchlist: View: Get Complete CNDA Trend Analysis ➞ | |
 | GLRE Greenlight Capital Re, Ltd. |
| Sector: Financials | |
| SubSector: Accident & Health Insurance | |
| MarketCap: 228.66 Millions | |
| Recent Price: 12.53 Smart Investing & Trading Score: 64 | |
| Day Percent Change: -0.79% Day Change: -0.10 | |
| Week Change: 3.98% Year-to-date Change: 9.7% | |
| GLRE Links: Profile News Message Board | |
| Charts:- Daily , Weekly | |
| Add GLRE to Watchlist: View: Get Complete GLRE Trend Analysis ➞ | |
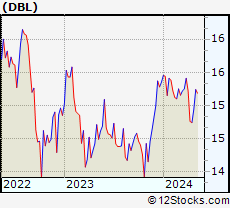 | DBL DoubleLine Opportunistic Credit Fund |
| Sector: Financials | |
| SubSector: Closed-End Fund - Debt | |
| MarketCap: 255.407 Millions | |
| Recent Price: 14.91 Smart Investing & Trading Score: 64 | |
| Day Percent Change: -0.70% Day Change: -0.11 | |
| Week Change: -0.17% Year-to-date Change: -2.8% | |
| DBL Links: Profile News Message Board | |
| Charts:- Daily , Weekly | |
| Add DBL to Watchlist: View: Get Complete DBL Trend Analysis ➞ | |
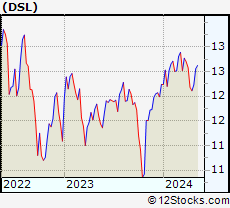 | DSL DoubleLine Income Solutions Fund |
| Sector: Financials | |
| SubSector: Closed-End Fund - Debt | |
| MarketCap: 1313.37 Millions | |
| Recent Price: 12.30 Smart Investing & Trading Score: 64 | |
| Day Percent Change: -0.16% Day Change: -0.02 | |
| Week Change: 0.57% Year-to-date Change: 0.5% | |
| DSL Links: Profile News Message Board | |
| Charts:- Daily , Weekly | |
| Add DSL to Watchlist: View: Get Complete DSL Trend Analysis ➞ | |
 | AJG Arthur J. Gallagher & Co. |
| Sector: Financials | |
| SubSector: Insurance Brokers | |
| MarketCap: 14852.2 Millions | |
| Recent Price: 238.54 Smart Investing & Trading Score: 64 | |
| Day Percent Change: -0.11% Day Change: -0.26 | |
| Week Change: 1.89% Year-to-date Change: 6.1% | |
| AJG Links: Profile News Message Board | |
| Charts:- Daily , Weekly | |
| Add AJG to Watchlist: View: Get Complete AJG Trend Analysis ➞ | |
 | NTST NetSTREIT Corp. |
| Sector: Financials | |
| SubSector: REIT Retail | |
| MarketCap: 51267 Millions | |
| Recent Price: 17.09 Smart Investing & Trading Score: 64 | |
| Day Percent Change: 0.53% Day Change: 0.09 | |
| Week Change: 0.53% Year-to-date Change: -4.3% | |
| NTST Links: Profile News Message Board | |
| Charts:- Daily , Weekly | |
| Add NTST to Watchlist: View: Get Complete NTST Trend Analysis ➞ | |
| For tabular summary view of above stock list: Summary View ➞ 0 - 25 , 25 - 50 , 50 - 75 , 75 - 100 , 100 - 125 , 125 - 150 , 150 - 175 , 175 - 200 , 200 - 225 , 225 - 250 , 250 - 275 , 275 - 300 , 300 - 325 , 325 - 350 , 350 - 375 , 375 - 400 , 400 - 425 , 425 - 450 , 450 - 475 , 475 - 500 , 500 - 525 , 525 - 550 , 550 - 575 , 575 - 600 , 600 - 625 , 625 - 650 , 650 - 675 , 675 - 700 , 700 - 725 , 725 - 750 , 750 - 775 , 775 - 800 , 800 - 825 , 825 - 850 , 850 - 875 , 875 - 900 , 900 - 925 , 925 - 950 , 950 - 975 , 975 - 1000 , 1000 - 1025 , 1025 - 1050 , 1050 - 1075 , 1075 - 1100 , 1100 - 1125 , 1125 - 1150 , 1150 - 1175 , 1175 - 1200 , 1200 - 1225 , 1225 - 1250 | ||
| Click To Change The Sort Order: By Market Cap or Company Size Performance: Year-to-date, Week and Day | |
| Select Chart Type: | ||
|
Best Stocks Today 12Stocks.com |
© 2024 12Stocks.com Terms & Conditions Privacy Contact Us
All Information Provided Only For Education And Not To Be Used For Investing or Trading. See Terms & Conditions


One More Thing ... Get Best Stocks Delivered Daily!
Never Ever Miss A Move With Our Top Ten Stocks Lists
Find Best Stocks In Any Market - Bull or Bear Market
Take A Peek At Our Top Ten Stocks Lists: Daily, Weekly, Year-to-Date & Top Trends
Find Best Stocks In Any Market - Bull or Bear Market
Take A Peek At Our Top Ten Stocks Lists: Daily, Weekly, Year-to-Date & Top Trends
Financial Stocks With Best Up Trends [0-bearish to 100-bullish]: KE [100], Regional Management[100], Noah [100], ING Groep[100], Markel [100], Genworth [100], Ventas [100], EverQuote [100], AXIS Capital[100], China Fund[100], KraneShares Trust[100]
Best Financial Stocks Year-to-Date:
Root [442.98%], Hippo [99.34%], Gladstone Capital[98.5%], Banco Macro[95.51%], Grupo Financiero[84.71%], Banco BBVA[76.47%], EverQuote [75.9%], Yiren Digital[74.68%], LendingTree [62.7%], Grupo Supervielle[60.34%], B. Riley[59.98%] Best Financial Stocks This Week:
LendingTree [30.16%], Office Properties[27.36%], Huize Holding[22.7%], Heartland [21.11%], Industrial Logistics[17.36%], Douglas Elliman[16.81%], LendingClub [15.19%], KE [13.55%], New York[13.47%], Territorial Bancorp[12.02%], SelectQuote [11.8%] Best Financial Stocks Daily:
Office Properties[28.00%], Huize Holding[13.70%], KE [12.64%], SelectQuote [11.80%], eXp World[10.84%], Coinbase Global[10.36%], Regional Management[8.03%], Noah [7.83%], Cipher Mining[7.74%], 360 Finance[7.05%], ING Groep[7.03%]