
 Login Sign Up


| |||||
 |  | ||||

| 12Stocks.com Market Intelligence |
Best Financial Stocks
| In a hurry? Financial Stocks Lists: Performance Trends Table, Stock Charts
Sort Financial stocks: Daily, Weekly, Year-to-Date, Market Cap & Trends. Filter Financial stocks list by size:All Financial Large Mid-Range Small & MicroCap |
| 12Stocks.com Financial Stocks Performances & Trends Daily | |||||||||
|
|  The overall Smart Investing & Trading Score is 36 (0-bearish to 100-bullish) which puts Financial sector in short term bearish to neutral trend. The Smart Investing & Trading Score from previous trading session is 21 and hence an improvement of trend.
| ||||||||
Here are the Smart Investing & Trading Scores of the most requested Financial stocks at 12Stocks.com (click stock name for detailed review):
|


| 12Stocks.com: Investing in Financial sector with Stocks | |
|
The following table helps investors and traders sort through current performance and trends (as measured by Smart Investing & Trading Score) of various
stocks in the Financial sector. Quick View: Move mouse or cursor over stock symbol (ticker) to view short-term Technical chart and over stock name to view long term chart. Click on  to add stock symbol to your watchlist and to add stock symbol to your watchlist and  to view watchlist. Click on any ticker or stock name for detailed market intelligence report for that stock. to view watchlist. Click on any ticker or stock name for detailed market intelligence report for that stock. |
12Stocks.com Performance of Stocks in Financial Sector
| Ticker | Stock Name | Watchlist | Category | Recent Price | Trend Score | Change % | YTD Change% |
| LMND | Lemonade |   | Insurance Property & Casualty | 17.74 | 75 | 2.31% | 9.98% |
| AUB | Atlantic Union | | Regional Banks | 33.34 | 75 | 2.21% | -8.76% |
| TWN | Taiwan Fund | | Closed-End Fund - Foreign | 39.32 | 75 | 1.39% | 13.67% |
| FEI | First Trust | | Closed-End Fund - Equity | 9.81 | 75 | 1.03% | 14.47% |
| CFG | Citizens | | Regional Banks | 34.99 | 75 | 0.84% | 5.58% |
| TEAF | Tortoise Essential | | Asset Mgmt | 11.54 | 75 | 0.79% | -1.45% |
| LND | BrasilAgro - | | Property Mgmt | 4.95 | 75 | 0.61% | -6.25% |
| AIRC | Apartment ome | | REIT | 38.52 | 75 | 0.06% | 10.37% |
| PDI | PIMCO Dynamic | | Closed-End Fund - Debt | 19.22 | 75 | 0.79% | 7.08% |
| EMD | Western Asset | | Closed-End Fund - Debt | 9.16 | 75 | 0.55% | -0.54% |
| PHD | Pioneer Floating | | Closed-End Fund - Debt | 9.64 | 75 | -0.10% | 5.13% |
| TBNK | Territorial Bancorp | | Regional Banks | 7.92 | 74 | 3.53% | -28.97% |
| NFBK | Northfield Bancorp | | Regional Banks | 8.87 | 74 | 3.50% | -29.49% |
| OPI | Office Properties | | REIT - Office | 2.56 | 74 | 28.00% | -65.03% |
| UHT | Universal Health | | REIT | 36.80 | 74 | 2.62% | -14.91% |
| GNL | Global Net | | REIT - | 7.10 | 74 | 2.60% | -28.64% |
| KIM | Kimco Realty | | REIT - Retail | 18.96 | 74 | 2.49% | -11.03% |
| PWOD | Penns Woods | | Regional Banks | 18.75 | 74 | 2.46% | -16.70% |
| FISI | Institutions | | Regional Banks | 17.83 | 74 | 2.29% | -16.29% |
| STHO | Star | | Financials Services | 12.35 | 74 | 2.07% | -17.67% |
| EXPI | eXp World | | Property Mgmt | 11.25 | 74 | 10.84% | -27.51% |
| BLFY | Blue Foundry | | Banks - Regional | 8.98 | 74 | 1.81% | -6.75% |
| SBCF | Seacoast Banking | | Regional Banks | 23.91 | 74 | 1.70% | -15.99% |
| EDOC | Global X | | Exchange Traded Fund | 9.02 | 74 | 1.58% | -11.22% |
| HQL | Tekla Life | | Closed-End Fund - Equity | 13.48 | 74 | 1.51% | 0.15% |
| For chart view version of above stock list: Chart View ➞ 0 - 25 , 25 - 50 , 50 - 75 , 75 - 100 , 100 - 125 , 125 - 150 , 150 - 175 , 175 - 200 , 200 - 225 , 225 - 250 , 250 - 275 , 275 - 300 , 300 - 325 , 325 - 350 , 350 - 375 , 375 - 400 , 400 - 425 , 425 - 450 , 450 - 475 , 475 - 500 , 500 - 525 , 525 - 550 , 550 - 575 , 575 - 600 , 600 - 625 , 625 - 650 , 650 - 675 , 675 - 700 , 700 - 725 , 725 - 750 , 750 - 775 , 775 - 800 , 800 - 825 , 825 - 850 , 850 - 875 , 875 - 900 , 900 - 925 , 925 - 950 , 950 - 975 , 975 - 1000 , 1000 - 1025 , 1025 - 1050 , 1050 - 1075 , 1075 - 1100 , 1100 - 1125 , 1125 - 1150 , 1150 - 1175 , 1175 - 1200 , 1200 - 1225 , 1225 - 1250 | ||
 | Click To Change The Sort Order: By Market Cap or Company Size Performance: Year-to-date, Week and Day |  |
|
Get the most comprehensive stock market coverage daily at 12Stocks.com ➞ Best Stocks Today ➞ Best Stocks Weekly ➞ Best Stocks Year-to-Date ➞ Best Stocks Trends ➞  Best Stocks Today 12Stocks.com Best Nasdaq Stocks ➞ Best S&P 500 Stocks ➞ Best Tech Stocks ➞ Best Biotech Stocks ➞ |
| Detailed Overview of Financial Stocks |
| Financial Technical Overview, Leaders & Laggards, Top Financial ETF Funds & Detailed Financial Stocks List, Charts, Trends & More |
| Financial Sector: Technical Analysis, Trends & YTD Performance | |
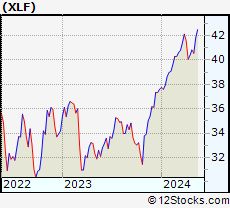
| Financial sector is composed of stocks
from banks, brokers, insurance, REITs
and services subsectors. Financial sector, as represented by XLF, an exchange-traded fund [ETF] that holds basket of Financial stocks (e.g, Bank of America, Goldman Sachs) is up by 7.61% and is currently outperforming the overall market by 1.99% year-to-date. Below is a quick view of Technical charts and trends: |
|
 XLF Weekly Chart |
|
| Long Term Trend: Good | |
| Medium Term Trend: Good | |
 XLF Daily Chart |
|
| Short Term Trend: Not Good | |
| Overall Trend Score: 36 | |
| YTD Performance: 7.61% | |
| **Trend Scores & Views Are Only For Educational Purposes And Not For Investing | |
| 12Stocks.com: Top Performing Financial Sector Stocks | ||||||||||||||||||||||||||||||||||||||||||||||||
 The top performing Financial sector stocks year to date are
Now, more recently, over last week, the top performing Financial sector stocks on the move are


|
||||||||||||||||||||||||||||||||||||||||||||||||
| 12Stocks.com: Investing in Financial Sector using Exchange Traded Funds | |
|
The following table shows list of key exchange traded funds (ETF) that
help investors track Financial Index. For detailed view, check out our ETF Funds section of our website. Quick View: Move mouse or cursor over ETF symbol (ticker) to view short-term Technical chart and over ETF name to view long term chart. Click on ticker or stock name for detailed view. Click on to add stock symbol to your watchlist and to view watchlist. |
12Stocks.com List of ETFs that track Financial Index
| Ticker | ETF Name | Watchlist | Recent Price | Smart Investing & Trading Score | Change % | Week % | Year-to-date % |
| XLF | Financial | | 40.46 | 36 | 0.25 | -0.88 | 7.61% |
| IAI | Broker-Dealers & Secs | | 113.16 | 78 | 0.97 | 0.13 | 4.27% |
| IYF | Financials | | 92.12 | 59 | 0.49 | -0.05 | 7.86% |
| IYG | Financial Services | | 63.89 | 46 | 0.55 | -1.11 | 6.95% |
| KRE | Regional Banking | | 49.02 | 86 | 1.64 | 1.72 | -6.5% |
| IXG | Global Financials | | 84.11 | 66 | 0.61 | -0.1 | 7.04% |
| VFH | Financials | | 98.37 | 46 | 0.62 | -0.57 | 6.62% |
| KBE | Bank | | 45.86 | 100 | 1.30 | 1.17 | -0.35% |
| FAS | Financial Bull 3X | | 97.90 | 15 | 0.62 | -2.71 | 18.45% |
| FAZ | Financial Bear 3X | | 11.18 | 39 | -0.71 | 2.95 | -18.22% |
| UYG | Financials | | 62.44 | 28 | 0.47 | -1.9 | 13.12% |
| IAT | Regional Banks | | 41.90 | 86 | 0.96 | 0.43 | 0.14% |
| KIE | Insurance | | 49.29 | 54 | 0.28 | 1.57 | 9% |
| PSCF | SmallCap Financials | | 46.92 | 93 | 1.47 | 1.21 | -4.6% |
| EUFN | Europe Financials | | 22.59 | 66 | 1.62 | 0.58 | 7.78% |
| PGF | Financial Preferred | | 14.64 | 25 | 0.27 | 0.48 | 0.41% |
| 12Stocks.com: Charts, Trends, Fundamental Data and Performances of Financial Stocks | |
|
We now take in-depth look at all Financial stocks including charts, multi-period performances and overall trends (as measured by Smart Investing & Trading Score). One can sort Financial stocks (click link to choose) by Daily, Weekly and by Year-to-Date performances. Also, one can sort by size of the company or by market capitalization. |
| Select Your Default Chart Type: | |||||
| |||||
| Click on stock symbol or name for detailed view. Click on to add stock symbol to your watchlist and to view watchlist. Quick View: Move mouse or cursor over "Daily" to quickly view daily Technical stock chart and over "Weekly" to view weekly Technical stock chart. | |||||

 | LMND Lemonade, Inc. |
| Sector: Financials | |
| SubSector: Insurance Property & Casualty | |
| MarketCap: 56457 Millions | |
| Recent Price: 17.74 Smart Investing & Trading Score: 75 | |
| Day Percent Change: 2.31% Day Change: 0.40 | |
| Week Change: -1.17% Year-to-date Change: 10.0% | |
| LMND Links: Profile News Message Board | |
| Charts:- Daily , Weekly | |
| Add LMND to Watchlist: View: Get Complete LMND Trend Analysis ➞ | |
 | AUB Atlantic Union Bankshares Corporation |
| Sector: Financials | |
| SubSector: Regional - Mid-Atlantic Banks | |
| MarketCap: 1728.79 Millions | |
| Recent Price: 33.34 Smart Investing & Trading Score: 75 | |
| Day Percent Change: 2.21% Day Change: 0.72 | |
| Week Change: 3.28% Year-to-date Change: -8.8% | |
| AUB Links: Profile News Message Board | |
| Charts:- Daily , Weekly | |
| Add AUB to Watchlist: View: Get Complete AUB Trend Analysis ➞ | |
 | TWN The Taiwan Fund, Inc. |
| Sector: Financials | |
| SubSector: Closed-End Fund - Foreign | |
| MarketCap: 110.547 Millions | |
| Recent Price: 39.32 Smart Investing & Trading Score: 75 | |
| Day Percent Change: 1.39% Day Change: 0.54 | |
| Week Change: 2.5% Year-to-date Change: 13.7% | |
| TWN Links: Profile News Message Board | |
| Charts:- Daily , Weekly | |
| Add TWN to Watchlist: View: Get Complete TWN Trend Analysis ➞ | |
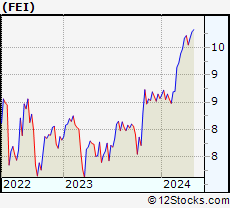 | FEI First Trust MLP and Energy Income Fund |
| Sector: Financials | |
| SubSector: Closed-End Fund - Equity | |
| MarketCap: 187.947 Millions | |
| Recent Price: 9.81 Smart Investing & Trading Score: 75 | |
| Day Percent Change: 1.03% Day Change: 0.10 | |
| Week Change: 0.2% Year-to-date Change: 14.5% | |
| FEI Links: Profile News Message Board | |
| Charts:- Daily , Weekly | |
| Add FEI to Watchlist: View: Get Complete FEI Trend Analysis ➞ | |
 | CFG Citizens Financial Group, Inc. |
| Sector: Financials | |
| SubSector: Regional - Mid-Atlantic Banks | |
| MarketCap: 8225.19 Millions | |
| Recent Price: 34.99 Smart Investing & Trading Score: 75 | |
| Day Percent Change: 0.84% Day Change: 0.29 | |
| Week Change: -0.46% Year-to-date Change: 5.6% | |
| CFG Links: Profile News Message Board | |
| Charts:- Daily , Weekly | |
| Add CFG to Watchlist: View: Get Complete CFG Trend Analysis ➞ | |
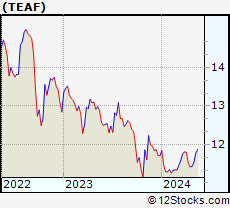 | TEAF Tortoise Essential Assets Income Term Fund |
| Sector: Financials | |
| SubSector: Asset Management | |
| MarketCap: 123.103 Millions | |
| Recent Price: 11.54 Smart Investing & Trading Score: 75 | |
| Day Percent Change: 0.79% Day Change: 0.09 | |
| Week Change: 0.96% Year-to-date Change: -1.5% | |
| TEAF Links: Profile News Message Board | |
| Charts:- Daily , Weekly | |
| Add TEAF to Watchlist: View: Get Complete TEAF Trend Analysis ➞ | |
 | LND BrasilAgro - Companhia Brasileira de Propriedades Agricolas |
| Sector: Financials | |
| SubSector: Property Management | |
| MarketCap: 157.842 Millions | |
| Recent Price: 4.95 Smart Investing & Trading Score: 75 | |
| Day Percent Change: 0.61% Day Change: 0.03 | |
| Week Change: 0% Year-to-date Change: -6.3% | |
| LND Links: Profile News Message Board | |
| Charts:- Daily , Weekly | |
| Add LND to Watchlist: View: Get Complete LND Trend Analysis ➞ | |
 | AIRC Apartment Income REIT Corp. |
| Sector: Financials | |
| SubSector: REIT - Residential | |
| MarketCap: 5280 Millions | |
| Recent Price: 38.52 Smart Investing & Trading Score: 75 | |
| Day Percent Change: 0.06% Day Change: 0.02 | |
| Week Change: 0.3% Year-to-date Change: 10.4% | |
| AIRC Links: Profile News Message Board | |
| Charts:- Daily , Weekly | |
| Add AIRC to Watchlist: View: Get Complete AIRC Trend Analysis ➞ | |
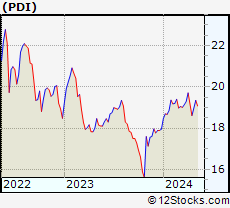 | PDI PIMCO Dynamic Income Fund |
| Sector: Financials | |
| SubSector: Closed-End Fund - Debt | |
| MarketCap: 1135.47 Millions | |
| Recent Price: 19.22 Smart Investing & Trading Score: 75 | |
| Day Percent Change: 0.79% Day Change: 0.15 | |
| Week Change: 1.37% Year-to-date Change: 7.1% | |
| PDI Links: Profile News Message Board | |
| Charts:- Daily , Weekly | |
| Add PDI to Watchlist: View: Get Complete PDI Trend Analysis ➞ | |
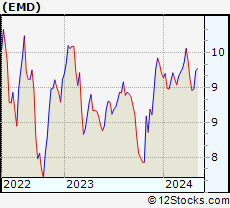 | EMD Western Asset Emerging Markets Debt Fund Inc. |
| Sector: Financials | |
| SubSector: Closed-End Fund - Debt | |
| MarketCap: 595.907 Millions | |
| Recent Price: 9.16 Smart Investing & Trading Score: 75 | |
| Day Percent Change: 0.55% Day Change: 0.05 | |
| Week Change: 2% Year-to-date Change: -0.5% | |
| EMD Links: Profile News Message Board | |
| Charts:- Daily , Weekly | |
| Add EMD to Watchlist: View: Get Complete EMD Trend Analysis ➞ | |
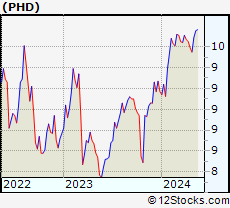 | PHD Pioneer Floating Rate Trust |
| Sector: Financials | |
| SubSector: Closed-End Fund - Debt | |
| MarketCap: 178.307 Millions | |
| Recent Price: 9.64 Smart Investing & Trading Score: 75 | |
| Day Percent Change: -0.10% Day Change: -0.01 | |
| Week Change: 0.94% Year-to-date Change: 5.1% | |
| PHD Links: Profile News Message Board | |
| Charts:- Daily , Weekly | |
| Add PHD to Watchlist: View: Get Complete PHD Trend Analysis ➞ | |
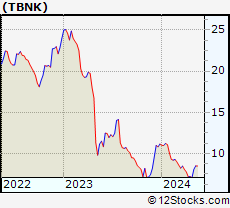 | TBNK Territorial Bancorp Inc. |
| Sector: Financials | |
| SubSector: Regional - Pacific Banks | |
| MarketCap: 220.029 Millions | |
| Recent Price: 7.92 Smart Investing & Trading Score: 74 | |
| Day Percent Change: 3.53% Day Change: 0.27 | |
| Week Change: 12.02% Year-to-date Change: -29.0% | |
| TBNK Links: Profile News Message Board | |
| Charts:- Daily , Weekly | |
| Add TBNK to Watchlist: View: Get Complete TBNK Trend Analysis ➞ | |
 | NFBK Northfield Bancorp, Inc. (Staten Island, NY) |
| Sector: Financials | |
| SubSector: Regional - Northeast Banks | |
| MarketCap: 540.699 Millions | |
| Recent Price: 8.87 Smart Investing & Trading Score: 74 | |
| Day Percent Change: 3.50% Day Change: 0.30 | |
| Week Change: 4.11% Year-to-date Change: -29.5% | |
| NFBK Links: Profile News Message Board | |
| Charts:- Daily , Weekly | |
| Add NFBK to Watchlist: View: Get Complete NFBK Trend Analysis ➞ | |
 | OPI Office Properties Income Trust |
| Sector: Financials | |
| SubSector: REIT - Office | |
| MarketCap: 1245.66 Millions | |
| Recent Price: 2.56 Smart Investing & Trading Score: 74 | |
| Day Percent Change: 28.00% Day Change: 0.56 | |
| Week Change: 27.36% Year-to-date Change: -65.0% | |
| OPI Links: Profile News Message Board | |
| Charts:- Daily , Weekly | |
| Add OPI to Watchlist: View: Get Complete OPI Trend Analysis ➞ | |
 | UHT Universal Health Realty Income Trust |
| Sector: Financials | |
| SubSector: REIT - Healthcare Facilities | |
| MarketCap: 1121.14 Millions | |
| Recent Price: 36.80 Smart Investing & Trading Score: 74 | |
| Day Percent Change: 2.62% Day Change: 0.94 | |
| Week Change: 6.17% Year-to-date Change: -14.9% | |
| UHT Links: Profile News Message Board | |
| Charts:- Daily , Weekly | |
| Add UHT to Watchlist: View: Get Complete UHT Trend Analysis ➞ | |
 | GNL Global Net Lease, Inc. |
| Sector: Financials | |
| SubSector: REIT - Diversified | |
| MarketCap: 1362.73 Millions | |
| Recent Price: 7.10 Smart Investing & Trading Score: 74 | |
| Day Percent Change: 2.60% Day Change: 0.18 | |
| Week Change: 2.75% Year-to-date Change: -28.6% | |
| GNL Links: Profile News Message Board | |
| Charts:- Daily , Weekly | |
| Add GNL to Watchlist: View: Get Complete GNL Trend Analysis ➞ | |
 | KIM Kimco Realty Corporation |
| Sector: Financials | |
| SubSector: REIT - Retail | |
| MarketCap: 5358.64 Millions | |
| Recent Price: 18.96 Smart Investing & Trading Score: 74 | |
| Day Percent Change: 2.49% Day Change: 0.46 | |
| Week Change: 3.16% Year-to-date Change: -11.0% | |
| KIM Links: Profile News Message Board | |
| Charts:- Daily , Weekly | |
| Add KIM to Watchlist: View: Get Complete KIM Trend Analysis ➞ | |
 | PWOD Penns Woods Bancorp, Inc. |
| Sector: Financials | |
| SubSector: Regional - Mid-Atlantic Banks | |
| MarketCap: 152.559 Millions | |
| Recent Price: 18.75 Smart Investing & Trading Score: 74 | |
| Day Percent Change: 2.46% Day Change: 0.45 | |
| Week Change: 7.05% Year-to-date Change: -16.7% | |
| PWOD Links: Profile News Message Board | |
| Charts:- Daily , Weekly | |
| Add PWOD to Watchlist: View: Get Complete PWOD Trend Analysis ➞ | |
 | FISI Financial Institutions, Inc. |
| Sector: Financials | |
| SubSector: Regional - Mid-Atlantic Banks | |
| MarketCap: 253.459 Millions | |
| Recent Price: 17.83 Smart Investing & Trading Score: 74 | |
| Day Percent Change: 2.29% Day Change: 0.40 | |
| Week Change: 1.31% Year-to-date Change: -16.3% | |
| FISI Links: Profile News Message Board | |
| Charts:- Daily , Weekly | |
| Add FISI to Watchlist: View: Get Complete FISI Trend Analysis ➞ | |
 | STHO Star Holdings |
| Sector: Financials | |
| SubSector: Financials Services | |
| MarketCap: 195 Millions | |
| Recent Price: 12.35 Smart Investing & Trading Score: 74 | |
| Day Percent Change: 2.07% Day Change: 0.25 | |
| Week Change: 5.33% Year-to-date Change: -17.7% | |
| STHO Links: Profile News Message Board | |
| Charts:- Daily , Weekly | |
| Add STHO to Watchlist: View: Get Complete STHO Trend Analysis ➞ | |
 | EXPI eXp World Holdings, Inc. |
| Sector: Financials | |
| SubSector: Property Management | |
| MarketCap: 448.042 Millions | |
| Recent Price: 11.25 Smart Investing & Trading Score: 74 | |
| Day Percent Change: 10.84% Day Change: 1.10 | |
| Week Change: 11.17% Year-to-date Change: -27.5% | |
| EXPI Links: Profile News Message Board | |
| Charts:- Daily , Weekly | |
| Add EXPI to Watchlist: View: Get Complete EXPI Trend Analysis ➞ | |
 | BLFY Blue Foundry Bancorp |
| Sector: Financials | |
| SubSector: Banks - Regional | |
| MarketCap: 264 Millions | |
| Recent Price: 8.98 Smart Investing & Trading Score: 74 | |
| Day Percent Change: 1.81% Day Change: 0.16 | |
| Week Change: 2.28% Year-to-date Change: -6.8% | |
| BLFY Links: Profile News Message Board | |
| Charts:- Daily , Weekly | |
| Add BLFY to Watchlist: View: Get Complete BLFY Trend Analysis ➞ | |
 | SBCF Seacoast Banking Corporation of Florida |
| Sector: Financials | |
| SubSector: Regional - Mid-Atlantic Banks | |
| MarketCap: 881.559 Millions | |
| Recent Price: 23.91 Smart Investing & Trading Score: 74 | |
| Day Percent Change: 1.70% Day Change: 0.40 | |
| Week Change: 2.27% Year-to-date Change: -16.0% | |
| SBCF Links: Profile News Message Board | |
| Charts:- Daily , Weekly | |
| Add SBCF to Watchlist: View: Get Complete SBCF Trend Analysis ➞ | |
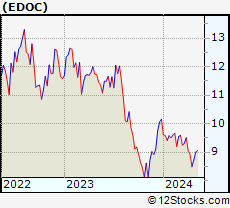 | EDOC Global X Telemedicine & Digital Health ETF |
| Sector: Financials | |
| SubSector: Exchange Traded Fund | |
| MarketCap: 60157 Millions | |
| Recent Price: 9.02 Smart Investing & Trading Score: 74 | |
| Day Percent Change: 1.58% Day Change: 0.14 | |
| Week Change: 3.32% Year-to-date Change: -11.2% | |
| EDOC Links: Profile News Message Board | |
| Charts:- Daily , Weekly | |
| Add EDOC to Watchlist: View: Get Complete EDOC Trend Analysis ➞ | |
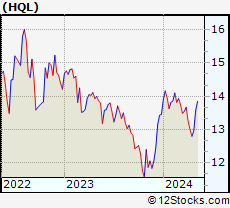 | HQL Tekla Life Sciences Investors |
| Sector: Financials | |
| SubSector: Closed-End Fund - Equity | |
| MarketCap: 289.947 Millions | |
| Recent Price: 13.48 Smart Investing & Trading Score: 74 | |
| Day Percent Change: 1.51% Day Change: 0.20 | |
| Week Change: 3.93% Year-to-date Change: 0.2% | |
| HQL Links: Profile News Message Board | |
| Charts:- Daily , Weekly | |
| Add HQL to Watchlist: View: Get Complete HQL Trend Analysis ➞ | |
| For tabular summary view of above stock list: Summary View ➞ 0 - 25 , 25 - 50 , 50 - 75 , 75 - 100 , 100 - 125 , 125 - 150 , 150 - 175 , 175 - 200 , 200 - 225 , 225 - 250 , 250 - 275 , 275 - 300 , 300 - 325 , 325 - 350 , 350 - 375 , 375 - 400 , 400 - 425 , 425 - 450 , 450 - 475 , 475 - 500 , 500 - 525 , 525 - 550 , 550 - 575 , 575 - 600 , 600 - 625 , 625 - 650 , 650 - 675 , 675 - 700 , 700 - 725 , 725 - 750 , 750 - 775 , 775 - 800 , 800 - 825 , 825 - 850 , 850 - 875 , 875 - 900 , 900 - 925 , 925 - 950 , 950 - 975 , 975 - 1000 , 1000 - 1025 , 1025 - 1050 , 1050 - 1075 , 1075 - 1100 , 1100 - 1125 , 1125 - 1150 , 1150 - 1175 , 1175 - 1200 , 1200 - 1225 , 1225 - 1250 | ||
| Click To Change The Sort Order: By Market Cap or Company Size Performance: Year-to-date, Week and Day | |
| Select Chart Type: | ||
|
Best Stocks Today 12Stocks.com |
© 2024 12Stocks.com Terms & Conditions Privacy Contact Us
All Information Provided Only For Education And Not To Be Used For Investing or Trading. See Terms & Conditions


One More Thing ... Get Best Stocks Delivered Daily!
Never Ever Miss A Move With Our Top Ten Stocks Lists
Find Best Stocks In Any Market - Bull or Bear Market
Take A Peek At Our Top Ten Stocks Lists: Daily, Weekly, Year-to-Date & Top Trends
Find Best Stocks In Any Market - Bull or Bear Market
Take A Peek At Our Top Ten Stocks Lists: Daily, Weekly, Year-to-Date & Top Trends
Financial Stocks With Best Up Trends [0-bearish to 100-bullish]: KE [100], Regional Management[100], Noah [100], 360 Finance[100], ING Groep[100], Markel [100], Genworth [100], Ventas [100], EverQuote [100], AXIS Capital[100], China Fund[100]
Best Financial Stocks Year-to-Date:
Root [442.98%], Hippo [99.34%], Gladstone Capital[98.5%], Banco Macro[95.51%], Grupo Financiero[84.71%], Banco BBVA[76.47%], EverQuote [75.9%], Yiren Digital[74.68%], LendingTree [62.7%], Grupo Supervielle[60.34%], B. Riley[59.98%] Best Financial Stocks This Week:
LendingTree [30.16%], Office Properties[27.36%], Huize Holding[22.7%], Heartland [21.11%], Industrial Logistics[17.36%], Douglas Elliman[16.81%], LendingClub [15.19%], KE [13.55%], New York[13.47%], Territorial Bancorp[12.02%], SelectQuote [11.8%] Best Financial Stocks Daily:
Office Properties[28.00%], Huize Holding[13.70%], KE [12.64%], SelectQuote [11.80%], eXp World[10.84%], Coinbase Global[10.36%], Regional Management[8.03%], Noah [7.83%], Cipher Mining[7.74%], 360 Finance[7.05%], ING Groep[7.03%]