
 Login Sign Up


| |||||
 |  | ||||

| 12Stocks.com Market Intelligence |
Best Financial Stocks
| In a hurry? Financial Stocks Lists: Performance Trends Table, Stock Charts
Sort Financial stocks: Daily, Weekly, Year-to-Date, Market Cap & Trends. Filter Financial stocks list by size:All Financial Large Mid-Range Small & MicroCap |
| 12Stocks.com Financial Stocks Performances & Trends Daily | |||||||||
|
|  The overall Smart Investing & Trading Score is 36 (0-bearish to 100-bullish) which puts Financial sector in short term bearish to neutral trend. The Smart Investing & Trading Score from previous trading session is 21 and hence an improvement of trend.
| ||||||||
Here are the Smart Investing & Trading Scores of the most requested Financial stocks at 12Stocks.com (click stock name for detailed review):
|


| 12Stocks.com: Investing in Financial sector with Stocks | |
|
The following table helps investors and traders sort through current performance and trends (as measured by Smart Investing & Trading Score) of various
stocks in the Financial sector. Quick View: Move mouse or cursor over stock symbol (ticker) to view short-term Technical chart and over stock name to view long term chart. Click on  to add stock symbol to your watchlist and to add stock symbol to your watchlist and  to view watchlist. Click on any ticker or stock name for detailed market intelligence report for that stock. to view watchlist. Click on any ticker or stock name for detailed market intelligence report for that stock. |
12Stocks.com Performance of Stocks in Financial Sector
| Ticker | Stock Name | Watchlist | Category | Recent Price | Trend Score | Change % | YTD Change% |
| CHMI | Cherry Hill |   | Mortgage | 3.49 | 60 | 0.29% | -13.61% |
| WPC | W. P. | | REIT - | 55.92 | 60 | 2.36% | -13.72% |
| NREF | NexPoint Real | | REIT | 13.23 | 60 | 2.16% | -15.92% |
| ECPG | Encore Capital | | Asset Mgmt | 42.50 | 60 | 1.72% | -16.26% |
| IQSI | IQ Candriam | | Exchange Traded Fund | 29.10 | 60 | 1.28% | 3.14% |
| AVK | Advent Convertible | | Closed-End Fund - Debt | 11.73 | 60 | 0.86% | 3.08% |
| PFG | Pripal | | Life Insurance | 80.48 | 60 | 0.79% | 2.30% |
| KREF | KKR Real | | Mortgage | 9.67 | 60 | 0.21% | -26.91% |
| RA | Brookfield Real | | Asset Mgmt | 12.66 | 60 | 0.08% | -1.17% |
| BDJ | BlackRock Enhanced | | Closed-End Fund - Equity | 8.05 | 60 | 0.00% | 4.68% |
| AJX | Great Ajax | | Mortgage | 3.73 | 59 | 2.19% | -29.62% |
| SLQT | SelectQuote | | Insurance | 1.80 | 59 | 11.80% | 31.39% |
| TRUP | Trupanion | | Insurance | 23.78 | 59 | 1.97% | -22.06% |
| MKTX | MarketAxess | | Brokerage | 209.12 | 59 | 1.40% | -28.59% |
| ACRE | Ares Commercial | | Mortgage | 6.99 | 59 | 0.87% | -32.53% |
| NLY | Annaly Capital | | Mortgage | 19.07 | 59 | 0.53% | -1.55% |
| FTHM | Fathom | | Real Estate Services | 1.59 | 59 | -3.05% | -54.70% |
| PFIS | Peoples | | Regional Banks | 38.50 | 59 | -1.26% | -20.94% |
| BCBP | BCB Bancorp | | Regional Banks | 9.69 | 59 | -0.41% | -24.59% |
| FCT | First Trust | | Closed-End Fund - Debt | 10.31 | 59 | 0.59% | 2.18% |
| AFL | Aflac | | Insurance | 84.04 | 59 | -0.63% | 1.87% |
| CIFR | Cipher Mining | | Capital Markets | 3.96 | 58 | 7.74% | -3.53% |
| ATLCP | Atlanticus | | Credit Services | 22.79 | 58 | 2.79% | 0.35% |
| MFG | Mizuho | | Foreign Banks | 3.91 | 58 | 1.56% | 13.66% |
| TYG | Tortoise Energy | | Closed-End Fund - Equity | 31.14 | 58 | 1.10% | 8.24% |
| For chart view version of above stock list: Chart View ➞ 0 - 25 , 25 - 50 , 50 - 75 , 75 - 100 , 100 - 125 , 125 - 150 , 150 - 175 , 175 - 200 , 200 - 225 , 225 - 250 , 250 - 275 , 275 - 300 , 300 - 325 , 325 - 350 , 350 - 375 , 375 - 400 , 400 - 425 , 425 - 450 , 450 - 475 , 475 - 500 , 500 - 525 , 525 - 550 , 550 - 575 , 575 - 600 , 600 - 625 , 625 - 650 , 650 - 675 , 675 - 700 , 700 - 725 , 725 - 750 , 750 - 775 , 775 - 800 , 800 - 825 , 825 - 850 , 850 - 875 , 875 - 900 , 900 - 925 , 925 - 950 , 950 - 975 , 975 - 1000 , 1000 - 1025 , 1025 - 1050 , 1050 - 1075 , 1075 - 1100 , 1100 - 1125 , 1125 - 1150 , 1150 - 1175 , 1175 - 1200 , 1200 - 1225 , 1225 - 1250 | ||
 | Click To Change The Sort Order: By Market Cap or Company Size Performance: Year-to-date, Week and Day |  |
|
Get the most comprehensive stock market coverage daily at 12Stocks.com ➞ Best Stocks Today ➞ Best Stocks Weekly ➞ Best Stocks Year-to-Date ➞ Best Stocks Trends ➞  Best Stocks Today 12Stocks.com Best Nasdaq Stocks ➞ Best S&P 500 Stocks ➞ Best Tech Stocks ➞ Best Biotech Stocks ➞ |
| Detailed Overview of Financial Stocks |
| Financial Technical Overview, Leaders & Laggards, Top Financial ETF Funds & Detailed Financial Stocks List, Charts, Trends & More |
| Financial Sector: Technical Analysis, Trends & YTD Performance | |
| Financial sector is composed of stocks
from banks, brokers, insurance, REITs
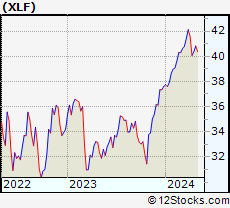
and services subsectors. Financial sector, as represented by XLF, an exchange-traded fund [ETF] that holds basket of Financial stocks (e.g, Bank of America, Goldman Sachs) is up by 7.61% and is currently outperforming the overall market by 1.99% year-to-date. Below is a quick view of Technical charts and trends: |
|
 XLF Weekly Chart |
|
| Long Term Trend: Good | |
| Medium Term Trend: Good | |
 XLF Daily Chart |
|
| Short Term Trend: Not Good | |
| Overall Trend Score: 36 | |
| YTD Performance: 7.61% | |
| **Trend Scores & Views Are Only For Educational Purposes And Not For Investing | |
| 12Stocks.com: Top Performing Financial Sector Stocks | ||||||||||||||||||||||||||||||||||||||||||||||||
 The top performing Financial sector stocks year to date are
Now, more recently, over last week, the top performing Financial sector stocks on the move are


|
||||||||||||||||||||||||||||||||||||||||||||||||
| 12Stocks.com: Investing in Financial Sector using Exchange Traded Funds | |
|
The following table shows list of key exchange traded funds (ETF) that
help investors track Financial Index. For detailed view, check out our ETF Funds section of our website. Quick View: Move mouse or cursor over ETF symbol (ticker) to view short-term Technical chart and over ETF name to view long term chart. Click on ticker or stock name for detailed view. Click on to add stock symbol to your watchlist and to view watchlist. |
12Stocks.com List of ETFs that track Financial Index
| Ticker | ETF Name | Watchlist | Recent Price | Smart Investing & Trading Score | Change % | Week % | Year-to-date % |
| XLF | Financial | | 40.46 | 36 | 0.25 | -0.88 | 7.61% |
| IAI | Broker-Dealers & Secs | | 113.16 | 78 | 0.97 | 0.13 | 4.27% |
| IYF | Financials | | 92.12 | 59 | 0.49 | -0.05 | 7.86% |
| IYG | Financial Services | | 63.89 | 46 | 0.55 | -1.11 | 6.95% |
| KRE | Regional Banking | | 49.02 | 86 | 1.64 | 1.72 | -6.5% |
| IXG | Global Financials | | 84.11 | 66 | 0.61 | -0.1 | 7.04% |
| VFH | Financials | | 98.37 | 46 | 0.62 | -0.57 | 6.62% |
| KBE | Bank | | 45.86 | 100 | 1.30 | 1.17 | -0.35% |
| FAS | Financial Bull 3X | | 97.90 | 15 | 0.62 | -2.71 | 18.45% |
| FAZ | Financial Bear 3X | | 11.18 | 39 | -0.71 | 2.95 | -18.22% |
| UYG | Financials | | 62.44 | 28 | 0.47 | -1.9 | 13.12% |
| IAT | Regional Banks | | 41.90 | 86 | 0.96 | 0.43 | 0.14% |
| KIE | Insurance | | 49.29 | 54 | 0.28 | 1.57 | 9% |
| PSCF | SmallCap Financials | | 46.92 | 93 | 1.47 | 1.21 | -4.6% |
| EUFN | Europe Financials | | 22.59 | 66 | 1.62 | 0.58 | 7.78% |
| PGF | Financial Preferred | | 14.64 | 25 | 0.27 | 0.48 | 0.41% |
| 12Stocks.com: Charts, Trends, Fundamental Data and Performances of Financial Stocks | |
|
We now take in-depth look at all Financial stocks including charts, multi-period performances and overall trends (as measured by Smart Investing & Trading Score). One can sort Financial stocks (click link to choose) by Daily, Weekly and by Year-to-Date performances. Also, one can sort by size of the company or by market capitalization. |
| Select Your Default Chart Type: | |||||
| |||||
| Click on stock symbol or name for detailed view. Click on to add stock symbol to your watchlist and to view watchlist. Quick View: Move mouse or cursor over "Daily" to quickly view daily Technical stock chart and over "Weekly" to view weekly Technical stock chart. | |||||

 | CHMI Cherry Hill Mortgage Investment Corporation |
| Sector: Financials | |
| SubSector: Mortgage Investment | |
| MarketCap: 124.839 Millions | |
| Recent Price: 3.49 Smart Investing & Trading Score: 60 | |
| Day Percent Change: 0.29% Day Change: 0.01 | |
| Week Change: 1.75% Year-to-date Change: -13.6% | |
| CHMI Links: Profile News Message Board | |
| Charts:- Daily , Weekly | |
| Add CHMI to Watchlist: View: Get Complete CHMI Trend Analysis ➞ | |
 | WPC W. P. Carey Inc. |
| Sector: Financials | |
| SubSector: REIT - Diversified | |
| MarketCap: 9560.03 Millions | |
| Recent Price: 55.92 Smart Investing & Trading Score: 60 | |
| Day Percent Change: 2.36% Day Change: 1.29 | |
| Week Change: 1.62% Year-to-date Change: -13.7% | |
| WPC Links: Profile News Message Board | |
| Charts:- Daily , Weekly | |
| Add WPC to Watchlist: View: Get Complete WPC Trend Analysis ➞ | |
 | NREF NexPoint Real Estate Finance, Inc. |
| Sector: Financials | |
| SubSector: REIT Diversified | |
| MarketCap: 97267 Millions | |
| Recent Price: 13.23 Smart Investing & Trading Score: 60 | |
| Day Percent Change: 2.16% Day Change: 0.28 | |
| Week Change: -0.23% Year-to-date Change: -15.9% | |
| NREF Links: Profile News Message Board | |
| Charts:- Daily , Weekly | |
| Add NREF to Watchlist: View: Get Complete NREF Trend Analysis ➞ | |
 | ECPG Encore Capital Group, Inc. |
| Sector: Financials | |
| SubSector: Asset Management | |
| MarketCap: 661.503 Millions | |
| Recent Price: 42.50 Smart Investing & Trading Score: 60 | |
| Day Percent Change: 1.72% Day Change: 0.72 | |
| Week Change: 2.09% Year-to-date Change: -16.3% | |
| ECPG Links: Profile News Message Board | |
| Charts:- Daily , Weekly | |
| Add ECPG to Watchlist: View: Get Complete ECPG Trend Analysis ➞ | |
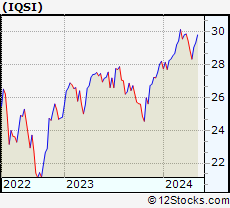 | IQSI IQ Candriam ESG International Equity ETF |
| Sector: Financials | |
| SubSector: Exchange Traded Fund | |
| MarketCap: 60157 Millions | |
| Recent Price: 29.10 Smart Investing & Trading Score: 60 | |
| Day Percent Change: 1.28% Day Change: 0.37 | |
| Week Change: 0.11% Year-to-date Change: 3.1% | |
| IQSI Links: Profile News Message Board | |
| Charts:- Daily , Weekly | |
| Add IQSI to Watchlist: View: Get Complete IQSI Trend Analysis ➞ | |
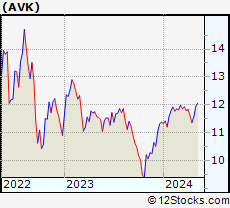 | AVK Advent Convertible and Income Fund |
| Sector: Financials | |
| SubSector: Closed-End Fund - Debt | |
| MarketCap: 354.207 Millions | |
| Recent Price: 11.73 Smart Investing & Trading Score: 60 | |
| Day Percent Change: 0.86% Day Change: 0.10 | |
| Week Change: 1.38% Year-to-date Change: 3.1% | |
| AVK Links: Profile News Message Board | |
| Charts:- Daily , Weekly | |
| Add AVK to Watchlist: View: Get Complete AVK Trend Analysis ➞ | |
 | PFG Principal Financial Group, Inc. |
| Sector: Financials | |
| SubSector: Life Insurance | |
| MarketCap: 8178.86 Millions | |
| Recent Price: 80.48 Smart Investing & Trading Score: 60 | |
| Day Percent Change: 0.79% Day Change: 0.63 | |
| Week Change: 1.72% Year-to-date Change: 2.3% | |
| PFG Links: Profile News Message Board | |
| Charts:- Daily , Weekly | |
| Add PFG to Watchlist: View: Get Complete PFG Trend Analysis ➞ | |
 | KREF KKR Real Estate Finance Trust Inc. |
| Sector: Financials | |
| SubSector: Mortgage Investment | |
| MarketCap: 645.939 Millions | |
| Recent Price: 9.67 Smart Investing & Trading Score: 60 | |
| Day Percent Change: 0.21% Day Change: 0.02 | |
| Week Change: 0.52% Year-to-date Change: -26.9% | |
| KREF Links: Profile News Message Board | |
| Charts:- Daily , Weekly | |
| Add KREF to Watchlist: View: Get Complete KREF Trend Analysis ➞ | |
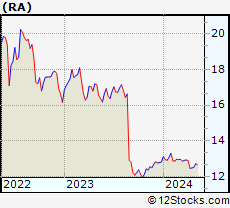 | RA Brookfield Real Assets Income Fund Inc. |
| Sector: Financials | |
| SubSector: Asset Management | |
| MarketCap: 497.703 Millions | |
| Recent Price: 12.66 Smart Investing & Trading Score: 60 | |
| Day Percent Change: 0.08% Day Change: 0.01 | |
| Week Change: 1.2% Year-to-date Change: -1.2% | |
| RA Links: Profile News Message Board | |
| Charts:- Daily , Weekly | |
| Add RA to Watchlist: View: Get Complete RA Trend Analysis ➞ | |
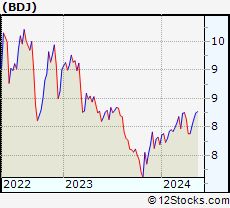 | BDJ BlackRock Enhanced Equity Dividend Trust |
| Sector: Financials | |
| SubSector: Closed-End Fund - Equity | |
| MarketCap: 1031.47 Millions | |
| Recent Price: 8.05 Smart Investing & Trading Score: 60 | |
| Day Percent Change: 0.00% Day Change: 0.00 | |
| Week Change: 0.37% Year-to-date Change: 4.7% | |
| BDJ Links: Profile News Message Board | |
| Charts:- Daily , Weekly | |
| Add BDJ to Watchlist: View: Get Complete BDJ Trend Analysis ➞ | |
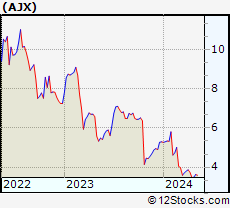 | AJX Great Ajax Corp. |
| Sector: Financials | |
| SubSector: Mortgage Investment | |
| MarketCap: 154.539 Millions | |
| Recent Price: 3.73 Smart Investing & Trading Score: 59 | |
| Day Percent Change: 2.19% Day Change: 0.08 | |
| Week Change: 6.88% Year-to-date Change: -29.6% | |
| AJX Links: Profile News Message Board | |
| Charts:- Daily , Weekly | |
| Add AJX to Watchlist: View: Get Complete AJX Trend Analysis ➞ | |
 | SLQT SelectQuote, Inc. |
| Sector: Financials | |
| SubSector: Insurance Brokers | |
| MarketCap: 38257 Millions | |
| Recent Price: 1.80 Smart Investing & Trading Score: 59 | |
| Day Percent Change: 11.80% Day Change: 0.19 | |
| Week Change: 11.8% Year-to-date Change: 31.4% | |
| SLQT Links: Profile News Message Board | |
| Charts:- Daily , Weekly | |
| Add SLQT to Watchlist: View: Get Complete SLQT Trend Analysis ➞ | |
 | TRUP Trupanion, Inc. |
| Sector: Financials | |
| SubSector: Accident & Health Insurance | |
| MarketCap: 852.06 Millions | |
| Recent Price: 23.78 Smart Investing & Trading Score: 59 | |
| Day Percent Change: 1.97% Day Change: 0.46 | |
| Week Change: -1.41% Year-to-date Change: -22.1% | |
| TRUP Links: Profile News Message Board | |
| Charts:- Daily , Weekly | |
| Add TRUP to Watchlist: View: Get Complete TRUP Trend Analysis ➞ | |
 | MKTX MarketAxess Holdings Inc. |
| Sector: Financials | |
| SubSector: Investment Brokerage - National | |
| MarketCap: 12431.5 Millions | |
| Recent Price: 209.12 Smart Investing & Trading Score: 59 | |
| Day Percent Change: 1.40% Day Change: 2.88 | |
| Week Change: 3.63% Year-to-date Change: -28.6% | |
| MKTX Links: Profile News Message Board | |
| Charts:- Daily , Weekly | |
| Add MKTX to Watchlist: View: Get Complete MKTX Trend Analysis ➞ | |
 | ACRE Ares Commercial Real Estate Corporation |
| Sector: Financials | |
| SubSector: Mortgage Investment | |
| MarketCap: 242.339 Millions | |
| Recent Price: 6.99 Smart Investing & Trading Score: 59 | |
| Day Percent Change: 0.87% Day Change: 0.06 | |
| Week Change: 2.04% Year-to-date Change: -32.5% | |
| ACRE Links: Profile News Message Board | |
| Charts:- Daily , Weekly | |
| Add ACRE to Watchlist: View: Get Complete ACRE Trend Analysis ➞ | |
 | NLY Annaly Capital Management, Inc. |
| Sector: Financials | |
| SubSector: Mortgage Investment | |
| MarketCap: 9127.79 Millions | |
| Recent Price: 19.07 Smart Investing & Trading Score: 59 | |
| Day Percent Change: 0.53% Day Change: 0.10 | |
| Week Change: 1.01% Year-to-date Change: -1.6% | |
| NLY Links: Profile News Message Board | |
| Charts:- Daily , Weekly | |
| Add NLY to Watchlist: View: Get Complete NLY Trend Analysis ➞ | |
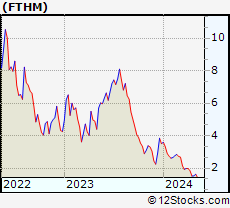 | FTHM Fathom Holdings Inc. |
| Sector: Financials | |
| SubSector: Real Estate Services | |
| MarketCap: 37267 Millions | |
| Recent Price: 1.59 Smart Investing & Trading Score: 59 | |
| Day Percent Change: -3.05% Day Change: -0.05 | |
| Week Change: 3.92% Year-to-date Change: -54.7% | |
| FTHM Links: Profile News Message Board | |
| Charts:- Daily , Weekly | |
| Add FTHM to Watchlist: View: Get Complete FTHM Trend Analysis ➞ | |
 | PFIS Peoples Financial Services Corp. |
| Sector: Financials | |
| SubSector: Regional - Northeast Banks | |
| MarketCap: 305.499 Millions | |
| Recent Price: 38.50 Smart Investing & Trading Score: 59 | |
| Day Percent Change: -1.26% Day Change: -0.49 | |
| Week Change: 0.57% Year-to-date Change: -20.9% | |
| PFIS Links: Profile News Message Board | |
| Charts:- Daily , Weekly | |
| Add PFIS to Watchlist: View: Get Complete PFIS Trend Analysis ➞ | |
 | BCBP BCB Bancorp, Inc. |
| Sector: Financials | |
| SubSector: Regional - Northeast Banks | |
| MarketCap: 196.799 Millions | |
| Recent Price: 9.69 Smart Investing & Trading Score: 59 | |
| Day Percent Change: -0.41% Day Change: -0.04 | |
| Week Change: 2.43% Year-to-date Change: -24.6% | |
| BCBP Links: Profile News Message Board | |
| Charts:- Daily , Weekly | |
| Add BCBP to Watchlist: View: Get Complete BCBP Trend Analysis ➞ | |
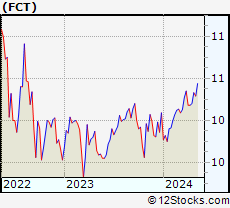 | FCT First Trust Senior Floating Rate Income Fund II |
| Sector: Financials | |
| SubSector: Closed-End Fund - Debt | |
| MarketCap: 212.407 Millions | |
| Recent Price: 10.31 Smart Investing & Trading Score: 59 | |
| Day Percent Change: 0.59% Day Change: 0.06 | |
| Week Change: -0.19% Year-to-date Change: 2.2% | |
| FCT Links: Profile News Message Board | |
| Charts:- Daily , Weekly | |
| Add FCT to Watchlist: View: Get Complete FCT Trend Analysis ➞ | |
 | AFL Aflac Incorporated |
| Sector: Financials | |
| SubSector: Accident & Health Insurance | |
| MarketCap: 22706 Millions | |
| Recent Price: 84.04 Smart Investing & Trading Score: 59 | |
| Day Percent Change: -0.63% Day Change: -0.53 | |
| Week Change: 0.51% Year-to-date Change: 1.9% | |
| AFL Links: Profile News Message Board | |
| Charts:- Daily , Weekly | |
| Add AFL to Watchlist: View: Get Complete AFL Trend Analysis ➞ | |
 | CIFR Cipher Mining Inc. |
| Sector: Financials | |
| SubSector: Capital Markets | |
| MarketCap: 712 Millions | |
| Recent Price: 3.96 Smart Investing & Trading Score: 58 | |
| Day Percent Change: 7.74% Day Change: 0.28 | |
| Week Change: -11.69% Year-to-date Change: -3.5% | |
| CIFR Links: Profile News Message Board | |
| Charts:- Daily , Weekly | |
| Add CIFR to Watchlist: View: Get Complete CIFR Trend Analysis ➞ | |
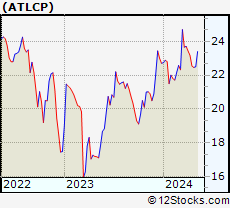 | ATLCP Atlanticus Holdings Corporation |
| Sector: Financials | |
| SubSector: Credit Services | |
| MarketCap: 608 Millions | |
| Recent Price: 22.79 Smart Investing & Trading Score: 58 | |
| Day Percent Change: 2.79% Day Change: 0.62 | |
| Week Change: 1.46% Year-to-date Change: 0.4% | |
| ATLCP Links: Profile News Message Board | |
| Charts:- Daily , Weekly | |
| Add ATLCP to Watchlist: View: Get Complete ATLCP Trend Analysis ➞ | |
 | MFG Mizuho Financial Group, Inc. |
| Sector: Financials | |
| SubSector: Foreign Regional Banks | |
| MarketCap: 27893.1 Millions | |
| Recent Price: 3.91 Smart Investing & Trading Score: 58 | |
| Day Percent Change: 1.56% Day Change: 0.06 | |
| Week Change: 1.56% Year-to-date Change: 13.7% | |
| MFG Links: Profile News Message Board | |
| Charts:- Daily , Weekly | |
| Add MFG to Watchlist: View: Get Complete MFG Trend Analysis ➞ | |
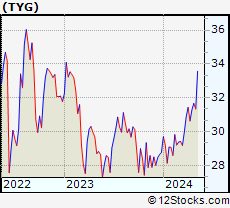 | TYG Tortoise Energy Infrastructure Corporation |
| Sector: Financials | |
| SubSector: Closed-End Fund - Equity | |
| MarketCap: 140.547 Millions | |
| Recent Price: 31.14 Smart Investing & Trading Score: 58 | |
| Day Percent Change: 1.10% Day Change: 0.34 | |
| Week Change: -1.67% Year-to-date Change: 8.2% | |
| TYG Links: Profile News Message Board | |
| Charts:- Daily , Weekly | |
| Add TYG to Watchlist: View: Get Complete TYG Trend Analysis ➞ | |
| For tabular summary view of above stock list: Summary View ➞ 0 - 25 , 25 - 50 , 50 - 75 , 75 - 100 , 100 - 125 , 125 - 150 , 150 - 175 , 175 - 200 , 200 - 225 , 225 - 250 , 250 - 275 , 275 - 300 , 300 - 325 , 325 - 350 , 350 - 375 , 375 - 400 , 400 - 425 , 425 - 450 , 450 - 475 , 475 - 500 , 500 - 525 , 525 - 550 , 550 - 575 , 575 - 600 , 600 - 625 , 625 - 650 , 650 - 675 , 675 - 700 , 700 - 725 , 725 - 750 , 750 - 775 , 775 - 800 , 800 - 825 , 825 - 850 , 850 - 875 , 875 - 900 , 900 - 925 , 925 - 950 , 950 - 975 , 975 - 1000 , 1000 - 1025 , 1025 - 1050 , 1050 - 1075 , 1075 - 1100 , 1100 - 1125 , 1125 - 1150 , 1150 - 1175 , 1175 - 1200 , 1200 - 1225 , 1225 - 1250 | ||
| Click To Change The Sort Order: By Market Cap or Company Size Performance: Year-to-date, Week and Day | |
| Select Chart Type: | ||
|
Best Stocks Today 12Stocks.com |
© 2024 12Stocks.com Terms & Conditions Privacy Contact Us
All Information Provided Only For Education And Not To Be Used For Investing or Trading. See Terms & Conditions


One More Thing ... Get Best Stocks Delivered Daily!
Never Ever Miss A Move With Our Top Ten Stocks Lists
Find Best Stocks In Any Market - Bull or Bear Market
Take A Peek At Our Top Ten Stocks Lists: Daily, Weekly, Year-to-Date & Top Trends
Find Best Stocks In Any Market - Bull or Bear Market
Take A Peek At Our Top Ten Stocks Lists: Daily, Weekly, Year-to-Date & Top Trends
Financial Stocks With Best Up Trends [0-bearish to 100-bullish]: KE [100], Regional Management[100], Noah [100], 360 Finance[100], ING Groep[100], Markel [100], Genworth [100], Ventas [100], EverQuote [100], AXIS Capital[100], China Fund[100]
Best Financial Stocks Year-to-Date:
Root [442.98%], Hippo [99.34%], Gladstone Capital[98.5%], Banco Macro[95.51%], Grupo Financiero[84.71%], Banco BBVA[76.47%], EverQuote [75.9%], Yiren Digital[74.68%], LendingTree [62.7%], Grupo Supervielle[60.34%], B. Riley[59.98%] Best Financial Stocks This Week:
LendingTree [30.16%], Office Properties[27.36%], Huize Holding[22.7%], Heartland [21.11%], Industrial Logistics[17.36%], Douglas Elliman[16.81%], LendingClub [15.19%], KE [13.55%], New York[13.47%], Territorial Bancorp[12.02%], SelectQuote [11.8%] Best Financial Stocks Daily:
Office Properties[28.00%], Huize Holding[13.70%], KE [12.64%], SelectQuote [11.80%], eXp World[10.84%], Coinbase Global[10.36%], Regional Management[8.03%], Noah [7.83%], Cipher Mining[7.74%], 360 Finance[7.05%], ING Groep[7.03%]