
 Login Sign Up


| |||||
 |  | ||||

| 12Stocks.com Market Intelligence |
Best Financial Stocks
| In a hurry? Financial Stocks Lists: Performance Trends Table, Stock Charts
Sort Financial stocks: Daily, Weekly, Year-to-Date, Market Cap & Trends. Filter Financial stocks list by size:All Financial Large Mid-Range Small & MicroCap |
| 12Stocks.com Financial Stocks Performances & Trends Daily | |||||||||
|
|  The overall Smart Investing & Trading Score is 56 (0-bearish to 100-bullish) which puts Financial sector in short term neutral trend. The Smart Investing & Trading Score from previous trading session is 36 and hence an improvement of trend.
| ||||||||
Here are the Smart Investing & Trading Scores of the most requested Financial stocks at 12Stocks.com (click stock name for detailed review):
|


| 12Stocks.com: Investing in Financial sector with Stocks | |
|
The following table helps investors and traders sort through current performance and trends (as measured by Smart Investing & Trading Score) of various
stocks in the Financial sector. Quick View: Move mouse or cursor over stock symbol (ticker) to view short-term Technical chart and over stock name to view long term chart. Click on  to add stock symbol to your watchlist and to add stock symbol to your watchlist and  to view watchlist. Click on any ticker or stock name for detailed market intelligence report for that stock. to view watchlist. Click on any ticker or stock name for detailed market intelligence report for that stock. |
12Stocks.com Performance of Stocks in Financial Sector
| Ticker | Stock Name | Watchlist | Category | Recent Price | Trend Score | Change % | YTD Change% |
| WEA | Western Asset |   | Closed-End Fund - Debt | 10.59 | 50 | 0.57% | -1.94% |
| OCSL | Oaktree Specialty | | Credit Services | 19.48 | 50 | 0.26% | -4.60% |
| OPRT | Oportun | | Credit Services | 2.34 | 49 | 9.86% | -40.15% |
| HRZN | Horizon Technology | | Asset Mgmt | 11.37 | 49 | 1.52% | -13.67% |
| TBBK | Bancorp | | Regional Banks | 33.19 | 49 | 1.07% | -13.93% |
| CBFV | CB | | Regional Banks | 21.50 | 49 | 0.70% | -9.74% |
| PCK | PIMCO California | | Closed-End Fund - Debt | 5.67 | 49 | 0.25% | -2.24% |
| NXRT | NexPoint Residential | | REIT | 31.33 | 49 | 1.79% | -9.00% |
| NU | Nu | | Banks - | 10.91 | 49 | 1.11% | 30.82% |
| GLRE | Greenlight Capital | | Insurance | 12.25 | 49 | 0.74% | 7.27% |
| SOR | Source Capital | | Closed-End Fund - Equity | 41.30 | 49 | 0.58% | 2.29% |
| AESR | Anfield U.S. | | Exchange Traded Fund | 14.89 | 49 | 0.40% | 7.66% |
| TY | Tri-Continental | | Closed-End Fund - Equity | 29.32 | 49 | 0.27% | 1.70% |
| LAMR | Lamar Advertising | | REIT - | 110.72 | 49 | 0.07% | 4.18% |
| MSTB | LHA Market | | Exchange Traded Fund | 30.42 | 49 | 0.07% | 5.59% |
| SCD | LMP Capital | | Closed-End Fund - Equity | 14.43 | 49 | -2.50% | 3.00% |
| ETV | Eaton Vance | | Closed-End Fund - Equity | 12.66 | 49 | -0.16% | 2.68% |
| EOI | Eaton Vance | | Closed-End Fund - Equity | 17.89 | 49 | -0.06% | 7.90% |
| EMF | Templeton Emerging | | Closed-End Fund - Foreign | 11.32 | 48 | 0.89% | -3.08% |
| CM | Canadian Imperial | | Banks | 47.22 | 48 | 0.36% | -1.91% |
| NMR | Nomura | | Brokerage | 5.87 | 48 | 0.17% | 30.16% |
| SIXA | 6 Meridian | | Exchange Traded Fund | 39.70 | 48 | 0.13% | 8.12% |
| PLAO | Patria Latin | | SPAC | 11.33 | 48 | 0.00% | 2.16% |
| EDF | Stone Harbor | | Asset Mgmt | 5.01 | 48 | -0.20% | 16.24% |
| FMAY | FT Cboe | | Exchange Traded Fund | 42.99 | 48 | -0.19% | 4.07% |
| For chart view version of above stock list: Chart View ➞ 0 - 25 , 25 - 50 , 50 - 75 , 75 - 100 , 100 - 125 , 125 - 150 , 150 - 175 , 175 - 200 , 200 - 225 , 225 - 250 , 250 - 275 , 275 - 300 , 300 - 325 , 325 - 350 , 350 - 375 , 375 - 400 , 400 - 425 , 425 - 450 , 450 - 475 , 475 - 500 , 500 - 525 , 525 - 550 , 550 - 575 , 575 - 600 , 600 - 625 , 625 - 650 , 650 - 675 , 675 - 700 , 700 - 725 , 725 - 750 , 750 - 775 , 775 - 800 , 800 - 825 , 825 - 850 , 850 - 875 , 875 - 900 , 900 - 925 , 925 - 950 , 950 - 975 , 975 - 1000 , 1000 - 1025 , 1025 - 1050 , 1050 - 1075 , 1075 - 1100 , 1100 - 1125 , 1125 - 1150 , 1150 - 1175 , 1175 - 1200 , 1200 - 1225 , 1225 - 1250 | ||
 | Click To Change The Sort Order: By Market Cap or Company Size Performance: Year-to-date, Week and Day |  |
|
Get the most comprehensive stock market coverage daily at 12Stocks.com ➞ Best Stocks Today ➞ Best Stocks Weekly ➞ Best Stocks Year-to-Date ➞ Best Stocks Trends ➞  Best Stocks Today 12Stocks.com Best Nasdaq Stocks ➞ Best S&P 500 Stocks ➞ Best Tech Stocks ➞ Best Biotech Stocks ➞ |
| Detailed Overview of Financial Stocks |
| Financial Technical Overview, Leaders & Laggards, Top Financial ETF Funds & Detailed Financial Stocks List, Charts, Trends & More |
| Financial Sector: Technical Analysis, Trends & YTD Performance | |
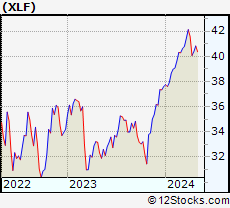
| Financial sector is composed of stocks
from banks, brokers, insurance, REITs
and services subsectors. Financial sector, as represented by XLF, an exchange-traded fund [ETF] that holds basket of Financial stocks (e.g, Bank of America, Goldman Sachs) is up by 5.93% and is currently outperforming the overall market by 1.74% year-to-date. Below is a quick view of Technical charts and trends: |
|
 XLF Weekly Chart |
|
| Long Term Trend: Good | |
| Medium Term Trend: Not Good | |
 XLF Daily Chart |
|
| Short Term Trend: Deteriorating | |
| Overall Trend Score: 56 | |
| YTD Performance: 5.93% | |
| **Trend Scores & Views Are Only For Educational Purposes And Not For Investing | |
| 12Stocks.com: Top Performing Financial Sector Stocks | ||||||||||||||||||||||||||||||||||||||||||||||||
 The top performing Financial sector stocks year to date are
Now, more recently, over last week, the top performing Financial sector stocks on the move are


|
||||||||||||||||||||||||||||||||||||||||||||||||
| 12Stocks.com: Investing in Financial Sector using Exchange Traded Funds | |
|
The following table shows list of key exchange traded funds (ETF) that
help investors track Financial Index. For detailed view, check out our ETF Funds section of our website. Quick View: Move mouse or cursor over ETF symbol (ticker) to view short-term Technical chart and over ETF name to view long term chart. Click on ticker or stock name for detailed view. Click on to add stock symbol to your watchlist and to view watchlist. |
12Stocks.com List of ETFs that track Financial Index
| Ticker | ETF Name | Watchlist | Recent Price | Smart Investing & Trading Score | Change % | Week % | Year-to-date % |
| XLF | Financial | | 39.83 | 56 | 0.35 | -0.57 | 5.93% |
| IAI | Broker-Dealers & Secs | | 110.51 | 56 | 0.14 | -0.29 | 1.82% |
| IYF | Financials | | 90.04 | 56 | 0.61 | -0.56 | 5.42% |
| IYG | Financial Services | | 62.67 | 56 | 0.30 | -0.85 | 4.91% |
| KRE | Regional Banking | | 46.11 | 28 | 0.61 | -0.88 | -12.05% |
| IXG | Global Financials | | 82.33 | 48 | 0.45 | -0.4 | 4.77% |
| VFH | Financials | | 96.40 | 56 | 0.39 | -0.8 | 4.49% |
| KBE | Bank | | 43.40 | 30 | 0.70 | -0.89 | -5.69% |
| FAS | Financial Bull 3X | | 94.14 | 56 | 1.00 | -2.16 | 13.9% |
| FAZ | Financial Bear 3X | | 11.66 | 40 | -0.85 | 2.19 | -14.7% |
| UYG | Financials | | 60.75 | 56 | 0.70 | -1.17 | 10.05% |
| IAT | Regional Banks | | 39.74 | 27 | 0.28 | -1.73 | -5.02% |
| KIE | Insurance | | 48.28 | 51 | 1.17 | -0.08 | 6.77% |
| PSCF | SmallCap Financials | | 44.76 | 15 | -0.22 | -1.43 | -8.99% |
| EUFN | Europe Financials | | 21.87 | 56 | 0.28 | -0.09 | 4.34% |
| PGF | Financial Preferred | | 14.45 | 10 | -0.28 | -1.57 | -0.89% |
| 12Stocks.com: Charts, Trends, Fundamental Data and Performances of Financial Stocks | |
|
We now take in-depth look at all Financial stocks including charts, multi-period performances and overall trends (as measured by Smart Investing & Trading Score). One can sort Financial stocks (click link to choose) by Daily, Weekly and by Year-to-Date performances. Also, one can sort by size of the company or by market capitalization. |
| Select Your Default Chart Type: | |||||
| |||||
| Click on stock symbol or name for detailed view. Click on to add stock symbol to your watchlist and to view watchlist. Quick View: Move mouse or cursor over "Daily" to quickly view daily Technical stock chart and over "Weekly" to view weekly Technical stock chart. | |||||

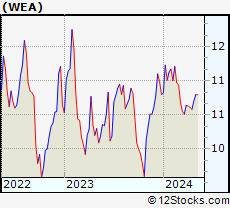 | WEA Western Asset Premier Bond Fund |
| Sector: Financials | |
| SubSector: Closed-End Fund - Debt | |
| MarketCap: 113.207 Millions | |
| Recent Price: 10.59 Smart Investing & Trading Score: 50 | |
| Day Percent Change: 0.57% Day Change: 0.06 | |
| Week Change: -0.19% Year-to-date Change: -1.9% | |
| WEA Links: Profile News Message Board | |
| Charts:- Daily , Weekly | |
| Add WEA to Watchlist: View: Get Complete WEA Trend Analysis ➞ | |
 | OCSL Oaktree Specialty Lending Corporation |
| Sector: Financials | |
| SubSector: Credit Services | |
| MarketCap: 353.808 Millions | |
| Recent Price: 19.48 Smart Investing & Trading Score: 50 | |
| Day Percent Change: 0.26% Day Change: 0.05 | |
| Week Change: 1.09% Year-to-date Change: -4.6% | |
| OCSL Links: Profile News Message Board | |
| Charts:- Daily , Weekly | |
| Add OCSL to Watchlist: View: Get Complete OCSL Trend Analysis ➞ | |
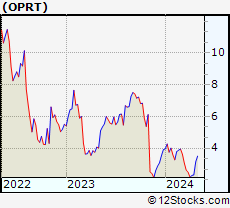 | OPRT Oportun Financial Corporation |
| Sector: Financials | |
| SubSector: Credit Services | |
| MarketCap: 360.208 Millions | |
| Recent Price: 2.34 Smart Investing & Trading Score: 49 | |
| Day Percent Change: 9.86% Day Change: 0.21 | |
| Week Change: 2.18% Year-to-date Change: -40.2% | |
| OPRT Links: Profile News Message Board | |
| Charts:- Daily , Weekly | |
| Add OPRT to Watchlist: View: Get Complete OPRT Trend Analysis ➞ | |
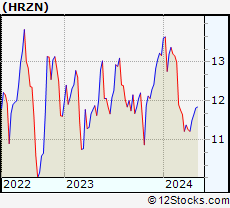 | HRZN Horizon Technology Finance Corporation |
| Sector: Financials | |
| SubSector: Asset Management | |
| MarketCap: 109.203 Millions | |
| Recent Price: 11.37 Smart Investing & Trading Score: 49 | |
| Day Percent Change: 1.52% Day Change: 0.17 | |
| Week Change: 1.43% Year-to-date Change: -13.7% | |
| HRZN Links: Profile News Message Board | |
| Charts:- Daily , Weekly | |
| Add HRZN to Watchlist: View: Get Complete HRZN Trend Analysis ➞ | |
 | TBBK The Bancorp, Inc. |
| Sector: Financials | |
| SubSector: Regional - Mid-Atlantic Banks | |
| MarketCap: 267.859 Millions | |
| Recent Price: 33.19 Smart Investing & Trading Score: 49 | |
| Day Percent Change: 1.07% Day Change: 0.35 | |
| Week Change: 5.43% Year-to-date Change: -13.9% | |
| TBBK Links: Profile News Message Board | |
| Charts:- Daily , Weekly | |
| Add TBBK to Watchlist: View: Get Complete TBBK Trend Analysis ➞ | |
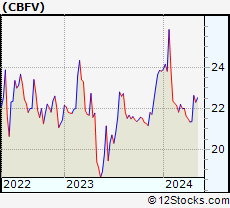 | CBFV CB Financial Services, Inc. |
| Sector: Financials | |
| SubSector: Regional - Northeast Banks | |
| MarketCap: 108.199 Millions | |
| Recent Price: 21.50 Smart Investing & Trading Score: 49 | |
| Day Percent Change: 0.70% Day Change: 0.15 | |
| Week Change: 0.75% Year-to-date Change: -9.7% | |
| CBFV Links: Profile News Message Board | |
| Charts:- Daily , Weekly | |
| Add CBFV to Watchlist: View: Get Complete CBFV Trend Analysis ➞ | |
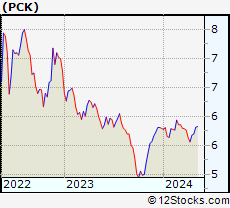 | PCK PIMCO California Municipal Income Fund II |
| Sector: Financials | |
| SubSector: Closed-End Fund - Debt | |
| MarketCap: 231.307 Millions | |
| Recent Price: 5.67 Smart Investing & Trading Score: 49 | |
| Day Percent Change: 0.25% Day Change: 0.01 | |
| Week Change: 1.91% Year-to-date Change: -2.2% | |
| PCK Links: Profile News Message Board | |
| Charts:- Daily , Weekly | |
| Add PCK to Watchlist: View: Get Complete PCK Trend Analysis ➞ | |
 | NXRT NexPoint Residential Trust, Inc. |
| Sector: Financials | |
| SubSector: REIT - Residential | |
| MarketCap: 839.161 Millions | |
| Recent Price: 31.33 Smart Investing & Trading Score: 49 | |
| Day Percent Change: 1.79% Day Change: 0.55 | |
| Week Change: -1.76% Year-to-date Change: -9.0% | |
| NXRT Links: Profile News Message Board | |
| Charts:- Daily , Weekly | |
| Add NXRT to Watchlist: View: Get Complete NXRT Trend Analysis ➞ | |
 | NU Nu Holdings Ltd. |
| Sector: Financials | |
| SubSector: Banks - Diversified | |
| MarketCap: 37240 Millions | |
| Recent Price: 10.91 Smart Investing & Trading Score: 49 | |
| Day Percent Change: 1.11% Day Change: 0.12 | |
| Week Change: -3.37% Year-to-date Change: 30.8% | |
| NU Links: Profile News Message Board | |
| Charts:- Daily , Weekly | |
| Add NU to Watchlist: View: Get Complete NU Trend Analysis ➞ | |
 | GLRE Greenlight Capital Re, Ltd. |
| Sector: Financials | |
| SubSector: Accident & Health Insurance | |
| MarketCap: 228.66 Millions | |
| Recent Price: 12.25 Smart Investing & Trading Score: 49 | |
| Day Percent Change: 0.74% Day Change: 0.09 | |
| Week Change: 1.16% Year-to-date Change: 7.3% | |
| GLRE Links: Profile News Message Board | |
| Charts:- Daily , Weekly | |
| Add GLRE to Watchlist: View: Get Complete GLRE Trend Analysis ➞ | |
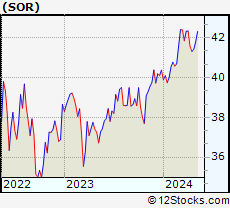 | SOR Source Capital, Inc. |
| Sector: Financials | |
| SubSector: Closed-End Fund - Equity | |
| MarketCap: 229.147 Millions | |
| Recent Price: 41.30 Smart Investing & Trading Score: 49 | |
| Day Percent Change: 0.58% Day Change: 0.24 | |
| Week Change: -0.66% Year-to-date Change: 2.3% | |
| SOR Links: Profile News Message Board | |
| Charts:- Daily , Weekly | |
| Add SOR to Watchlist: View: Get Complete SOR Trend Analysis ➞ | |
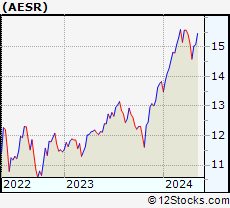 | AESR Anfield U.S. Equity Sector Rotation ETF |
| Sector: Financials | |
| SubSector: Exchange Traded Fund | |
| MarketCap: 60157 Millions | |
| Recent Price: 14.89 Smart Investing & Trading Score: 49 | |
| Day Percent Change: 0.40% Day Change: 0.06 | |
| Week Change: -1.52% Year-to-date Change: 7.7% | |
| AESR Links: Profile News Message Board | |
| Charts:- Daily , Weekly | |
| Add AESR to Watchlist: View: Get Complete AESR Trend Analysis ➞ | |
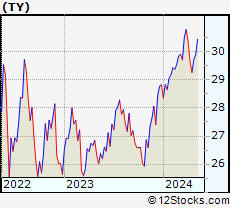 | TY Tri-Continental Corporation |
| Sector: Financials | |
| SubSector: Closed-End Fund - Equity | |
| MarketCap: 998.647 Millions | |
| Recent Price: 29.32 Smart Investing & Trading Score: 49 | |
| Day Percent Change: 0.27% Day Change: 0.08 | |
| Week Change: -1.21% Year-to-date Change: 1.7% | |
| TY Links: Profile News Message Board | |
| Charts:- Daily , Weekly | |
| Add TY to Watchlist: View: Get Complete TY Trend Analysis ➞ | |
 | LAMR Lamar Advertising Company (REIT) |
| Sector: Financials | |
| SubSector: REIT - Diversified | |
| MarketCap: 4838.33 Millions | |
| Recent Price: 110.72 Smart Investing & Trading Score: 49 | |
| Day Percent Change: 0.07% Day Change: 0.08 | |
| Week Change: -0.85% Year-to-date Change: 4.2% | |
| LAMR Links: Profile News Message Board | |
| Charts:- Daily , Weekly | |
| Add LAMR to Watchlist: View: Get Complete LAMR Trend Analysis ➞ | |
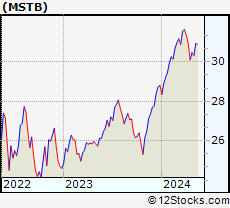 | MSTB LHA Market State Tactical Beta ETF |
| Sector: Financials | |
| SubSector: Exchange Traded Fund | |
| MarketCap: 60157 Millions | |
| Recent Price: 30.42 Smart Investing & Trading Score: 49 | |
| Day Percent Change: 0.07% Day Change: 0.02 | |
| Week Change: -1.63% Year-to-date Change: 5.6% | |
| MSTB Links: Profile News Message Board | |
| Charts:- Daily , Weekly | |
| Add MSTB to Watchlist: View: Get Complete MSTB Trend Analysis ➞ | |
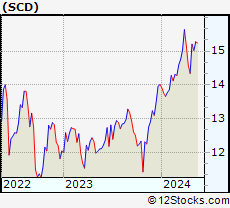 | SCD LMP Capital and Income Fund Inc. |
| Sector: Financials | |
| SubSector: Closed-End Fund - Equity | |
| MarketCap: 124.747 Millions | |
| Recent Price: 14.43 Smart Investing & Trading Score: 49 | |
| Day Percent Change: -2.50% Day Change: -0.37 | |
| Week Change: -1.1% Year-to-date Change: 3.0% | |
| SCD Links: Profile News Message Board | |
| Charts:- Daily , Weekly | |
| Add SCD to Watchlist: View: Get Complete SCD Trend Analysis ➞ | |
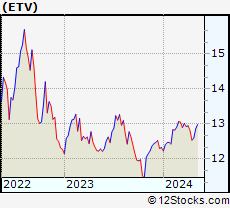 | ETV Eaton Vance Tax-Managed Buy-Write Opportunities Fund |
| Sector: Financials | |
| SubSector: Closed-End Fund - Equity | |
| MarketCap: 881.147 Millions | |
| Recent Price: 12.66 Smart Investing & Trading Score: 49 | |
| Day Percent Change: -0.16% Day Change: -0.02 | |
| Week Change: -1.25% Year-to-date Change: 2.7% | |
| ETV Links: Profile News Message Board | |
| Charts:- Daily , Weekly | |
| Add ETV to Watchlist: View: Get Complete ETV Trend Analysis ➞ | |
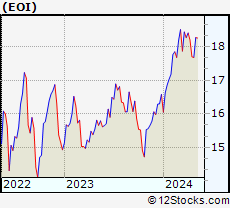 | EOI Eaton Vance Enhanced Equity Income Fund |
| Sector: Financials | |
| SubSector: Closed-End Fund - Equity | |
| MarketCap: 406.247 Millions | |
| Recent Price: 17.89 Smart Investing & Trading Score: 49 | |
| Day Percent Change: -0.06% Day Change: -0.01 | |
| Week Change: -1.7% Year-to-date Change: 7.9% | |
| EOI Links: Profile News Message Board | |
| Charts:- Daily , Weekly | |
| Add EOI to Watchlist: View: Get Complete EOI Trend Analysis ➞ | |
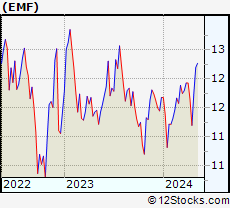 | EMF Templeton Emerging Markets Fund |
| Sector: Financials | |
| SubSector: Closed-End Fund - Foreign | |
| MarketCap: 171.047 Millions | |
| Recent Price: 11.32 Smart Investing & Trading Score: 48 | |
| Day Percent Change: 0.89% Day Change: 0.10 | |
| Week Change: -2.83% Year-to-date Change: -3.1% | |
| EMF Links: Profile News Message Board | |
| Charts:- Daily , Weekly | |
| Add EMF to Watchlist: View: Get Complete EMF Trend Analysis ➞ | |
 | CM Canadian Imperial Bank of Commerce |
| Sector: Financials | |
| SubSector: Money Center Banks | |
| MarketCap: 27150.5 Millions | |
| Recent Price: 47.22 Smart Investing & Trading Score: 48 | |
| Day Percent Change: 0.36% Day Change: 0.17 | |
| Week Change: -1.69% Year-to-date Change: -1.9% | |
| CM Links: Profile News Message Board | |
| Charts:- Daily , Weekly | |
| Add CM to Watchlist: View: Get Complete CM Trend Analysis ➞ | |
 | NMR Nomura Holdings, Inc. |
| Sector: Financials | |
| SubSector: Investment Brokerage - National | |
| MarketCap: 15277 Millions | |
| Recent Price: 5.87 Smart Investing & Trading Score: 48 | |
| Day Percent Change: 0.17% Day Change: 0.01 | |
| Week Change: -3.93% Year-to-date Change: 30.2% | |
| NMR Links: Profile News Message Board | |
| Charts:- Daily , Weekly | |
| Add NMR to Watchlist: View: Get Complete NMR Trend Analysis ➞ | |
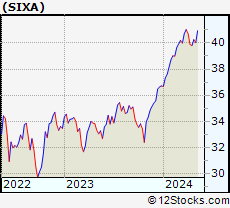 | SIXA 6 Meridian Mega Cap Equity ETF |
| Sector: Financials | |
| SubSector: Exchange Traded Fund | |
| MarketCap: 60157 Millions | |
| Recent Price: 39.70 Smart Investing & Trading Score: 48 | |
| Day Percent Change: 0.13% Day Change: 0.05 | |
| Week Change: -0.5% Year-to-date Change: 8.1% | |
| SIXA Links: Profile News Message Board | |
| Charts:- Daily , Weekly | |
| Add SIXA to Watchlist: View: Get Complete SIXA Trend Analysis ➞ | |
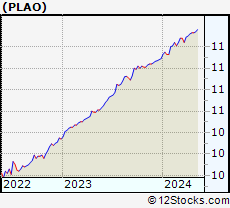 | PLAO Patria Latin American Opportunity Acquisition Corp. |
| Sector: Financials | |
| SubSector: SPAC | |
| MarketCap: 304 Millions | |
| Recent Price: 11.33 Smart Investing & Trading Score: 48 | |
| Day Percent Change: 0.00% Day Change: 0.00 | |
| Week Change: 0.09% Year-to-date Change: 2.2% | |
| PLAO Links: Profile News Message Board | |
| Charts:- Daily , Weekly | |
| Add PLAO to Watchlist: View: Get Complete PLAO Trend Analysis ➞ | |
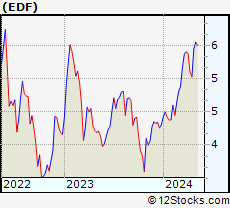 | EDF Stone Harbor Emerging Markets Income Fund |
| Sector: Financials | |
| SubSector: Asset Management | |
| MarketCap: 108.203 Millions | |
| Recent Price: 5.01 Smart Investing & Trading Score: 48 | |
| Day Percent Change: -0.20% Day Change: -0.01 | |
| Week Change: -1.76% Year-to-date Change: 16.2% | |
| EDF Links: Profile News Message Board | |
| Charts:- Daily , Weekly | |
| Add EDF to Watchlist: View: Get Complete EDF Trend Analysis ➞ | |
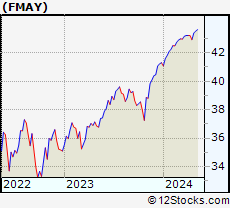 | FMAY FT Cboe Vest US Eq Buffer ETF May |
| Sector: Financials | |
| SubSector: Exchange Traded Fund | |
| MarketCap: 60157 Millions | |
| Recent Price: 42.99 Smart Investing & Trading Score: 48 | |
| Day Percent Change: -0.19% Day Change: -0.08 | |
| Week Change: -0.53% Year-to-date Change: 4.1% | |
| FMAY Links: Profile News Message Board | |
| Charts:- Daily , Weekly | |
| Add FMAY to Watchlist: View: Get Complete FMAY Trend Analysis ➞ | |
| For tabular summary view of above stock list: Summary View ➞ 0 - 25 , 25 - 50 , 50 - 75 , 75 - 100 , 100 - 125 , 125 - 150 , 150 - 175 , 175 - 200 , 200 - 225 , 225 - 250 , 250 - 275 , 275 - 300 , 300 - 325 , 325 - 350 , 350 - 375 , 375 - 400 , 400 - 425 , 425 - 450 , 450 - 475 , 475 - 500 , 500 - 525 , 525 - 550 , 550 - 575 , 575 - 600 , 600 - 625 , 625 - 650 , 650 - 675 , 675 - 700 , 700 - 725 , 725 - 750 , 750 - 775 , 775 - 800 , 800 - 825 , 825 - 850 , 850 - 875 , 875 - 900 , 900 - 925 , 925 - 950 , 950 - 975 , 975 - 1000 , 1000 - 1025 , 1025 - 1050 , 1050 - 1075 , 1075 - 1100 , 1100 - 1125 , 1125 - 1150 , 1150 - 1175 , 1175 - 1200 , 1200 - 1225 , 1225 - 1250 | ||
| Click To Change The Sort Order: By Market Cap or Company Size Performance: Year-to-date, Week and Day | |
| Select Chart Type: | ||
|
Best Stocks Today 12Stocks.com |
© 2024 12Stocks.com Terms & Conditions Privacy Contact Us
All Information Provided Only For Education And Not To Be Used For Investing or Trading. See Terms & Conditions


One More Thing ... Get Best Stocks Delivered Daily!
Never Ever Miss A Move With Our Top Ten Stocks Lists
Find Best Stocks In Any Market - Bull or Bear Market
Take A Peek At Our Top Ten Stocks Lists: Daily, Weekly, Year-to-Date & Top Trends
Find Best Stocks In Any Market - Bull or Bear Market
Take A Peek At Our Top Ten Stocks Lists: Daily, Weekly, Year-to-Date & Top Trends
Financial Stocks With Best Up Trends [0-bearish to 100-bullish]: Medical Properties[100], Victory Capital[100], TCG BDC[100], Macatawa Bank[100], Stellus Capital[100], Goldman Sachs[100], Angel Oak[95], HDFC Bank[93], Charles Schwab[93], Fidus [93], Western Asset[93]
Best Financial Stocks Year-to-Date:
Root [389.97%], Hippo [128.32%], Gladstone Capital[93.22%], Banco Macro[68.33%], Grupo Financiero[62.35%], Yiren Digital[55.45%], Fidelis Insurance[53.3%], First [50.82%], Banco BBVA[48.35%], EverQuote [48.04%], Heritage Insurance[45.55%] Best Financial Stocks This Week:
Macatawa Bank[44.42%], Medical Properties[25.06%], Globe Life[10%], James River[8.87%], GoHealth [7.45%], Victory Capital[6.87%], Bancorp [5.43%], Huize Holding[5.3%], Green Dot[5.25%], LCNB [5.2%], ESSA Bancorp[4.94%] Best Financial Stocks Daily:
Oportun [9.86%], Cipher Mining[8.65%], Ally [6.73%], eHealth [6.22%], Coinbase Global[5.90%], C&F [5.65%], James River[5.62%], Tejon Ranch[5.44%], Bank OZK[4.73%], Medical Properties[4.61%], Claros Mortgage[4.52%]