
 Login Sign Up


| |||||
 |  | ||||

| 12Stocks.com Market Intelligence |
Best Emerging Markets Stocks
| In a hurry? Emerging Markets Stocks Lists: Trends Table, Stock Charts
Sort Emerging Markets stocks: Daily, Weekly, Year-to-Date, Market Cap & Trends. Filter Emerging Markets stocks list by sector: Show all, Tech, Finance, Energy, Staples, Retail, Industrial, Materials, Utilities and HealthCare Filter Emerging Markets stocks list by size:All Large Medium Small |
| 12Stocks.com Emerging Markets Stocks Performances & Trends Daily | |||||||||
|
|  The overall Smart Investing & Trading Score is 61 (0-bearish to 100-bullish) which puts Emerging Markets index in short term neutral to bullish trend. The Smart Investing & Trading Score from previous trading session is 68 and hence a deterioration of trend.
| ||||||||
Here are the Smart Investing & Trading Scores of the most requested Emerging Markets stocks at 12Stocks.com (click stock name for detailed review):
|


| 12Stocks.com: Top Performing Emerging Markets Index Stocks | ||||||||||||||||||||||||||||||||||||||||||||||||
 The top performing Emerging Markets Index stocks year to date are
Now, more recently, over last week, the top performing Emerging Markets Index stocks on the move are


|
||||||||||||||||||||||||||||||||||||||||||||||||
| 12Stocks.com: Investing in Emerging Markets Index with Stocks | |
|
The following table helps investors and traders sort through current performance and trends (as measured by Smart Investing & Trading Score ) of various
stocks in the Emerging Markets Index. Quick View: Move mouse or cursor over stock symbol (ticker) to view short-term technical chart and over stock name to view long term chart. Click on  to add stock symbol to your watchlist and to add stock symbol to your watchlist and  to view watchlist. Click on any ticker or stock name for detailed market intelligence report for that stock. to view watchlist. Click on any ticker or stock name for detailed market intelligence report for that stock. |
12Stocks.com Performance of Stocks in Emerging Markets Index
| Ticker | Stock Name | Watchlist | Category | Recent Price | Smart Investing & Trading Score | Change % | YTD Change% |
| TOP | TOP Financial |   | Financials | 2.68 | 52 | 3.08% | -27.96% |
| JKS | JinkoSolar Holding | | Technology | 23.09 | 52 | -0.35% | -37.49% |
| ASX | ASE | | Technology | 10.15 | 51 | -2.12% | 7.86% |
| CHT | Chunghwa Telecom | | Technology | 37.87 | 51 | -0.97% | -3.07% |
| HMY | Harmony Gold | | Materials | 9.03 | 51 | 3.32% | 46.83% |
| HUIZ | Huize Holding | | Financials | 0.52 | 50 | -18.75% | -42.22% |
| VIOT | Viomi | | Technology | 0.60 | 50 | 7.13% | -39.90% |
| BGNE | BeiGene | | Health Care | 148.56 | 49 | 3.08% | -17.63% |
| DDL | Dingdong (Cayman) | | Consumer Staples | 1.23 | 49 | 2.07% | -19.08% |
| XIN | Xinyuan Real | | Financials | 2.72 | 49 | -0.37% | 0.00% |
| CANG | Cango | | Technology | 1.44 | 49 | 4.35% | 41.18% |
| YJ | Yunji | | Services & Goods | 0.75 | 48 | -3.04% | 5.51% |
| YGMZ | MingZhu Logistics | | Industrials | 0.42 | 47 | 1.19% | -10.26% |
| CLEU | China Liberal | | Consumer Staples | 1.11 | 47 | -1.77% | 520.81% |
| BEDU | Bright Scholar | | Services & Goods | 1.95 | 46 | 2.63% | 56.00% |
| QFIN | 360 Finance | | Financials | 18.86 | 46 | 0.72% | 19.25% |
| MSC | Studio City | | Services & Goods | 7.00 | 46 | -3.18% | 8.02% |
| CIG | Companhia Energetica | | Utilities | 2.41 | 46 | -2.03% | 3.88% |
| UMC | United Microelectronics | | Technology | 7.76 | 45 | 0.78% | -8.27% |
| GGR | Gogoro | | Services & Goods | 1.50 | 45 | 0.67% | -42.31% |
| LXEH | Lixiang Education | | Consumer Staples | 0.40 | 45 | -4.77% | -63.58% |
| HSAI | Hesai | | Services & Goods | 4.17 | 45 | -3.92% | -54.07% |
| LVRO | Lavoro | | Materials | 5.98 | 45 | -1.48% | -32.66% |
| HOLO | MicroCloud Hologram | | Technology | 2.67 | 43 | 13.86% | 668.35% |
| SMI | Semiconductor | | Technology | 45.59 | 43 | -0.34% | -1.85% |
| For chart view version of above stock list: Chart View ➞ 0 - 25 , 25 - 50 , 50 - 75 , 75 - 100 , 100 - 125 , 125 - 150 , 150 - 175 , 175 - 200 | ||
 | Click To Change The Sort Order: By Market Cap or Company Size Performance: Year-to-date, Week and Day |  |
|
Get the most comprehensive stock market coverage daily at 12Stocks.com ➞ Best Stocks Today ➞ Best Stocks Weekly ➞ Best Stocks Year-to-Date ➞ Best Stocks Trends ➞  Best Stocks Today 12Stocks.com Best Nasdaq Stocks ➞ Best S&P 500 Stocks ➞ Best Tech Stocks ➞ Best Biotech Stocks ➞ |
| Detailed Overview of Emerging Markets Stocks |
| Emerging Markets Technical Overview, Leaders & Laggards, Top Emerging Markets ETF Funds & Detailed Emerging Markets Stocks List, Charts, Trends & More |
| Emerging Markets: Technical Analysis, Trends & YTD Performance | |
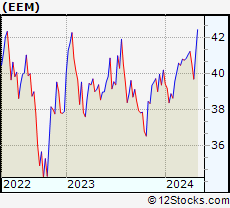
 EEM Weekly Chart |
|
| Long Term Trend: Very Good | |
| Medium Term Trend: Not Good | |
 EEM Daily Chart |
|
| Short Term Trend: Very Good | |
| Overall Trend Score: 61 | |
| YTD Performance: 1.22% | |
| **Trend Scores & Views Are Only For Educational Purposes And Not For Investing | |
| 12Stocks.com: Investing in Emerging Markets Index using Exchange Traded Funds | |
|
The following table shows list of key exchange traded funds (ETF) that
help investors play Emerging Markets stock market. For detailed view, check out our ETF Funds section of our website. Quick View: Move mouse or cursor over ETF symbol (ticker) to view short-term technical chart and over ETF name to view long term chart. Click on ticker or stock name for detailed view. Click on to add stock symbol to your watchlist and to view watchlist. |
12Stocks.com List of ETFs that track Emerging Markets Index
| Ticker | ETF Name | Watchlist | Recent Price | Smart Investing & Trading Score | Change % | Week % | Year-to-date % |
| EEM | Emerging Markets | | 40.70 | 61 | 0.22 | 2.49 | 1.22% |
| VWO | Emerging Markets | | 41.84 | 68 | 0.31 | 2.32 | 1.8% |
| SCHE | Emerging Markets Equity | | 25.28 | 73 | 0.32 | 2.39 | 1.98% |
| EWX | Emerging Markets Small | | 56.03 | 50 | 0.41 | 1.56 | -0.76% |
| EET | Emerging Markets | | 49.93 | 68 | 0.06 | 4.64 | -1.83% |
| EDC | Emrg Mkts Bull | | 29.05 | 56 | 0.48 | 7.31 | -4.53% |
| EEV | Short Emerging | | 19.53 | 32 | -0.81 | -4.81 | -0.98% |
| EUM | Short Emerging | | 14.15 | 39 | -0.07 | -2.36 | 0% |
| EDIV | Emerging Markets Dividend | | 33.41 | 50 | 0.78 | 1.21 | 2.74% |
| EMIF | Emerging Markets Infrastructure | | 21.87 | 60 | 0.00 | 2.29 | 2.2% |
| CEW | Emerging Currency Strat | | 17.66 | 48 | 0.00 | 0.31 | -1.92% |
| EBND | Em Mkts Lcl | | 19.88 | 20 | -0.20 | -0.25 | -6.4% |
| EMCB | Emerging Markets Corp | | 63.74 | 15 | 0.57 | 0.24 | -0.25% |
| VWOB | Emerging Mkts Govt | | 62.16 | 25 | -0.30 | -0.27 | -2.49% |
| EEMA | Emerging Markets Asia | | 68.17 | 68 | 0.50 | 3.15 | 3.12% |
| EELV | Em Mkts Low | | 23.31 | 31 | 0.09 | 0.65 | -3.04% |
| DVYE | Emerging Markets Dividend | | 26.60 | 81 | 0.26 | 0.45 | 0.42% |
| SDEM | SuperDividend Em Mkts | | 25.26 | 26 | -0.08 | -2.32 | 1.87% |
| DBEM | Em Mkts Hdgd | | 23.76 | 53 | 0.22 | 2.86 | 2.99% |
| PCY | Emerging Markets Sov | | 19.65 | 25 | -0.25 | -0.81 | -4.7% |
| QEMM | Emerging Mkts StratcFacts | | 57.00 | 48 | 0.43 | 1.5 | -0.27% |
| 12Stocks.com: Charts, Trends, Fundamental Data and Performances of Emerging Markets Stocks | |
|
We now take in-depth look at all Emerging Markets stocks including charts, multi-period performances and overall trends (as measured by Smart Investing & Trading Score ). One can sort Emerging Markets stocks (click link to choose) by Daily, Weekly and by Year-to-Date performances. Also, one can sort by size of the company or by market capitalization. |
| Select Your Default Chart Type: | |||||
| |||||
| Click on stock symbol or name for detailed view. Click on to add stock symbol to your watchlist and to view watchlist. Quick View: Move mouse or cursor over "Daily" to quickly view daily technical stock chart and over "Weekly" to view weekly technical stock chart. | |||||

 | TOP TOP Financial Group Limited |
| Sector: Financials | |
| SubSector: Capital Markets | |
| MarketCap: 329 Millions | |
| Recent Price: 2.68 Smart Investing & Trading Score : 52 | |
| Day Percent Change: 3.08% Day Change: 0.08 | |
| Week Change: 14.04% Year-to-date Change: -28.0% | |
| TOP Links: Profile News Message Board | |
| Charts:- Daily , Weekly | |
| Add TOP to Watchlist: View: Get Complete TOP Trend Analysis ➞ | |
 | JKS JinkoSolar Holding Co., Ltd. |
| Sector: Technology | |
| SubSector: Semiconductor - Specialized | |
| MarketCap: 629.36 Millions | |
| Recent Price: 23.09 Smart Investing & Trading Score : 52 | |
| Day Percent Change: -0.35% Day Change: -0.08 | |
| Week Change: 7.1% Year-to-date Change: -37.5% | |
| JKS Links: Profile News Message Board | |
| Charts:- Daily , Weekly | |
| Add JKS to Watchlist: View: Get Complete JKS Trend Analysis ➞ | |
 | ASX ASE Technology Holding Co., Ltd. |
| Sector: Technology | |
| SubSector: Semiconductor Equipment & Materials | |
| MarketCap: 8513.18 Millions | |
| Recent Price: 10.15 Smart Investing & Trading Score : 51 | |
| Day Percent Change: -2.12% Day Change: -0.22 | |
| Week Change: 1% Year-to-date Change: 7.9% | |
| ASX Links: Profile News Message Board | |
| Charts:- Daily , Weekly | |
| Add ASX to Watchlist: View: Get Complete ASX Trend Analysis ➞ | |
 | CHT Chunghwa Telecom Co., Ltd. |
| Sector: Technology | |
| SubSector: Telecom Services - Domestic | |
| MarketCap: 28101.3 Millions | |
| Recent Price: 37.87 Smart Investing & Trading Score : 51 | |
| Day Percent Change: -0.97% Day Change: -0.37 | |
| Week Change: 0.05% Year-to-date Change: -3.1% | |
| CHT Links: Profile News Message Board | |
| Charts:- Daily , Weekly | |
| Add CHT to Watchlist: View: Get Complete CHT Trend Analysis ➞ | |
 | HMY Harmony Gold Mining Company Limited |
| Sector: Materials | |
| SubSector: Gold | |
| MarketCap: 1371.69 Millions | |
| Recent Price: 9.03 Smart Investing & Trading Score : 51 | |
| Day Percent Change: 3.32% Day Change: 0.29 | |
| Week Change: -2.8% Year-to-date Change: 46.8% | |
| HMY Links: Profile News Message Board | |
| Charts:- Daily , Weekly | |
| Add HMY to Watchlist: View: Get Complete HMY Trend Analysis ➞ | |
 | HUIZ Huize Holding Limited |
| Sector: Financials | |
| SubSector: Insurance Brokers | |
| MarketCap: 37157 Millions | |
| Recent Price: 0.52 Smart Investing & Trading Score : 50 | |
| Day Percent Change: -18.75% Day Change: -0.12 | |
| Week Change: -15.72% Year-to-date Change: -42.2% | |
| HUIZ Links: Profile News Message Board | |
| Charts:- Daily , Weekly | |
| Add HUIZ to Watchlist: View: Get Complete HUIZ Trend Analysis ➞ | |
 | VIOT Viomi Technology Co., Ltd |
| Sector: Technology | |
| SubSector: Electronic Equipment | |
| MarketCap: 357.2 Millions | |
| Recent Price: 0.60 Smart Investing & Trading Score : 50 | |
| Day Percent Change: 7.13% Day Change: 0.04 | |
| Week Change: 10.17% Year-to-date Change: -39.9% | |
| VIOT Links: Profile News Message Board | |
| Charts:- Daily , Weekly | |
| Add VIOT to Watchlist: View: Get Complete VIOT Trend Analysis ➞ | |
 | BGNE BeiGene, Ltd. |
| Sector: Health Care | |
| SubSector: Biotechnology | |
| MarketCap: 10838.5 Millions | |
| Recent Price: 148.56 Smart Investing & Trading Score : 49 | |
| Day Percent Change: 3.08% Day Change: 4.44 | |
| Week Change: 14.7% Year-to-date Change: -17.6% | |
| BGNE Links: Profile News Message Board | |
| Charts:- Daily , Weekly | |
| Add BGNE to Watchlist: View: Get Complete BGNE Trend Analysis ➞ | |
 | DDL Dingdong (Cayman) Limited |
| Sector: Consumer Staples | |
| SubSector: Grocery Stores | |
| MarketCap: 708 Millions | |
| Recent Price: 1.23 Smart Investing & Trading Score : 49 | |
| Day Percent Change: 2.07% Day Change: 0.02 | |
| Week Change: 6.96% Year-to-date Change: -19.1% | |
| DDL Links: Profile News Message Board | |
| Charts:- Daily , Weekly | |
| Add DDL to Watchlist: View: Get Complete DDL Trend Analysis ➞ | |
 | XIN Xinyuan Real Estate Co., Ltd. |
| Sector: Financials | |
| SubSector: Real Estate Development | |
| MarketCap: 136.119 Millions | |
| Recent Price: 2.72 Smart Investing & Trading Score : 49 | |
| Day Percent Change: -0.37% Day Change: -0.01 | |
| Week Change: 4.62% Year-to-date Change: 0.0% | |
| XIN Links: Profile News Message Board | |
| Charts:- Daily , Weekly | |
| Add XIN to Watchlist: View: Get Complete XIN Trend Analysis ➞ | |
 | CANG Cango Inc. |
| Sector: Technology | |
| SubSector: Internet Information Providers | |
| MarketCap: 947.48 Millions | |
| Recent Price: 1.44 Smart Investing & Trading Score : 49 | |
| Day Percent Change: 4.35% Day Change: 0.06 | |
| Week Change: 2.86% Year-to-date Change: 41.2% | |
| CANG Links: Profile News Message Board | |
| Charts:- Daily , Weekly | |
| Add CANG to Watchlist: View: Get Complete CANG Trend Analysis ➞ | |
 | YJ Yunji Inc. |
| Sector: Services & Goods | |
| SubSector: Specialty Retail, Other | |
| MarketCap: 770.644 Millions | |
| Recent Price: 0.75 Smart Investing & Trading Score : 48 | |
| Day Percent Change: -3.04% Day Change: -0.02 | |
| Week Change: 0.62% Year-to-date Change: 5.5% | |
| YJ Links: Profile News Message Board | |
| Charts:- Daily , Weekly | |
| Add YJ to Watchlist: View: Get Complete YJ Trend Analysis ➞ | |
 | YGMZ MingZhu Logistics Holdings Limited |
| Sector: Industrials | |
| SubSector: Trucking | |
| MarketCap: 41627 Millions | |
| Recent Price: 0.42 Smart Investing & Trading Score : 47 | |
| Day Percent Change: 1.19% Day Change: 0.01 | |
| Week Change: -9.77% Year-to-date Change: -10.3% | |
| YGMZ Links: Profile News Message Board | |
| Charts:- Daily , Weekly | |
| Add YGMZ to Watchlist: View: Get Complete YGMZ Trend Analysis ➞ | |
 | CLEU China Liberal Education Holdings Limited |
| Sector: Consumer Staples | |
| SubSector: Education & Training Services | |
| MarketCap: 32347 Millions | |
| Recent Price: 1.11 Smart Investing & Trading Score : 47 | |
| Day Percent Change: -1.77% Day Change: -0.02 | |
| Week Change: 7.68% Year-to-date Change: 520.8% | |
| CLEU Links: Profile News Message Board | |
| Charts:- Daily , Weekly | |
| Add CLEU to Watchlist: View: Get Complete CLEU Trend Analysis ➞ | |
 | BEDU Bright Scholar Education Holdings Limited |
| Sector: Services & Goods | |
| SubSector: Education & Training Services | |
| MarketCap: 792.406 Millions | |
| Recent Price: 1.95 Smart Investing & Trading Score : 46 | |
| Day Percent Change: 2.63% Day Change: 0.05 | |
| Week Change: -2.99% Year-to-date Change: 56.0% | |
| BEDU Links: Profile News Message Board | |
| Charts:- Daily , Weekly | |
| Add BEDU to Watchlist: View: Get Complete BEDU Trend Analysis ➞ | |
 | QFIN 360 Finance, Inc. |
| Sector: Financials | |
| SubSector: Credit Services | |
| MarketCap: 956.208 Millions | |
| Recent Price: 18.86 Smart Investing & Trading Score : 46 | |
| Day Percent Change: 0.72% Day Change: 0.13 | |
| Week Change: 4.81% Year-to-date Change: 19.3% | |
| QFIN Links: Profile News Message Board | |
| Charts:- Daily , Weekly | |
| Add QFIN to Watchlist: View: Get Complete QFIN Trend Analysis ➞ | |
 | MSC Studio City International Holdings Limited |
| Sector: Services & Goods | |
| SubSector: Resorts & Casinos | |
| MarketCap: 1420.54 Millions | |
| Recent Price: 7.00 Smart Investing & Trading Score : 46 | |
| Day Percent Change: -3.18% Day Change: -0.23 | |
| Week Change: -6.54% Year-to-date Change: 8.0% | |
| MSC Links: Profile News Message Board | |
| Charts:- Daily , Weekly | |
| Add MSC to Watchlist: View: Get Complete MSC Trend Analysis ➞ | |
 | CIG Companhia Energetica de Minas Gerais |
| Sector: Utilities | |
| SubSector: Electric Utilities | |
| MarketCap: 3203.54 Millions | |
| Recent Price: 2.41 Smart Investing & Trading Score : 46 | |
| Day Percent Change: -2.03% Day Change: -0.05 | |
| Week Change: -2.82% Year-to-date Change: 3.9% | |
| CIG Links: Profile News Message Board | |
| Charts:- Daily , Weekly | |
| Add CIG to Watchlist: View: Get Complete CIG Trend Analysis ➞ | |
 | UMC United Microelectronics Corporation |
| Sector: Technology | |
| SubSector: Semiconductor Equipment & Materials | |
| MarketCap: 5672.78 Millions | |
| Recent Price: 7.76 Smart Investing & Trading Score : 45 | |
| Day Percent Change: 0.78% Day Change: 0.06 | |
| Week Change: 4.86% Year-to-date Change: -8.3% | |
| UMC Links: Profile News Message Board | |
| Charts:- Daily , Weekly | |
| Add UMC to Watchlist: View: Get Complete UMC Trend Analysis ➞ | |
 | GGR Gogoro Inc. |
| Sector: Services & Goods | |
| SubSector: Auto Parts | |
| MarketCap: 856 Millions | |
| Recent Price: 1.50 Smart Investing & Trading Score : 45 | |
| Day Percent Change: 0.67% Day Change: 0.01 | |
| Week Change: 6.38% Year-to-date Change: -42.3% | |
| GGR Links: Profile News Message Board | |
| Charts:- Daily , Weekly | |
| Add GGR to Watchlist: View: Get Complete GGR Trend Analysis ➞ | |
 | LXEH Lixiang Education Holding Co., Ltd. |
| Sector: Consumer Staples | |
| SubSector: Education & Training Services | |
| MarketCap: 12347 Millions | |
| Recent Price: 0.40 Smart Investing & Trading Score : 45 | |
| Day Percent Change: -4.77% Day Change: -0.02 | |
| Week Change: -3.37% Year-to-date Change: -63.6% | |
| LXEH Links: Profile News Message Board | |
| Charts:- Daily , Weekly | |
| Add LXEH to Watchlist: View: Get Complete LXEH Trend Analysis ➞ | |
 | HSAI Hesai Group |
| Sector: Services & Goods | |
| SubSector: Auto Parts | |
| MarketCap: 1330 Millions | |
| Recent Price: 4.17 Smart Investing & Trading Score : 45 | |
| Day Percent Change: -3.92% Day Change: -0.17 | |
| Week Change: 5.04% Year-to-date Change: -54.1% | |
| HSAI Links: Profile News Message Board | |
| Charts:- Daily , Weekly | |
| Add HSAI to Watchlist: View: Get Complete HSAI Trend Analysis ➞ | |
 | LVRO Lavoro Limited |
| Sector: Materials | |
| SubSector: Agricultural Inputs | |
| MarketCap: 686 Millions | |
| Recent Price: 5.98 Smart Investing & Trading Score : 45 | |
| Day Percent Change: -1.48% Day Change: -0.09 | |
| Week Change: 1.7% Year-to-date Change: -32.7% | |
| LVRO Links: Profile News Message Board | |
| Charts:- Daily , Weekly | |
| Add LVRO to Watchlist: View: Get Complete LVRO Trend Analysis ➞ | |
 | HOLO MicroCloud Hologram Inc. |
| Sector: Technology | |
| SubSector: Electronic Components | |
| MarketCap: 159 Millions | |
| Recent Price: 2.67 Smart Investing & Trading Score : 43 | |
| Day Percent Change: 13.86% Day Change: 0.32 | |
| Week Change: -4.3% Year-to-date Change: 668.4% | |
| HOLO Links: Profile News Message Board | |
| Charts:- Daily , Weekly | |
| Add HOLO to Watchlist: View: Get Complete HOLO Trend Analysis ➞ | |
 | SMI Semiconductor Manufacturing International Corporation |
| Sector: Technology | |
| SubSector: Semiconductor - Integrated Circuits | |
| MarketCap: 6287.56 Millions | |
| Recent Price: 45.59 Smart Investing & Trading Score : 43 | |
| Day Percent Change: -0.34% Day Change: -0.15 | |
| Week Change: -0.29% Year-to-date Change: -1.9% | |
| SMI Links: Profile News Message Board | |
| Charts:- Daily , Weekly | |
| Add SMI to Watchlist: View: Get Complete SMI Trend Analysis ➞ | |
| For tabular summary view of above stock list: Summary View ➞ 0 - 25 , 25 - 50 , 50 - 75 , 75 - 100 , 100 - 125 , 125 - 150 , 150 - 175 , 175 - 200 | ||
| Click To Change The Sort Order: By Market Cap or Company Size Performance: Year-to-date, Week and Day | |
| Select Chart Type: | ||
|
Best Stocks Today 12Stocks.com |
© 2024 12Stocks.com Terms & Conditions Privacy Contact Us
All Information Provided Only For Education And Not To Be Used For Investing or Trading. See Terms & Conditions


One More Thing ... Get Best Stocks Delivered Daily!
Never Ever Miss A Move With Our Top Ten Stocks Lists
Find Best Stocks In Any Market - Bull or Bear Market
Take A Peek At Our Top Ten Stocks Lists: Daily, Weekly, Year-to-Date & Top Trends
Find Best Stocks In Any Market - Bull or Bear Market
Take A Peek At Our Top Ten Stocks Lists: Daily, Weekly, Year-to-Date & Top Trends
Emerging Markets Stocks With Best Up Trends [0-bearish to 100-bullish]: Yatsen Holding[100], Kanzhun [100], Grupo Aeroportuario[100], JD.com [100], Dada Nexus[100], ZTO Express[100], Alibaba [100], Baozun [95], MOGU [93], Full Truck[93], MINISO [93]
Best Emerging Markets Stocks Year-to-Date:
U Power[2852.01%], DouYu [791.58%], MicroCloud Hologram[668.35%], China Liberal[520.81%], Yatsen Holding[502.79%], Zhongchao [312.22%], Uxin [172.47%], QuantaSing [103.7%], GigaCloud [97.54%], Cheetah Mobile[88.16%], Yiren Digital[61.54%] Best Emerging Markets Stocks This Week:
WiMi Hologram[33.51%], Yatsen Holding[21.99%], Cheetah Mobile[21.19%], iQIYI [17.99%], Aesthetic Medical[17.77%], TAL Education[16.8%], Golden Heaven[15.91%], Grupo Aeroportuario[15.25%], Hutchison China[15.16%], BeiGene [14.7%], Bilibili [14.67%] Best Emerging Markets Stocks Daily:
Boqii Holding[15.69%], MicroCloud Hologram[13.86%], TAL Education[8.89%], MOGU [8.43%], Cheetah Mobile[8.33%], Shengfeng Development[7.69%], Viomi [7.13%], Sify [5.88%], DRDGOLD [5.50%], Fangdd Network[5.41%], Secoo Holding[5.19%]