
 Login Sign Up


| |||||
 |  | ||||

| 12Stocks.com Market Intelligence |
Best Emerging Markets Stocks
| In a hurry? Emerging Markets Stocks Lists: Trends Table, Stock Charts
Sort Emerging Markets stocks: Daily, Weekly, Year-to-Date, Market Cap & Trends. Filter Emerging Markets stocks list by sector: Show all, Tech, Finance, Energy, Staples, Retail, Industrial, Materials, Utilities and HealthCare Filter Emerging Markets stocks list by size:All Large Medium Small |
| 12Stocks.com Emerging Markets Stocks Performances & Trends Daily | |||||||||
|
|  The overall Smart Investing & Trading Score is 38 (0-bearish to 100-bullish) which puts Emerging Markets index in short term bearish to neutral trend. The Smart Investing & Trading Score from previous trading session is 31 and hence an improvement of trend.
| ||||||||
Here are the Smart Investing & Trading Scores of the most requested Emerging Markets stocks at 12Stocks.com (click stock name for detailed review):
|


| 12Stocks.com: Top Performing Emerging Markets Index Stocks | ||||||||||||||||||||||||||||||||||||||||||||||||
 The top performing Emerging Markets Index stocks year to date are
Now, more recently, over last week, the top performing Emerging Markets Index stocks on the move are


|
||||||||||||||||||||||||||||||||||||||||||||||||
| 12Stocks.com: Investing in Emerging Markets Index with Stocks | |
|
The following table helps investors and traders sort through current performance and trends (as measured by Smart Investing & Trading Score ) of various
stocks in the Emerging Markets Index. Quick View: Move mouse or cursor over stock symbol (ticker) to view short-term technical chart and over stock name to view long term chart. Click on  to add stock symbol to your watchlist and to add stock symbol to your watchlist and  to view watchlist. Click on any ticker or stock name for detailed market intelligence report for that stock. to view watchlist. Click on any ticker or stock name for detailed market intelligence report for that stock. |
12Stocks.com Performance of Stocks in Emerging Markets Index
| Ticker | Stock Name | Watchlist | Category | Recent Price | Smart Investing & Trading Score | Change % | Weekly Change% |
| RGC | Regencell Bioscience |   | Health Care | 4.74 | 24 | 27.68% | 24.33% |
| YSG | Yatsen Holding | | Services & Goods | 3.61 | 90 | 0.28% | 19.93% |
| KNDI | Kandi | | Consumer Staples | 2.40 | 64 | 8.11% | 14.83% |
| BNR | Burning Rock | | Health Care | 0.81 | 57 | -1.10% | 6.58% |
| VLRS | Controladora Vuela | | Transports | 7.51 | 67 | 6.37% | 6.52% |
| QSG | QuantaSing | | Consumer Staples | 3.56 | 42 | 8.87% | 5.95% |
| BEDU | Bright Scholar | | Services & Goods | 1.94 | 70 | 0.00% | 5.43% |
| EM | Smart Share | | Services & Goods | 0.63 | 63 | 4.18% | 5.06% |
| DOYU | DouYu | | Technology | 7.89 | 90 | 1.02% | 4.50% |
| SDA | SunCar | | Services & Goods | 7.31 | 59 | -2.53% | 4.43% |
| MOMO | Momo | | Technology | 5.52 | 32 | -0.72% | 4.15% |
| TOUR | Tuniu | | Consumer Staples | 0.81 | 51 | 10.84% | 3.60% |
| GCT | GigaCloud | | Technology | 34.93 | 100 | -0.46% | 3.36% |
| EH | EHang | | Industrials | 17.31 | 68 | 5.81% | 2.49% |
| HUIZ | Huize Holding | | Financials | 0.61 | 39 | 4.24% | 2.48% |
| SECO | Secoo Holding | | Services & Goods | 0.37 | 20 | -2.06% | 2.29% |
| SFWL | Shengfeng Development | | Industrials | 1.84 | 66 | -3.66% | 2.22% |
| BRFS | BRF S.A | | Consumer Staples | 3.26 | 53 | -4.12% | 2.19% |
| CLEU | China Liberal | | Consumer Staples | 0.99 | 25 | 0.00% | 2.06% |
| WB | | Technology | 7.77 | 37 | 0.91% | 1.83% | |
| KRKR | 36Kr | | Technology | 0.38 | 50 | 1.40% | 1.81% |
| RC | Ready Capital | | Financials | 8.47 | 52 | 1.68% | 1.80% |
| COE | China Online | | Services & Goods | 6.60 | 42 | -2.80% | 1.38% |
| RLX | RLX | | Consumer Staples | 1.78 | 17 | -0.56% | 1.14% |
| CNF | CNFinance | | Financials | 1.87 | 10 | 1.63% | 1.08% |
| For chart view version of above stock list: Chart View ➞ 0 - 25 , 25 - 50 , 50 - 75 , 75 - 100 , 100 - 125 , 125 - 150 , 150 - 175 , 175 - 200 | ||
 | Click To Change The Sort Order: By Market Cap or Company Size Performance: Year-to-date, Week and Day |  |
|
Get the most comprehensive stock market coverage daily at 12Stocks.com ➞ Best Stocks Today ➞ Best Stocks Weekly ➞ Best Stocks Year-to-Date ➞ Best Stocks Trends ➞  Best Stocks Today 12Stocks.com Best Nasdaq Stocks ➞ Best S&P 500 Stocks ➞ Best Tech Stocks ➞ Best Biotech Stocks ➞ |
| Detailed Overview of Emerging Markets Stocks |
| Emerging Markets Technical Overview, Leaders & Laggards, Top Emerging Markets ETF Funds & Detailed Emerging Markets Stocks List, Charts, Trends & More |
| Emerging Markets: Technical Analysis, Trends & YTD Performance | |
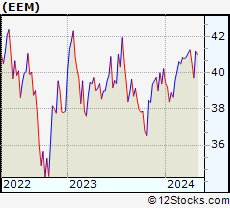
 EEM Weekly Chart |
|
| Long Term Trend: Good | |
| Medium Term Trend: Not Good | |
 EEM Daily Chart |
|
| Short Term Trend: Not Good | |
| Overall Trend Score: 38 | |
| YTD Performance: -1.24% | |
| **Trend Scores & Views Are Only For Educational Purposes And Not For Investing | |
| 12Stocks.com: Investing in Emerging Markets Index using Exchange Traded Funds | |
|
The following table shows list of key exchange traded funds (ETF) that
help investors play Emerging Markets stock market. For detailed view, check out our ETF Funds section of our website. Quick View: Move mouse or cursor over ETF symbol (ticker) to view short-term technical chart and over ETF name to view long term chart. Click on ticker or stock name for detailed view. Click on to add stock symbol to your watchlist and to view watchlist. |
12Stocks.com List of ETFs that track Emerging Markets Index
| Ticker | ETF Name | Watchlist | Recent Price | Smart Investing & Trading Score | Change % | Week % | Year-to-date % |
| EEM | Emerging Markets | | 39.71 | 38 | -0.08 | -2.02 | -1.24% |
| VWO | Emerging Markets | | 40.90 | 38 | 0.17 | -1.68 | -0.49% |
| SCHE | Emerging Markets Equity | | 24.70 | 38 | 0.04 | -1.71 | -0.36% |
| EWX | Emerging Markets Small | | 55.35 | 41 | 1.17 | -1.27 | -1.97% |
| EET | Emerging Markets | | 47.95 | 31 | -0.15 | -3.72 | -5.73% |
| EDC | Emrg Mkts Bull | | 27.12 | 38 | -0.18 | -6.09 | -10.88% |
| EEV | Short Emerging | | 20.56 | 74 | 0.26 | 4.15 | 4.24% |
| EUM | Short Emerging | | 14.50 | 74 | 0.31 | 2.22 | 2.47% |
| EDIV | Emerging Markets Dividend | | 32.71 | 43 | 0.77 | -0.7 | 0.58% |
| EMIF | Emerging Markets Infrastructure | | 21.36 | 33 | 0.23 | -1.94 | -0.19% |
| CEW | Emerging Currency Strat | | 17.58 | 28 | 0.24 | -0.59 | -2.35% |
| EBND | Em Mkts Lcl | | 19.89 | 10 | 0.61 | -0.9 | -6.36% |
| EMCB | Emerging Markets Corp | | 63.97 | 21 | -0.17 | -0.2 | 0.11% |
| VWOB | Emerging Mkts Govt | | 62.18 | 25 | 0.79 | -0.77 | -2.46% |
| EEMA | Emerging Markets Asia | | 65.90 | 31 | -0.15 | -2.13 | -0.32% |
| EELV | Em Mkts Low | | 23.11 | 0 | 0.06 | -1.72 | -3.87% |
| DVYE | Emerging Markets Dividend | | 26.31 | 53 | 0.69 | -0.57 | -0.68% |
| SDEM | SuperDividend Em Mkts | | 25.58 | 56 | 0.59 | -0.48 | 3.16% |
| DBEM | Em Mkts Hdgd | | 23.07 | 31 | -0.41 | -1.91 | 0% |
| PCY | Emerging Markets Sov | | 19.80 | 17 | 0.99 | -1.1 | -3.98% |
| QEMM | Emerging Mkts StratcFacts | | 56.05 | 33 | 0.02 | -1.46 | -1.93% |
| 12Stocks.com: Charts, Trends, Fundamental Data and Performances of Emerging Markets Stocks | |
|
We now take in-depth look at all Emerging Markets stocks including charts, multi-period performances and overall trends (as measured by Smart Investing & Trading Score ). One can sort Emerging Markets stocks (click link to choose) by Daily, Weekly and by Year-to-Date performances. Also, one can sort by size of the company or by market capitalization. |
| Select Your Default Chart Type: | |||||
| |||||
| Click on stock symbol or name for detailed view. Click on to add stock symbol to your watchlist and to view watchlist. Quick View: Move mouse or cursor over "Daily" to quickly view daily technical stock chart and over "Weekly" to view weekly technical stock chart. | |||||

 | RGC Regencell Bioscience Holdings Limited |
| Sector: Health Care | |
| SubSector: Drug Manufacturers - Specialty & Generic | |
| MarketCap: 284 Millions | |
| Recent Price: 4.74 Smart Investing & Trading Score : 24 | |
| Day Percent Change: 27.68% Day Change: 1.03 | |
| Week Change: 24.33% Year-to-date Change: -54.9% | |
| RGC Links: Profile News Message Board | |
| Charts:- Daily , Weekly | |
| Add RGC to Watchlist: View: Get Complete RGC Trend Analysis ➞ | |
 | YSG Yatsen Holding Limited |
| Sector: Services & Goods | |
| SubSector: Specialty Retail | |
| MarketCap: 11827 Millions | |
| Recent Price: 3.61 Smart Investing & Trading Score : 90 | |
| Day Percent Change: 0.28% Day Change: 0.01 | |
| Week Change: 19.93% Year-to-date Change: 393.4% | |
| YSG Links: Profile News Message Board | |
| Charts:- Daily , Weekly | |
| Add YSG to Watchlist: View: Get Complete YSG Trend Analysis ➞ | |
 | KNDI Kandi Technologies Group, Inc. |
| Sector: Consumer Staples | |
| SubSector: Auto Manufacturers - Major | |
| MarketCap: 137.471 Millions | |
| Recent Price: 2.40 Smart Investing & Trading Score : 64 | |
| Day Percent Change: 8.11% Day Change: 0.18 | |
| Week Change: 14.83% Year-to-date Change: -14.3% | |
| KNDI Links: Profile News Message Board | |
| Charts:- Daily , Weekly | |
| Add KNDI to Watchlist: View: Get Complete KNDI Trend Analysis ➞ | |
 | BNR Burning Rock Biotech Limited |
| Sector: Health Care | |
| SubSector: Diagnostics & Research | |
| MarketCap: 27887 Millions | |
| Recent Price: 0.81 Smart Investing & Trading Score : 57 | |
| Day Percent Change: -1.10% Day Change: -0.01 | |
| Week Change: 6.58% Year-to-date Change: -16.1% | |
| BNR Links: Profile News Message Board | |
| Charts:- Daily , Weekly | |
| Add BNR to Watchlist: View: Get Complete BNR Trend Analysis ➞ | |
 | VLRS Controladora Vuela Compania de Aviacion, S.A.B. de C.V. |
| Sector: Transports | |
| SubSector: Major Airlines | |
| MarketCap: 382 Millions | |
| Recent Price: 7.51 Smart Investing & Trading Score : 67 | |
| Day Percent Change: 6.37% Day Change: 0.45 | |
| Week Change: 6.52% Year-to-date Change: -19.9% | |
| VLRS Links: Profile News Message Board | |
| Charts:- Daily , Weekly | |
| Add VLRS to Watchlist: View: Get Complete VLRS Trend Analysis ➞ | |
 | QSG QuantaSing Group Limited |
| Sector: Consumer Staples | |
| SubSector: Education & Training Services | |
| MarketCap: 433 Millions | |
| Recent Price: 3.56 Smart Investing & Trading Score : 42 | |
| Day Percent Change: 8.87% Day Change: 0.29 | |
| Week Change: 5.95% Year-to-date Change: 119.8% | |
| QSG Links: Profile News Message Board | |
| Charts:- Daily , Weekly | |
| Add QSG to Watchlist: View: Get Complete QSG Trend Analysis ➞ | |
 | BEDU Bright Scholar Education Holdings Limited |
| Sector: Services & Goods | |
| SubSector: Education & Training Services | |
| MarketCap: 792.406 Millions | |
| Recent Price: 1.94 Smart Investing & Trading Score : 70 | |
| Day Percent Change: 0.00% Day Change: 0.00 | |
| Week Change: 5.43% Year-to-date Change: 55.2% | |
| BEDU Links: Profile News Message Board | |
| Charts:- Daily , Weekly | |
| Add BEDU to Watchlist: View: Get Complete BEDU Trend Analysis ➞ | |
 | EM Smart Share Global Limited |
| Sector: Services & Goods | |
| SubSector: Personal Services | |
| MarketCap: 238 Millions | |
| Recent Price: 0.63 Smart Investing & Trading Score : 63 | |
| Day Percent Change: 4.18% Day Change: 0.03 | |
| Week Change: 5.06% Year-to-date Change: 21.4% | |
| EM Links: Profile News Message Board | |
| Charts:- Daily , Weekly | |
| Add EM to Watchlist: View: Get Complete EM Trend Analysis ➞ | |
 | DOYU DouYu International Holdings Limited |
| Sector: Technology | |
| SubSector: Internet Information Providers | |
| MarketCap: 2483 Millions | |
| Recent Price: 7.89 Smart Investing & Trading Score : 90 | |
| Day Percent Change: 1.02% Day Change: 0.08 | |
| Week Change: 4.5% Year-to-date Change: 730.5% | |
| DOYU Links: Profile News Message Board | |
| Charts:- Daily , Weekly | |
| Add DOYU to Watchlist: View: Get Complete DOYU Trend Analysis ➞ | |
 | SDA SunCar Technology Group Inc. |
| Sector: Services & Goods | |
| SubSector: Auto & Truck Dealerships | |
| MarketCap: 2680 Millions | |
| Recent Price: 7.31 Smart Investing & Trading Score : 59 | |
| Day Percent Change: -2.53% Day Change: -0.19 | |
| Week Change: 4.43% Year-to-date Change: -5.9% | |
| SDA Links: Profile News Message Board | |
| Charts:- Daily , Weekly | |
| Add SDA to Watchlist: View: Get Complete SDA Trend Analysis ➞ | |
 | MOMO Momo Inc. |
| Sector: Technology | |
| SubSector: Internet Software & Services | |
| MarketCap: 4796.71 Millions | |
| Recent Price: 5.52 Smart Investing & Trading Score : 32 | |
| Day Percent Change: -0.72% Day Change: -0.04 | |
| Week Change: 4.15% Year-to-date Change: -20.6% | |
| MOMO Links: Profile News Message Board | |
| Charts:- Daily , Weekly | |
| Add MOMO to Watchlist: View: Get Complete MOMO Trend Analysis ➞ | |
 | TOUR Tuniu Corporation |
| Sector: Consumer Staples | |
| SubSector: Recreational Goods, Other | |
| MarketCap: 124.459 Millions | |
| Recent Price: 0.81 Smart Investing & Trading Score : 51 | |
| Day Percent Change: 10.84% Day Change: 0.08 | |
| Week Change: 3.6% Year-to-date Change: 20.4% | |
| TOUR Links: Profile News Message Board | |
| Charts:- Daily , Weekly | |
| Add TOUR to Watchlist: View: Get Complete TOUR Trend Analysis ➞ | |
 | GCT GigaCloud Technology Inc. |
| Sector: Technology | |
| SubSector: Software - Infrastructure | |
| MarketCap: 240 Millions | |
| Recent Price: 34.93 Smart Investing & Trading Score : 100 | |
| Day Percent Change: -0.46% Day Change: -0.16 | |
| Week Change: 3.36% Year-to-date Change: 90.8% | |
| GCT Links: Profile News Message Board | |
| Charts:- Daily , Weekly | |
| Add GCT to Watchlist: View: Get Complete GCT Trend Analysis ➞ | |
 | EH EHang Holdings Limited |
| Sector: Industrials | |
| SubSector: Aerospace/Defense Products & Services | |
| MarketCap: 513.401 Millions | |
| Recent Price: 17.31 Smart Investing & Trading Score : 68 | |
| Day Percent Change: 5.81% Day Change: 0.95 | |
| Week Change: 2.49% Year-to-date Change: 3.0% | |
| EH Links: Profile News Message Board | |
| Charts:- Daily , Weekly | |
| Add EH to Watchlist: View: Get Complete EH Trend Analysis ➞ | |
 | HUIZ Huize Holding Limited |
| Sector: Financials | |
| SubSector: Insurance Brokers | |
| MarketCap: 37157 Millions | |
| Recent Price: 0.61 Smart Investing & Trading Score : 39 | |
| Day Percent Change: 4.24% Day Change: 0.03 | |
| Week Change: 2.48% Year-to-date Change: -31.7% | |
| HUIZ Links: Profile News Message Board | |
| Charts:- Daily , Weekly | |
| Add HUIZ to Watchlist: View: Get Complete HUIZ Trend Analysis ➞ | |
 | SECO Secoo Holding Limited |
| Sector: Services & Goods | |
| SubSector: Specialty Retail, Other | |
| MarketCap: 209.144 Millions | |
| Recent Price: 0.37 Smart Investing & Trading Score : 20 | |
| Day Percent Change: -2.06% Day Change: -0.01 | |
| Week Change: 2.29% Year-to-date Change: -35.2% | |
| SECO Links: Profile News Message Board | |
| Charts:- Daily , Weekly | |
| Add SECO to Watchlist: View: Get Complete SECO Trend Analysis ➞ | |
 | SFWL Shengfeng Development Limited |
| Sector: Industrials | |
| SubSector: Integrated Freight & Logistics | |
| MarketCap: 747 Millions | |
| Recent Price: 1.84 Smart Investing & Trading Score : 66 | |
| Day Percent Change: -3.66% Day Change: -0.07 | |
| Week Change: 2.22% Year-to-date Change: -33.1% | |
| SFWL Links: Profile News Message Board | |
| Charts:- Daily , Weekly | |
| Add SFWL to Watchlist: View: Get Complete SFWL Trend Analysis ➞ | |
 | BRFS BRF S.A. |
| Sector: Consumer Staples | |
| SubSector: Meat Products | |
| MarketCap: 2635.51 Millions | |
| Recent Price: 3.26 Smart Investing & Trading Score : 53 | |
| Day Percent Change: -4.12% Day Change: -0.14 | |
| Week Change: 2.19% Year-to-date Change: 17.3% | |
| BRFS Links: Profile News Message Board | |
| Charts:- Daily , Weekly | |
| Add BRFS to Watchlist: View: Get Complete BRFS Trend Analysis ➞ | |
 | CLEU China Liberal Education Holdings Limited |
| Sector: Consumer Staples | |
| SubSector: Education & Training Services | |
| MarketCap: 32347 Millions | |
| Recent Price: 0.99 Smart Investing & Trading Score : 25 | |
| Day Percent Change: 0.00% Day Change: 0.00 | |
| Week Change: 2.06% Year-to-date Change: 453.7% | |
| CLEU Links: Profile News Message Board | |
| Charts:- Daily , Weekly | |
| Add CLEU to Watchlist: View: Get Complete CLEU Trend Analysis ➞ | |
 | WB Weibo Corporation |
| Sector: Technology | |
| SubSector: Internet Information Providers | |
| MarketCap: 8164.6 Millions | |
| Recent Price: 7.77 Smart Investing & Trading Score : 37 | |
| Day Percent Change: 0.91% Day Change: 0.07 | |
| Week Change: 1.83% Year-to-date Change: -29.0% | |
| WB Links: Profile News Message Board | |
| Charts:- Daily , Weekly | |
| Add WB to Watchlist: View: Get Complete WB Trend Analysis ➞ | |
 | KRKR 36Kr Holdings Inc. |
| Sector: Technology | |
| SubSector: Internet Information Providers | |
| MarketCap: 173.18 Millions | |
| Recent Price: 0.38 Smart Investing & Trading Score : 50 | |
| Day Percent Change: 1.40% Day Change: 0.01 | |
| Week Change: 1.81% Year-to-date Change: -32.6% | |
| KRKR Links: Profile News Message Board | |
| Charts:- Daily , Weekly | |
| Add KRKR to Watchlist: View: Get Complete KRKR Trend Analysis ➞ | |
 | RC Ready Capital Corporation |
| Sector: Financials | |
| SubSector: Mortgage Investment | |
| MarketCap: 358.039 Millions | |
| Recent Price: 8.47 Smart Investing & Trading Score : 52 | |
| Day Percent Change: 1.68% Day Change: 0.14 | |
| Week Change: 1.8% Year-to-date Change: -17.4% | |
| RC Links: Profile News Message Board | |
| Charts:- Daily , Weekly | |
| Add RC to Watchlist: View: Get Complete RC Trend Analysis ➞ | |
 | COE China Online Education Group |
| Sector: Services & Goods | |
| SubSector: Education & Training Services | |
| MarketCap: 643.406 Millions | |
| Recent Price: 6.60 Smart Investing & Trading Score : 42 | |
| Day Percent Change: -2.80% Day Change: -0.19 | |
| Week Change: 1.38% Year-to-date Change: -17.8% | |
| COE Links: Profile News Message Board | |
| Charts:- Daily , Weekly | |
| Add COE to Watchlist: View: Get Complete COE Trend Analysis ➞ | |
 | RLX RLX Technology Inc. |
| Sector: Consumer Staples | |
| SubSector: Tobacco | |
| MarketCap: 2800 Millions | |
| Recent Price: 1.78 Smart Investing & Trading Score : 17 | |
| Day Percent Change: -0.56% Day Change: -0.01 | |
| Week Change: 1.14% Year-to-date Change: -10.1% | |
| RLX Links: Profile News Message Board | |
| Charts:- Daily , Weekly | |
| Add RLX to Watchlist: View: Get Complete RLX Trend Analysis ➞ | |
 | CNF CNFinance Holdings Limited |
| Sector: Financials | |
| SubSector: Credit Services | |
| MarketCap: 277.408 Millions | |
| Recent Price: 1.87 Smart Investing & Trading Score : 10 | |
| Day Percent Change: 1.63% Day Change: 0.03 | |
| Week Change: 1.08% Year-to-date Change: -15.8% | |
| CNF Links: Profile News Message Board | |
| Charts:- Daily , Weekly | |
| Add CNF to Watchlist: View: Get Complete CNF Trend Analysis ➞ | |
| For tabular summary view of above stock list: Summary View ➞ 0 - 25 , 25 - 50 , 50 - 75 , 75 - 100 , 100 - 125 , 125 - 150 , 150 - 175 , 175 - 200 | ||
| Click To Change The Sort Order: By Market Cap or Company Size Performance: Year-to-date, Week and Day | |
| Select Chart Type: | ||
|
Best Stocks Today 12Stocks.com |
© 2024 12Stocks.com Terms & Conditions Privacy Contact Us
All Information Provided Only For Education And Not To Be Used For Investing or Trading. See Terms & Conditions


One More Thing ... Get Best Stocks Delivered Daily!
Never Ever Miss A Move With Our Top Ten Stocks Lists
Find Best Stocks In Any Market - Bull or Bear Market
Take A Peek At Our Top Ten Stocks Lists: Daily, Weekly, Year-to-Date & Top Trends
Find Best Stocks In Any Market - Bull or Bear Market
Take A Peek At Our Top Ten Stocks Lists: Daily, Weekly, Year-to-Date & Top Trends
Emerging Markets Stocks With Best Up Trends [0-bearish to 100-bullish]: GigaCloud [100], DouYu [90], Yatsen Holding[90], TAL Education[78], Sibanye Stillwater[76], iQIYI [73], Harmony Gold[71], DRDGOLD [71], Gold Fields[70], Bright Scholar[70], HDFC Bank[69]
Best Emerging Markets Stocks Year-to-Date:
U Power[2651.12%], DouYu [730.53%], MicroCloud Hologram[541.73%], China Liberal[453.69%], Yatsen Holding[393.44%], Zhongchao [275.24%], Uxin [133.95%], QuantaSing [119.75%], GigaCloud [90.77%], Bright Scholar[55.2%], Yiren Digital[50.96%] Best Emerging Markets Stocks This Week:
Regencell Bioscience[24.33%], Yatsen Holding[19.93%], Burning Rock[6.58%], Controladora Vuela[6.52%], QuantaSing [5.95%], Bright Scholar[5.43%], Smart Share[5.06%], DouYu [4.5%], SunCar [4.43%], Momo [4.15%], GigaCloud [3.36%] Best Emerging Markets Stocks Daily:
Regencell Bioscience[27.68%], U Power[10.29%], QuantaSing [8.87%], MINISO [8.10%], Controladora Vuela[6.37%], Aesthetic Medical[6.06%], Hywin [5.87%], EHang [5.81%], Fangdd Network[5.14%], Studio City[5.05%], Hesai [4.50%]