
 Login Sign Up


| |||||
 |  | ||||

| 12Stocks.com Market Intelligence |
Best Emerging Markets Stocks
| In a hurry? Emerging Markets Stocks Lists: Trends Table, Stock Charts
Sort Emerging Markets stocks: Daily, Weekly, Year-to-Date, Market Cap & Trends. Filter Emerging Markets stocks list by sector: Show all, Tech, Finance, Energy, Staples, Retail, Industrial, Materials, Utilities and HealthCare Filter Emerging Markets stocks list by size:All Large Medium Small |
| 12Stocks.com Emerging Markets Stocks Performances & Trends Daily | |||||||||
|
|  The overall Smart Investing & Trading Score is 100 (0-bearish to 100-bullish) which puts Emerging Markets index in short term bullish trend. The Smart Investing & Trading Score from previous trading session is 78 and an improvement of trend continues.
| ||||||||
Here are the Smart Investing & Trading Scores of the most requested Emerging Markets stocks at 12Stocks.com (click stock name for detailed review):
|


| 12Stocks.com: Top Performing Emerging Markets Index Stocks | ||||||||||||||||||||||||||||||||||||||||||||||||
 The top performing Emerging Markets Index stocks year to date are
Now, more recently, over last week, the top performing Emerging Markets Index stocks on the move are


|
||||||||||||||||||||||||||||||||||||||||||||||||
| 12Stocks.com: Investing in Emerging Markets Index with Stocks | |
|
The following table helps investors and traders sort through current performance and trends (as measured by Smart Investing & Trading Score ) of various
stocks in the Emerging Markets Index. Quick View: Move mouse or cursor over stock symbol (ticker) to view short-term technical chart and over stock name to view long term chart. Click on  to add stock symbol to your watchlist and to add stock symbol to your watchlist and  to view watchlist. Click on any ticker or stock name for detailed market intelligence report for that stock. to view watchlist. Click on any ticker or stock name for detailed market intelligence report for that stock. |
12Stocks.com Performance of Stocks in Emerging Markets Index
| Ticker | Stock Name | Watchlist | Category | Recent Price | Smart Investing & Trading Score | Change % | YTD Change% |
| LU | Lufax Holding |   | Financials | 4.70 | 83 | 1.29% | 53.09% |
| PAC | Grupo Aeroportuario | | Transports | 183.99 | 83 | 0.57% | 5.01% |
| HUYA | HUYA | | Services & Goods | 4.77 | 83 | 0.42% | 30.33% |
| VTMX | Vesta Financials | | Financials | 36.15 | 83 | 0.08% | -9.09% |
| NIU | Niu | | Consumer Staples | 2.29 | 83 | -3.78% | 4.57% |
| HCM | Hutchison China | | Health Care | 19.15 | 83 | -2.10% | 5.74% |
| YMM | Full Truck | | Technology | 8.87 | 83 | -0.17% | 26.80% |
| TSM | Taiwan Semiconductor | | Technology | 141.56 | 83 | 3.91% | 36.12% |
| TWN | Taiwan Fund | | Financials | 39.45 | 83 | 0.33% | 14.05% |
| TV | Grupo Televisa | | Services & Goods | 3.17 | 80 | 6.02% | -5.09% |
| YRD | Yiren Digital | | Financials | 5.21 | 78 | -4.40% | 66.99% |
| BZUN | Baozun | | Services & Goods | 2.75 | 78 | -3.85% | 0.36% |
| HUIZ | Huize Holding | | Financials | 0.67 | 78 | -11.21% | -25.56% |
| IBN | ICICI Bank | | Financials | 27.34 | 76 | -0.83% | 14.68% |
| JG | Aurora Mobile | | Technology | 3.08 | 76 | -0.65% | 8.00% |
| KNDI | Kandi | | Consumer Staples | 2.53 | 75 | 3.69% | -9.64% |
| BRFS | BRF S.A | | Consumer Staples | 3.33 | 75 | 0.91% | 19.78% |
| FENG | Phoenix New | | Technology | 2.11 | 75 | 0.48% | 55.15% |
| OMAB | Grupo Aeroportuario | | Transports | 86.69 | 75 | -1.13% | 2.43% |
| HKD | AMTD Digital | | Technology | 3.77 | 74 | 8.33% | -8.72% |
| YI | 111 | | Services & Goods | 1.15 | 74 | 2.68% | -25.81% |
| JKS | JinkoSolar Holding | | Technology | 26.18 | 74 | 2.55% | -29.13% |
| OCFT | OneConnect Financial | | Technology | 2.42 | 74 | 12.04% | -23.17% |
| MLCO | Melco Resorts | | Services & Goods | 7.24 | 74 | 1.26% | -18.38% |
| ABEV | Ambev S.A | | Consumer Staples | 2.43 | 74 | 0.83% | -13.21% |
| For chart view version of above stock list: Chart View ➞ 0 - 25 , 25 - 50 , 50 - 75 , 75 - 100 , 100 - 125 , 125 - 150 , 150 - 175 , 175 - 200 | ||
 | Click To Change The Sort Order: By Market Cap or Company Size Performance: Year-to-date, Week and Day |  |
|
Get the most comprehensive stock market coverage daily at 12Stocks.com ➞ Best Stocks Today ➞ Best Stocks Weekly ➞ Best Stocks Year-to-Date ➞ Best Stocks Trends ➞  Best Stocks Today 12Stocks.com Best Nasdaq Stocks ➞ Best S&P 500 Stocks ➞ Best Tech Stocks ➞ Best Biotech Stocks ➞ |
| Detailed Overview of Emerging Markets Stocks |
| Emerging Markets Technical Overview, Leaders & Laggards, Top Emerging Markets ETF Funds & Detailed Emerging Markets Stocks List, Charts, Trends & More |
| Emerging Markets: Technical Analysis, Trends & YTD Performance | |
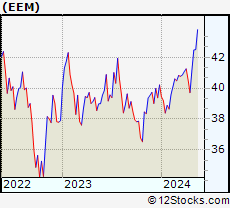
 EEM Weekly Chart |
|
| Long Term Trend: Very Good | |
| Medium Term Trend: Very Good | |
 EEM Daily Chart |
|
| Short Term Trend: Very Good | |
| Overall Trend Score: 100 | |
| YTD Performance: 5.62% | |
| **Trend Scores & Views Are Only For Educational Purposes And Not For Investing | |
| 12Stocks.com: Investing in Emerging Markets Index using Exchange Traded Funds | |
|
The following table shows list of key exchange traded funds (ETF) that
help investors play Emerging Markets stock market. For detailed view, check out our ETF Funds section of our website. Quick View: Move mouse or cursor over ETF symbol (ticker) to view short-term technical chart and over ETF name to view long term chart. Click on ticker or stock name for detailed view. Click on to add stock symbol to your watchlist and to view watchlist. |
12Stocks.com List of ETFs that track Emerging Markets Index
| Ticker | ETF Name | Watchlist | Recent Price | Smart Investing & Trading Score | Change % | Week % | Year-to-date % |
| EEM | Emerging Markets | | 42.47 | 100 | 0.90 | 3.16 | 5.62% |
| VWO | Emerging Markets | | 43.63 | 100 | 0.88 | 3.1 | 6.16% |
| SCHE | Emerging Markets Equity | | 26.35 | 100 | 0.73 | 3.05 | 6.29% |
| EWX | Emerging Markets Small | | 58.18 | 100 | 0.48 | 2.74 | 3.05% |
| EET | Emerging Markets | | 54.38 | 100 | 1.75 | 6.15 | 6.93% |
| EDC | Emrg Mkts Bull | | 32.85 | 100 | 2.82 | 9.46 | 7.95% |
| EEV | Short Emerging | | 18.10 | 0 | -0.39 | -5.85 | -8.23% |
| EUM | Short Emerging | | 13.57 | 0 | -0.84 | -3 | -4.13% |
| EDIV | Emerging Markets Dividend | | 34.42 | 95 | 0.00 | 2.41 | 5.84% |
| EMIF | Emerging Markets Infrastructure | | 22.44 | 100 | 1.77 | 1.45 | 4.86% |
| CEW | Emerging Currency Strat | | 17.88 | 90 | 0.56 | 1.13 | -0.69% |
| EBND | Em Mkts Lcl | | 20.20 | 50 | 0.75 | 1.25 | -4.9% |
| EMCB | Emerging Markets Corp | | 64.20 | 67 | 0.38 | 0.76 | 0.47% |
| VWOB | Emerging Mkts Govt | | 62.99 | 75 | 0.69 | 0.95 | -1.19% |
| EEMA | Emerging Markets Asia | | 71.10 | 100 | 1.08 | 3.42 | 7.55% |
| EELV | Em Mkts Low | | 24.10 | 100 | 0.67 | 2.95 | 0.25% |
| DVYE | Emerging Markets Dividend | | 27.95 | 100 | 1.12 | 3.63 | 5.51% |
| SDEM | SuperDividend Em Mkts | | 26.02 | 77 | 0.13 | 1.98 | 4.95% |
| DBEM | Em Mkts Hdgd | | 24.50 | 100 | 0.57 | 2.25 | 6.2% |
| PCY | Emerging Markets Sov | | 20.13 | 75 | 1.21 | 1.98 | -2.38% |
| QEMM | Emerging Mkts StratcFacts | | 58.78 | 100 | 0.62 | 2.51 | 2.84% |
| 12Stocks.com: Charts, Trends, Fundamental Data and Performances of Emerging Markets Stocks | |
|
We now take in-depth look at all Emerging Markets stocks including charts, multi-period performances and overall trends (as measured by Smart Investing & Trading Score ). One can sort Emerging Markets stocks (click link to choose) by Daily, Weekly and by Year-to-Date performances. Also, one can sort by size of the company or by market capitalization. |
| Select Your Default Chart Type: | |||||
| |||||
| Click on stock symbol or name for detailed view. Click on to add stock symbol to your watchlist and to view watchlist. Quick View: Move mouse or cursor over "Daily" to quickly view daily technical stock chart and over "Weekly" to view weekly technical stock chart. | |||||

 | LU Lufax Holding Ltd |
| Sector: Financials | |
| SubSector: Credit Services | |
| MarketCap: 33457 Millions | |
| Recent Price: 4.70 Smart Investing & Trading Score : 83 | |
| Day Percent Change: 1.29% Day Change: 0.06 | |
| Week Change: 0.43% Year-to-date Change: 53.1% | |
| LU Links: Profile News Message Board | |
| Charts:- Daily , Weekly | |
| Add LU to Watchlist: View: Get Complete LU Trend Analysis ➞ | |
 | PAC Grupo Aeroportuario del Pacifico, S.A.B. de C.V. |
| Sector: Transports | |
| SubSector: Air Services, Other | |
| MarketCap: 3204.18 Millions | |
| Recent Price: 183.99 Smart Investing & Trading Score : 83 | |
| Day Percent Change: 0.57% Day Change: 1.04 | |
| Week Change: 0.28% Year-to-date Change: 5.0% | |
| PAC Links: Profile News Message Board | |
| Charts:- Daily , Weekly | |
| Add PAC to Watchlist: View: Get Complete PAC Trend Analysis ➞ | |
 | HUYA HUYA Inc. |
| Sector: Services & Goods | |
| SubSector: Entertainment - Diversified | |
| MarketCap: 3358.17 Millions | |
| Recent Price: 4.77 Smart Investing & Trading Score : 83 | |
| Day Percent Change: 0.42% Day Change: 0.02 | |
| Week Change: 8.9% Year-to-date Change: 30.3% | |
| HUYA Links: Profile News Message Board | |
| Charts:- Daily , Weekly | |
| Add HUYA to Watchlist: View: Get Complete HUYA Trend Analysis ➞ | |
 | VTMX Vesta Financials Corp SAB de CV |
| Sector: Financials | |
| SubSector: REIT - Industrial | |
| MarketCap: 2270 Millions | |
| Recent Price: 36.15 Smart Investing & Trading Score : 83 | |
| Day Percent Change: 0.08% Day Change: 0.03 | |
| Week Change: -0.17% Year-to-date Change: -9.1% | |
| VTMX Links: Profile News Message Board | |
| Charts:- Daily , Weekly | |
| Add VTMX to Watchlist: View: Get Complete VTMX Trend Analysis ➞ | |
 | NIU Niu Technologies |
| Sector: Consumer Staples | |
| SubSector: Auto Manufacturers - Major | |
| MarketCap: 543.271 Millions | |
| Recent Price: 2.29 Smart Investing & Trading Score : 83 | |
| Day Percent Change: -3.78% Day Change: -0.09 | |
| Week Change: 1.33% Year-to-date Change: 4.6% | |
| NIU Links: Profile News Message Board | |
| Charts:- Daily , Weekly | |
| Add NIU to Watchlist: View: Get Complete NIU Trend Analysis ➞ | |
 | HCM Hutchison China MediTech Limited |
| Sector: Health Care | |
| SubSector: Drug Manufacturers - Major | |
| MarketCap: 2324.43 Millions | |
| Recent Price: 19.15 Smart Investing & Trading Score : 83 | |
| Day Percent Change: -2.10% Day Change: -0.41 | |
| Week Change: 5.45% Year-to-date Change: 5.7% | |
| HCM Links: Profile News Message Board | |
| Charts:- Daily , Weekly | |
| Add HCM to Watchlist: View: Get Complete HCM Trend Analysis ➞ | |
 | YMM Full Truck Alliance Co. Ltd. |
| Sector: Technology | |
| SubSector: Software - Application | |
| MarketCap: 6960 Millions | |
| Recent Price: 8.87 Smart Investing & Trading Score : 83 | |
| Day Percent Change: -0.17% Day Change: -0.02 | |
| Week Change: 1.14% Year-to-date Change: 26.8% | |
| YMM Links: Profile News Message Board | |
| Charts:- Daily , Weekly | |
| Add YMM to Watchlist: View: Get Complete YMM Trend Analysis ➞ | |
 | TSM Taiwan Semiconductor Manufacturing Company Limited |
| Sector: Technology | |
| SubSector: Semiconductor - Integrated Circuits | |
| MarketCap: 239384 Millions | |
| Recent Price: 141.56 Smart Investing & Trading Score : 83 | |
| Day Percent Change: 3.91% Day Change: 5.33 | |
| Week Change: 2.36% Year-to-date Change: 36.1% | |
| TSM Links: Profile News Message Board | |
| Charts:- Daily , Weekly | |
| Add TSM to Watchlist: View: Get Complete TSM Trend Analysis ➞ | |
 | TWN The Taiwan Fund, Inc. |
| Sector: Financials | |
| SubSector: Closed-End Fund - Foreign | |
| MarketCap: 110.547 Millions | |
| Recent Price: 39.45 Smart Investing & Trading Score : 83 | |
| Day Percent Change: 0.33% Day Change: 0.13 | |
| Week Change: 2.84% Year-to-date Change: 14.1% | |
| TWN Links: Profile News Message Board | |
| Charts:- Daily , Weekly | |
| Add TWN to Watchlist: View: Get Complete TWN Trend Analysis ➞ | |
 | TV Grupo Televisa, S.A.B. |
| Sector: Services & Goods | |
| SubSector: Broadcasting - TV | |
| MarketCap: 3740.43 Millions | |
| Recent Price: 3.17 Smart Investing & Trading Score : 80 | |
| Day Percent Change: 6.02% Day Change: 0.18 | |
| Week Change: 0.32% Year-to-date Change: -5.1% | |
| TV Links: Profile News Message Board | |
| Charts:- Daily , Weekly | |
| Add TV to Watchlist: View: Get Complete TV Trend Analysis ➞ | |
 | YRD Yiren Digital Ltd. |
| Sector: Financials | |
| SubSector: Credit Services | |
| MarketCap: 330.208 Millions | |
| Recent Price: 5.21 Smart Investing & Trading Score : 78 | |
| Day Percent Change: -4.40% Day Change: -0.24 | |
| Week Change: 2.56% Year-to-date Change: 67.0% | |
| YRD Links: Profile News Message Board | |
| Charts:- Daily , Weekly | |
| Add YRD to Watchlist: View: Get Complete YRD Trend Analysis ➞ | |
 | BZUN Baozun Inc. |
| Sector: Services & Goods | |
| SubSector: Catalog & Mail Order Houses | |
| MarketCap: 1668.92 Millions | |
| Recent Price: 2.75 Smart Investing & Trading Score : 78 | |
| Day Percent Change: -3.85% Day Change: -0.11 | |
| Week Change: 0% Year-to-date Change: 0.4% | |
| BZUN Links: Profile News Message Board | |
| Charts:- Daily , Weekly | |
| Add BZUN to Watchlist: View: Get Complete BZUN Trend Analysis ➞ | |
 | HUIZ Huize Holding Limited |
| Sector: Financials | |
| SubSector: Insurance Brokers | |
| MarketCap: 37157 Millions | |
| Recent Price: 0.67 Smart Investing & Trading Score : 78 | |
| Day Percent Change: -11.21% Day Change: -0.08 | |
| Week Change: 8.94% Year-to-date Change: -25.6% | |
| HUIZ Links: Profile News Message Board | |
| Charts:- Daily , Weekly | |
| Add HUIZ to Watchlist: View: Get Complete HUIZ Trend Analysis ➞ | |
 | IBN ICICI Bank Limited |
| Sector: Financials | |
| SubSector: Money Center Banks | |
| MarketCap: 31194.1 Millions | |
| Recent Price: 27.34 Smart Investing & Trading Score : 76 | |
| Day Percent Change: -0.83% Day Change: -0.23 | |
| Week Change: 3.05% Year-to-date Change: 14.7% | |
| IBN Links: Profile News Message Board | |
| Charts:- Daily , Weekly | |
| Add IBN to Watchlist: View: Get Complete IBN Trend Analysis ➞ | |
 | JG Aurora Mobile Limited |
| Sector: Technology | |
| SubSector: Application Software | |
| MarketCap: 268.762 Millions | |
| Recent Price: 3.08 Smart Investing & Trading Score : 76 | |
| Day Percent Change: -0.65% Day Change: -0.02 | |
| Week Change: 2.33% Year-to-date Change: 8.0% | |
| JG Links: Profile News Message Board | |
| Charts:- Daily , Weekly | |
| Add JG to Watchlist: View: Get Complete JG Trend Analysis ➞ | |
 | KNDI Kandi Technologies Group, Inc. |
| Sector: Consumer Staples | |
| SubSector: Auto Manufacturers - Major | |
| MarketCap: 137.471 Millions | |
| Recent Price: 2.53 Smart Investing & Trading Score : 75 | |
| Day Percent Change: 3.69% Day Change: 0.09 | |
| Week Change: -3.07% Year-to-date Change: -9.6% | |
| KNDI Links: Profile News Message Board | |
| Charts:- Daily , Weekly | |
| Add KNDI to Watchlist: View: Get Complete KNDI Trend Analysis ➞ | |
 | BRFS BRF S.A. |
| Sector: Consumer Staples | |
| SubSector: Meat Products | |
| MarketCap: 2635.51 Millions | |
| Recent Price: 3.33 Smart Investing & Trading Score : 75 | |
| Day Percent Change: 0.91% Day Change: 0.03 | |
| Week Change: -3.48% Year-to-date Change: 19.8% | |
| BRFS Links: Profile News Message Board | |
| Charts:- Daily , Weekly | |
| Add BRFS to Watchlist: View: Get Complete BRFS Trend Analysis ➞ | |
 | FENG Phoenix New Media Limited |
| Sector: Technology | |
| SubSector: Internet Information Providers | |
| MarketCap: 107.08 Millions | |
| Recent Price: 2.11 Smart Investing & Trading Score : 75 | |
| Day Percent Change: 0.48% Day Change: 0.01 | |
| Week Change: 20.57% Year-to-date Change: 55.2% | |
| FENG Links: Profile News Message Board | |
| Charts:- Daily , Weekly | |
| Add FENG to Watchlist: View: Get Complete FENG Trend Analysis ➞ | |
 | OMAB Grupo Aeroportuario del Centro Norte, S.A.B. de C.V. |
| Sector: Transports | |
| SubSector: Air Services, Other | |
| MarketCap: 1196.38 Millions | |
| Recent Price: 86.69 Smart Investing & Trading Score : 75 | |
| Day Percent Change: -1.13% Day Change: -0.99 | |
| Week Change: -1.62% Year-to-date Change: 2.4% | |
| OMAB Links: Profile News Message Board | |
| Charts:- Daily , Weekly | |
| Add OMAB to Watchlist: View: Get Complete OMAB Trend Analysis ➞ | |
 | HKD AMTD Digital Inc. |
| Sector: Technology | |
| SubSector: Software - Application | |
| MarketCap: 1200 Millions | |
| Recent Price: 3.77 Smart Investing & Trading Score : 74 | |
| Day Percent Change: 8.33% Day Change: 0.29 | |
| Week Change: 16.36% Year-to-date Change: -8.7% | |
| HKD Links: Profile News Message Board | |
| Charts:- Daily , Weekly | |
| Add HKD to Watchlist: View: Get Complete HKD Trend Analysis ➞ | |
 | YI 111, Inc. |
| Sector: Services & Goods | |
| SubSector: Drug Stores | |
| MarketCap: 520.351 Millions | |
| Recent Price: 1.15 Smart Investing & Trading Score : 74 | |
| Day Percent Change: 2.68% Day Change: 0.03 | |
| Week Change: 12.2% Year-to-date Change: -25.8% | |
| YI Links: Profile News Message Board | |
| Charts:- Daily , Weekly | |
| Add YI to Watchlist: View: Get Complete YI Trend Analysis ➞ | |
 | JKS JinkoSolar Holding Co., Ltd. |
| Sector: Technology | |
| SubSector: Semiconductor - Specialized | |
| MarketCap: 629.36 Millions | |
| Recent Price: 26.18 Smart Investing & Trading Score : 74 | |
| Day Percent Change: 2.55% Day Change: 0.65 | |
| Week Change: 8.45% Year-to-date Change: -29.1% | |
| JKS Links: Profile News Message Board | |
| Charts:- Daily , Weekly | |
| Add JKS to Watchlist: View: Get Complete JKS Trend Analysis ➞ | |
 | OCFT OneConnect Financial Technology Co., Ltd. |
| Sector: Technology | |
| SubSector: Software Application | |
| MarketCap: 80387 Millions | |
| Recent Price: 2.42 Smart Investing & Trading Score : 74 | |
| Day Percent Change: 12.04% Day Change: 0.26 | |
| Week Change: 21% Year-to-date Change: -23.2% | |
| OCFT Links: Profile News Message Board | |
| Charts:- Daily , Weekly | |
| Add OCFT to Watchlist: View: Get Complete OCFT Trend Analysis ➞ | |
 | MLCO Melco Resorts & Entertainment Limited |
| Sector: Services & Goods | |
| SubSector: Resorts & Casinos | |
| MarketCap: 7031.14 Millions | |
| Recent Price: 7.24 Smart Investing & Trading Score : 74 | |
| Day Percent Change: 1.26% Day Change: 0.09 | |
| Week Change: 14.2% Year-to-date Change: -18.4% | |
| MLCO Links: Profile News Message Board | |
| Charts:- Daily , Weekly | |
| Add MLCO to Watchlist: View: Get Complete MLCO Trend Analysis ➞ | |
 | ABEV Ambev S.A. |
| Sector: Consumer Staples | |
| SubSector: Beverages - Brewers | |
| MarketCap: 37753.5 Millions | |
| Recent Price: 2.43 Smart Investing & Trading Score : 74 | |
| Day Percent Change: 0.83% Day Change: 0.02 | |
| Week Change: 4.29% Year-to-date Change: -13.2% | |
| ABEV Links: Profile News Message Board | |
| Charts:- Daily , Weekly | |
| Add ABEV to Watchlist: View: Get Complete ABEV Trend Analysis ➞ | |
| For tabular summary view of above stock list: Summary View ➞ 0 - 25 , 25 - 50 , 50 - 75 , 75 - 100 , 100 - 125 , 125 - 150 , 150 - 175 , 175 - 200 | ||
| Click To Change The Sort Order: By Market Cap or Company Size Performance: Year-to-date, Week and Day | |
| Select Chart Type: | ||
|
Best Stocks Today 12Stocks.com |
© 2024 12Stocks.com Terms & Conditions Privacy Contact Us
All Information Provided Only For Education And Not To Be Used For Investing or Trading. See Terms & Conditions


One More Thing ... Get Best Stocks Delivered Daily!
Never Ever Miss A Move With Our Top Ten Stocks Lists
Find Best Stocks In Any Market - Bull or Bear Market
Take A Peek At Our Top Ten Stocks Lists: Daily, Weekly, Year-to-Date & Top Trends
Find Best Stocks In Any Market - Bull or Bear Market
Take A Peek At Our Top Ten Stocks Lists: Daily, Weekly, Year-to-Date & Top Trends
Emerging Markets Stocks With Best Up Trends [0-bearish to 100-bullish]: SunCar [100], Hesai [100], Trip.com [100], Noah [100], Weibo [100], United Microelectronics[100], KE [100], Tencent Music[100], Huazhu [100], BrasilAgro -[100], America Movil[100]
Best Emerging Markets Stocks Year-to-Date:
U Power[3264.96%], DouYu [854.74%], MicroCloud Hologram[553.24%], China Liberal[515.21%], Yatsen Holding[493.22%], Zhongchao [338.24%], Uxin [188.16%], GigaCloud [97.11%], QuantaSing [95.06%], Cheetah Mobile[74.12%], Smart Share[68.93%] Best Emerging Markets Stocks This Week:
Smart Share[40.05%], Dingdong (Cayman)[24.6%], NIO [24.05%], OneConnect Financial[21%], 21Vianet [20.89%], KE [17.8%], U Power[17.77%], Hesai [17.05%], Lixiang Education[16.68%], AMTD Digital[16.36%], XPeng [15.56%] Best Emerging Markets Stocks Daily:
OneConnect Financial[12.04%], U Power[9.44%], SunCar [9.43%], Azul S.A[8.63%], AMTD Digital[8.33%], Burning Rock[6.51%], Nu [6.13%], Grupo Televisa[6.02%], XP [5.96%], Dingdong (Cayman)[5.72%], Studio City[5.54%]