
 Login Sign Up


| |||||
 |  | ||||

| 12Stocks.com Market Intelligence |
Best Emerging Markets Stocks
| In a hurry? Emerging Markets Stocks Lists: Trends Table, Stock Charts
Sort Emerging Markets stocks: Daily, Weekly, Year-to-Date, Market Cap & Trends. Filter Emerging Markets stocks list by sector: Show all, Tech, Finance, Energy, Staples, Retail, Industrial, Materials, Utilities and HealthCare Filter Emerging Markets stocks list by size:All Large Medium Small |
| 12Stocks.com Emerging Markets Stocks Performances & Trends Daily | |||||||||
|
|  The overall Smart Investing & Trading Score is 61 (0-bearish to 100-bullish) which puts Emerging Markets index in short term neutral to bullish trend. The Smart Investing & Trading Score from previous trading session is 68 and hence a deterioration of trend.
| ||||||||
Here are the Smart Investing & Trading Scores of the most requested Emerging Markets stocks at 12Stocks.com (click stock name for detailed review):
|


| 12Stocks.com: Top Performing Emerging Markets Index Stocks | ||||||||||||||||||||||||||||||||||||||||||||||||
 The top performing Emerging Markets Index stocks year to date are
Now, more recently, over last week, the top performing Emerging Markets Index stocks on the move are


|
||||||||||||||||||||||||||||||||||||||||||||||||
| 12Stocks.com: Investing in Emerging Markets Index with Stocks | |
|
The following table helps investors and traders sort through current performance and trends (as measured by Smart Investing & Trading Score ) of various
stocks in the Emerging Markets Index. Quick View: Move mouse or cursor over stock symbol (ticker) to view short-term technical chart and over stock name to view long term chart. Click on  to add stock symbol to your watchlist and to add stock symbol to your watchlist and  to view watchlist. Click on any ticker or stock name for detailed market intelligence report for that stock. to view watchlist. Click on any ticker or stock name for detailed market intelligence report for that stock. |
12Stocks.com Performance of Stocks in Emerging Markets Index
| Ticker | Stock Name | Watchlist | Category | Recent Price | Smart Investing & Trading Score | Change % | YTD Change% |
| BQ | Boqii Holding |   | Services & Goods | 0.30 | 39 | 15.69 | -33.60% |
| HOLO | MicroCloud Hologram | | Technology | 2.67 | 43 | 13.86 | 668.35% |
| TAL | TAL Education | | Services & Goods | 13.35 | 90 | 8.89 | 5.70% |
| MOGU | MOGU | | Services & Goods | 1.93 | 93 | 8.43 | 1.05% |
| CMCM | Cheetah Mobile | | Technology | 4.29 | 88 | 8.33 | 88.16% |
| SFWL | Shengfeng Development | | Industrials | 1.54 | 17 | 7.69 | -44.00% |
| VIOT | Viomi | | Technology | 0.60 | 50 | 7.13 | -39.90% |
| SIFY | Sify | | Technology | 1.26 | 10 | 5.88 | -32.44% |
| DRD | DRDGOLD | | Materials | 8.25 | 53 | 5.50 | 3.77% |
| DUO | Fangdd Network | | Financials | 0.41 | 17 | 5.41 | -39.23% |
| SECO | Secoo Holding | | Services & Goods | 0.41 | 40 | 5.19 | -28.32% |
| OMAB | Grupo Aeroportuario | | Transports | 85.26 | 85 | 5.18 | 0.74% |
| VNET | 21Vianet | | Technology | 1.66 | 42 | 5.06 | -42.16% |
| RGC | Regencell Bioscience | | Health Care | 5.35 | 24 | 4.90 | -49.05% |
| YQ | 17 Education | | Consumer Staples | 2.75 | 80 | 4.76 | 34.80% |
| AFYA | Afya | | Services & Goods | 17.40 | 34 | 4.69 | -20.66% |
| RDY | Dr. Reddy | | Health Care | 74.02 | 22 | 4.37 | 6.38% |
| CANG | Cango | | Technology | 1.44 | 49 | 4.35 | 41.18% |
| EH | EHang | | Industrials | 18.20 | 68 | 4.12 | 8.33% |
| YSG | Yatsen Holding | | Services & Goods | 4.41 | 100 | 4.01 | 502.79% |
| EDTK | Skillful Craftsman | | Consumer Staples | 0.96 | 32 | 3.44 | -23.81% |
| HMY | Harmony Gold | | Materials | 9.03 | 51 | 3.32 | 46.83% |
| EDU | New Oriental | | Services & Goods | 79.64 | 26 | 3.32 | 8.68% |
| BZ | Kanzhun | | Industrials | 19.60 | 100 | 3.29 | 18.61% |
| KOF | Coca-Cola FEMSA | | Consumer Staples | 98.67 | 70 | 3.22 | 4.26% |
| For chart view version of above stock list: Chart View ➞ 0 - 25 , 25 - 50 , 50 - 75 , 75 - 100 , 100 - 125 , 125 - 150 , 150 - 175 , 175 - 200 | ||
 | Click To Change The Sort Order: By Market Cap or Company Size Performance: Year-to-date, Week and Day |  |
|
Get the most comprehensive stock market coverage daily at 12Stocks.com ➞ Best Stocks Today ➞ Best Stocks Weekly ➞ Best Stocks Year-to-Date ➞ Best Stocks Trends ➞  Best Stocks Today 12Stocks.com Best Nasdaq Stocks ➞ Best S&P 500 Stocks ➞ Best Tech Stocks ➞ Best Biotech Stocks ➞ |
| Detailed Overview of Emerging Markets Stocks |
| Emerging Markets Technical Overview, Leaders & Laggards, Top Emerging Markets ETF Funds & Detailed Emerging Markets Stocks List, Charts, Trends & More |
| Emerging Markets: Technical Analysis, Trends & YTD Performance | |
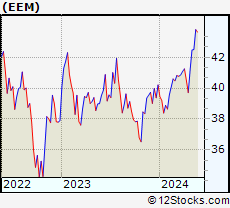
 EEM Weekly Chart |
|
| Long Term Trend: Very Good | |
| Medium Term Trend: Not Good | |
 EEM Daily Chart |
|
| Short Term Trend: Very Good | |
| Overall Trend Score: 61 | |
| YTD Performance: 1.22% | |
| **Trend Scores & Views Are Only For Educational Purposes And Not For Investing | |
| 12Stocks.com: Investing in Emerging Markets Index using Exchange Traded Funds | |
|
The following table shows list of key exchange traded funds (ETF) that
help investors play Emerging Markets stock market. For detailed view, check out our ETF Funds section of our website. Quick View: Move mouse or cursor over ETF symbol (ticker) to view short-term technical chart and over ETF name to view long term chart. Click on ticker or stock name for detailed view. Click on to add stock symbol to your watchlist and to view watchlist. |
12Stocks.com List of ETFs that track Emerging Markets Index
| Ticker | ETF Name | Watchlist | Recent Price | Smart Investing & Trading Score | Change % | Week % | Year-to-date % |
| EEM | Emerging Markets | | 40.70 | 61 | 0.22 | 2.49 | 1.22% |
| VWO | Emerging Markets | | 41.84 | 68 | 0.31 | 2.32 | 1.8% |
| SCHE | Emerging Markets Equity | | 25.28 | 73 | 0.32 | 2.39 | 1.98% |
| EWX | Emerging Markets Small | | 56.03 | 50 | 0.41 | 1.56 | -0.76% |
| EET | Emerging Markets | | 49.93 | 68 | 0.06 | 4.64 | -1.83% |
| EDC | Emrg Mkts Bull | | 29.05 | 56 | 0.48 | 7.31 | -4.53% |
| EEV | Short Emerging | | 19.53 | 32 | -0.81 | -4.81 | -0.98% |
| EUM | Short Emerging | | 14.15 | 39 | -0.07 | -2.36 | 0% |
| EDIV | Emerging Markets Dividend | | 33.41 | 50 | 0.78 | 1.21 | 2.74% |
| EMIF | Emerging Markets Infrastructure | | 21.87 | 60 | 0.00 | 2.29 | 2.2% |
| CEW | Emerging Currency Strat | | 17.66 | 48 | 0.00 | 0.31 | -1.92% |
| EBND | Em Mkts Lcl | | 19.88 | 20 | -0.20 | -0.25 | -6.4% |
| EMCB | Emerging Markets Corp | | 63.74 | 15 | 0.57 | 0.24 | -0.25% |
| VWOB | Emerging Mkts Govt | | 62.16 | 25 | -0.30 | -0.27 | -2.49% |
| EEMA | Emerging Markets Asia | | 68.17 | 68 | 0.50 | 3.15 | 3.12% |
| EELV | Em Mkts Low | | 23.31 | 31 | 0.09 | 0.65 | -3.04% |
| DVYE | Emerging Markets Dividend | | 26.60 | 81 | 0.26 | 0.45 | 0.42% |
| SDEM | SuperDividend Em Mkts | | 25.26 | 26 | -0.08 | -2.32 | 1.87% |
| DBEM | Em Mkts Hdgd | | 23.76 | 53 | 0.22 | 2.86 | 2.99% |
| PCY | Emerging Markets Sov | | 19.65 | 25 | -0.25 | -0.81 | -4.7% |
| QEMM | Emerging Mkts StratcFacts | | 57.00 | 48 | 0.43 | 1.5 | -0.27% |
| 12Stocks.com: Charts, Trends, Fundamental Data and Performances of Emerging Markets Stocks | |
|
We now take in-depth look at all Emerging Markets stocks including charts, multi-period performances and overall trends (as measured by Smart Investing & Trading Score ). One can sort Emerging Markets stocks (click link to choose) by Daily, Weekly and by Year-to-Date performances. Also, one can sort by size of the company or by market capitalization. |
| Select Your Default Chart Type: | |||||
| |||||
| Click on stock symbol or name for detailed view. Click on to add stock symbol to your watchlist and to view watchlist. Quick View: Move mouse or cursor over "Daily" to quickly view daily technical stock chart and over "Weekly" to view weekly technical stock chart. | |||||

 | BQ Boqii Holding Limited |
| Sector: Services & Goods | |
| SubSector: Specialty Retail | |
| MarketCap: 33027 Millions | |
| Recent Price: 0.30 Smart Investing & Trading Score : 39 | |
| Day Percent Change: 15.69% Day Change: 0.04 | |
| Week Change: 10.71% Year-to-date Change: -33.6% | |
| BQ Links: Profile News Message Board | |
| Charts:- Daily , Weekly | |
| Add BQ to Watchlist: View: Get Complete BQ Trend Analysis ➞ | |
 | HOLO MicroCloud Hologram Inc. |
| Sector: Technology | |
| SubSector: Electronic Components | |
| MarketCap: 159 Millions | |
| Recent Price: 2.67 Smart Investing & Trading Score : 43 | |
| Day Percent Change: 13.86% Day Change: 0.32 | |
| Week Change: -4.3% Year-to-date Change: 668.4% | |
| HOLO Links: Profile News Message Board | |
| Charts:- Daily , Weekly | |
| Add HOLO to Watchlist: View: Get Complete HOLO Trend Analysis ➞ | |
 | TAL TAL Education Group |
| Sector: Services & Goods | |
| SubSector: Education & Training Services | |
| MarketCap: 30103.1 Millions | |
| Recent Price: 13.35 Smart Investing & Trading Score : 90 | |
| Day Percent Change: 8.89% Day Change: 1.09 | |
| Week Change: 16.8% Year-to-date Change: 5.7% | |
| TAL Links: Profile News Message Board | |
| Charts:- Daily , Weekly | |
| Add TAL to Watchlist: View: Get Complete TAL Trend Analysis ➞ | |
 | MOGU MOGU Inc. |
| Sector: Services & Goods | |
| SubSector: Specialty Retail, Other | |
| MarketCap: 168.844 Millions | |
| Recent Price: 1.93 Smart Investing & Trading Score : 93 | |
| Day Percent Change: 8.43% Day Change: 0.15 | |
| Week Change: -3.02% Year-to-date Change: 1.1% | |
| MOGU Links: Profile News Message Board | |
| Charts:- Daily , Weekly | |
| Add MOGU to Watchlist: View: Get Complete MOGU Trend Analysis ➞ | |
 | CMCM Cheetah Mobile Inc. |
| Sector: Technology | |
| SubSector: Application Software | |
| MarketCap: 343.362 Millions | |
| Recent Price: 4.29 Smart Investing & Trading Score : 88 | |
| Day Percent Change: 8.33% Day Change: 0.33 | |
| Week Change: 21.19% Year-to-date Change: 88.2% | |
| CMCM Links: Profile News Message Board | |
| Charts:- Daily , Weekly | |
| Add CMCM to Watchlist: View: Get Complete CMCM Trend Analysis ➞ | |
 | SFWL Shengfeng Development Limited |
| Sector: Industrials | |
| SubSector: Integrated Freight & Logistics | |
| MarketCap: 747 Millions | |
| Recent Price: 1.54 Smart Investing & Trading Score : 17 | |
| Day Percent Change: 7.69% Day Change: 0.11 | |
| Week Change: -5.52% Year-to-date Change: -44.0% | |
| SFWL Links: Profile News Message Board | |
| Charts:- Daily , Weekly | |
| Add SFWL to Watchlist: View: Get Complete SFWL Trend Analysis ➞ | |
 | VIOT Viomi Technology Co., Ltd |
| Sector: Technology | |
| SubSector: Electronic Equipment | |
| MarketCap: 357.2 Millions | |
| Recent Price: 0.60 Smart Investing & Trading Score : 50 | |
| Day Percent Change: 7.13% Day Change: 0.04 | |
| Week Change: 10.17% Year-to-date Change: -39.9% | |
| VIOT Links: Profile News Message Board | |
| Charts:- Daily , Weekly | |
| Add VIOT to Watchlist: View: Get Complete VIOT Trend Analysis ➞ | |
 | SIFY Sify Technologies Limited |
| Sector: Technology | |
| SubSector: Internet Service Providers | |
| MarketCap: 159.38 Millions | |
| Recent Price: 1.26 Smart Investing & Trading Score : 10 | |
| Day Percent Change: 5.88% Day Change: 0.07 | |
| Week Change: 2.44% Year-to-date Change: -32.4% | |
| SIFY Links: Profile News Message Board | |
| Charts:- Daily , Weekly | |
| Add SIFY to Watchlist: View: Get Complete SIFY Trend Analysis ➞ | |
 | DRD DRDGOLD Limited |
| Sector: Materials | |
| SubSector: Gold | |
| MarketCap: 556.919 Millions | |
| Recent Price: 8.25 Smart Investing & Trading Score : 53 | |
| Day Percent Change: 5.50% Day Change: 0.43 | |
| Week Change: -3.51% Year-to-date Change: 3.8% | |
| DRD Links: Profile News Message Board | |
| Charts:- Daily , Weekly | |
| Add DRD to Watchlist: View: Get Complete DRD Trend Analysis ➞ | |
 | DUO Fangdd Network Group Ltd. |
| Sector: Financials | |
| SubSector: Property Management | |
| MarketCap: 783.142 Millions | |
| Recent Price: 0.41 Smart Investing & Trading Score : 17 | |
| Day Percent Change: 5.41% Day Change: 0.02 | |
| Week Change: 4.87% Year-to-date Change: -39.2% | |
| DUO Links: Profile News Message Board | |
| Charts:- Daily , Weekly | |
| Add DUO to Watchlist: View: Get Complete DUO Trend Analysis ➞ | |
 | SECO Secoo Holding Limited |
| Sector: Services & Goods | |
| SubSector: Specialty Retail, Other | |
| MarketCap: 209.144 Millions | |
| Recent Price: 0.41 Smart Investing & Trading Score : 40 | |
| Day Percent Change: 5.19% Day Change: 0.02 | |
| Week Change: -3.34% Year-to-date Change: -28.3% | |
| SECO Links: Profile News Message Board | |
| Charts:- Daily , Weekly | |
| Add SECO to Watchlist: View: Get Complete SECO Trend Analysis ➞ | |
 | OMAB Grupo Aeroportuario del Centro Norte, S.A.B. de C.V. |
| Sector: Transports | |
| SubSector: Air Services, Other | |
| MarketCap: 1196.38 Millions | |
| Recent Price: 85.26 Smart Investing & Trading Score : 85 | |
| Day Percent Change: 5.18% Day Change: 4.20 | |
| Week Change: 13.53% Year-to-date Change: 0.7% | |
| OMAB Links: Profile News Message Board | |
| Charts:- Daily , Weekly | |
| Add OMAB to Watchlist: View: Get Complete OMAB Trend Analysis ➞ | |
 | VNET 21Vianet Group, Inc. |
| Sector: Technology | |
| SubSector: Information Technology Services | |
| MarketCap: 1846.98 Millions | |
| Recent Price: 1.66 Smart Investing & Trading Score : 42 | |
| Day Percent Change: 5.06% Day Change: 0.08 | |
| Week Change: 11.41% Year-to-date Change: -42.2% | |
| VNET Links: Profile News Message Board | |
| Charts:- Daily , Weekly | |
| Add VNET to Watchlist: View: Get Complete VNET Trend Analysis ➞ | |
 | RGC Regencell Bioscience Holdings Limited |
| Sector: Health Care | |
| SubSector: Drug Manufacturers - Specialty & Generic | |
| MarketCap: 284 Millions | |
| Recent Price: 5.35 Smart Investing & Trading Score : 24 | |
| Day Percent Change: 4.90% Day Change: 0.25 | |
| Week Change: -3.6% Year-to-date Change: -49.1% | |
| RGC Links: Profile News Message Board | |
| Charts:- Daily , Weekly | |
| Add RGC to Watchlist: View: Get Complete RGC Trend Analysis ➞ | |
 | YQ 17 Education & Technology Group Inc. |
| Sector: Consumer Staples | |
| SubSector: Education & Training Services | |
| MarketCap: 32347 Millions | |
| Recent Price: 2.75 Smart Investing & Trading Score : 80 | |
| Day Percent Change: 4.76% Day Change: 0.13 | |
| Week Change: 11.56% Year-to-date Change: 34.8% | |
| YQ Links: Profile News Message Board | |
| Charts:- Daily , Weekly | |
| Add YQ to Watchlist: View: Get Complete YQ Trend Analysis ➞ | |
 | AFYA Afya Limited |
| Sector: Services & Goods | |
| SubSector: Education & Training Services | |
| MarketCap: 1559.26 Millions | |
| Recent Price: 17.40 Smart Investing & Trading Score : 34 | |
| Day Percent Change: 4.69% Day Change: 0.78 | |
| Week Change: 8.75% Year-to-date Change: -20.7% | |
| AFYA Links: Profile News Message Board | |
| Charts:- Daily , Weekly | |
| Add AFYA to Watchlist: View: Get Complete AFYA Trend Analysis ➞ | |
 | RDY Dr. Reddy s Laboratories Limited |
| Sector: Health Care | |
| SubSector: Drug Manufacturers - Other | |
| MarketCap: 6590.23 Millions | |
| Recent Price: 74.02 Smart Investing & Trading Score : 22 | |
| Day Percent Change: 4.37% Day Change: 3.10 | |
| Week Change: 4.05% Year-to-date Change: 6.4% | |
| RDY Links: Profile News Message Board | |
| Charts:- Daily , Weekly | |
| Add RDY to Watchlist: View: Get Complete RDY Trend Analysis ➞ | |
 | CANG Cango Inc. |
| Sector: Technology | |
| SubSector: Internet Information Providers | |
| MarketCap: 947.48 Millions | |
| Recent Price: 1.44 Smart Investing & Trading Score : 49 | |
| Day Percent Change: 4.35% Day Change: 0.06 | |
| Week Change: 2.86% Year-to-date Change: 41.2% | |
| CANG Links: Profile News Message Board | |
| Charts:- Daily , Weekly | |
| Add CANG to Watchlist: View: Get Complete CANG Trend Analysis ➞ | |
 | EH EHang Holdings Limited |
| Sector: Industrials | |
| SubSector: Aerospace/Defense Products & Services | |
| MarketCap: 513.401 Millions | |
| Recent Price: 18.20 Smart Investing & Trading Score : 68 | |
| Day Percent Change: 4.12% Day Change: 0.72 | |
| Week Change: 3.94% Year-to-date Change: 8.3% | |
| EH Links: Profile News Message Board | |
| Charts:- Daily , Weekly | |
| Add EH to Watchlist: View: Get Complete EH Trend Analysis ➞ | |
 | YSG Yatsen Holding Limited |
| Sector: Services & Goods | |
| SubSector: Specialty Retail | |
| MarketCap: 11827 Millions | |
| Recent Price: 4.41 Smart Investing & Trading Score : 100 | |
| Day Percent Change: 4.01% Day Change: 0.17 | |
| Week Change: 21.99% Year-to-date Change: 502.8% | |
| YSG Links: Profile News Message Board | |
| Charts:- Daily , Weekly | |
| Add YSG to Watchlist: View: Get Complete YSG Trend Analysis ➞ | |
 | EDTK Skillful Craftsman Education Technology Limited |
| Sector: Consumer Staples | |
| SubSector: Education & Training Services | |
| MarketCap: 32347 Millions | |
| Recent Price: 0.96 Smart Investing & Trading Score : 32 | |
| Day Percent Change: 3.44% Day Change: 0.03 | |
| Week Change: 4.92% Year-to-date Change: -23.8% | |
| EDTK Links: Profile News Message Board | |
| Charts:- Daily , Weekly | |
| Add EDTK to Watchlist: View: Get Complete EDTK Trend Analysis ➞ | |
 | HMY Harmony Gold Mining Company Limited |
| Sector: Materials | |
| SubSector: Gold | |
| MarketCap: 1371.69 Millions | |
| Recent Price: 9.03 Smart Investing & Trading Score : 51 | |
| Day Percent Change: 3.32% Day Change: 0.29 | |
| Week Change: -2.8% Year-to-date Change: 46.8% | |
| HMY Links: Profile News Message Board | |
| Charts:- Daily , Weekly | |
| Add HMY to Watchlist: View: Get Complete HMY Trend Analysis ➞ | |
 | EDU New Oriental Education & Technology Group Inc. |
| Sector: Services & Goods | |
| SubSector: Education & Training Services | |
| MarketCap: 18673.7 Millions | |
| Recent Price: 79.64 Smart Investing & Trading Score : 26 | |
| Day Percent Change: 3.32% Day Change: 2.56 | |
| Week Change: -6.29% Year-to-date Change: 8.7% | |
| EDU Links: Profile News Message Board | |
| Charts:- Daily , Weekly | |
| Add EDU to Watchlist: View: Get Complete EDU Trend Analysis ➞ | |
 | BZ Kanzhun Limited |
| Sector: Industrials | |
| SubSector: Staffing & Employment Services | |
| MarketCap: 6680 Millions | |
| Recent Price: 19.60 Smart Investing & Trading Score : 100 | |
| Day Percent Change: 3.29% Day Change: 0.63 | |
| Week Change: 9.87% Year-to-date Change: 18.6% | |
| BZ Links: Profile News Message Board | |
| Charts:- Daily , Weekly | |
| Add BZ to Watchlist: View: Get Complete BZ Trend Analysis ➞ | |
 | KOF Coca-Cola FEMSA, S.A.B. de C.V. |
| Sector: Consumer Staples | |
| SubSector: Beverages - Soft Drinks | |
| MarketCap: 2258.9 Millions | |
| Recent Price: 98.67 Smart Investing & Trading Score : 70 | |
| Day Percent Change: 3.22% Day Change: 3.08 | |
| Week Change: 5.65% Year-to-date Change: 4.3% | |
| KOF Links: Profile News Message Board | |
| Charts:- Daily , Weekly | |
| Add KOF to Watchlist: View: Get Complete KOF Trend Analysis ➞ | |
| For tabular summary view of above stock list: Summary View ➞ 0 - 25 , 25 - 50 , 50 - 75 , 75 - 100 , 100 - 125 , 125 - 150 , 150 - 175 , 175 - 200 | ||
| Click To Change The Sort Order: By Market Cap or Company Size Performance: Year-to-date, Week and Day | |
| Select Chart Type: | ||
|
Best Stocks Today 12Stocks.com |
© 2024 12Stocks.com Terms & Conditions Privacy Contact Us
All Information Provided Only For Education And Not To Be Used For Investing or Trading. See Terms & Conditions


One More Thing ... Get Best Stocks Delivered Daily!
Never Ever Miss A Move With Our Top Ten Stocks Lists
Find Best Stocks In Any Market - Bull or Bear Market
Take A Peek At Our Top Ten Stocks Lists: Daily, Weekly, Year-to-Date & Top Trends
Find Best Stocks In Any Market - Bull or Bear Market
Take A Peek At Our Top Ten Stocks Lists: Daily, Weekly, Year-to-Date & Top Trends
Emerging Markets Stocks With Best Up Trends [0-bearish to 100-bullish]: Yatsen Holding[100], Kanzhun [100], Grupo Aeroportuario[100], JD.com [100], Dada Nexus[100], ZTO Express[100], Alibaba [100], Baozun [95], MOGU [93], Full Truck[93], MINISO [93]
Best Emerging Markets Stocks Year-to-Date:
U Power[2852.01%], DouYu [791.58%], MicroCloud Hologram[668.35%], China Liberal[520.81%], Yatsen Holding[502.79%], Zhongchao [312.22%], Uxin [172.47%], QuantaSing [103.7%], GigaCloud [97.54%], Cheetah Mobile[88.16%], Yiren Digital[61.54%] Best Emerging Markets Stocks This Week:
WiMi Hologram[33.51%], Yatsen Holding[21.99%], Cheetah Mobile[21.19%], iQIYI [17.99%], Aesthetic Medical[17.77%], TAL Education[16.8%], Golden Heaven[15.91%], Grupo Aeroportuario[15.25%], Hutchison China[15.16%], BeiGene [14.7%], Bilibili [14.67%] Best Emerging Markets Stocks Daily:
Boqii Holding[15.69%], MicroCloud Hologram[13.86%], TAL Education[8.89%], MOGU [8.43%], Cheetah Mobile[8.33%], Shengfeng Development[7.69%], Viomi [7.13%], Sify [5.88%], DRDGOLD [5.50%], Fangdd Network[5.41%], Secoo Holding[5.19%]