
 Login Sign Up


| |||||
 |  | ||||

| 12Stocks.com Market Intelligence |
Best Emerging Markets Stocks
| In a hurry? Emerging Markets Stocks Lists: Trends Table, Stock Charts
Sort Emerging Markets stocks: Daily, Weekly, Year-to-Date, Market Cap & Trends. Filter Emerging Markets stocks list by sector: Show all, Tech, Finance, Energy, Staples, Retail, Industrial, Materials, Utilities and HealthCare Filter Emerging Markets stocks list by size:All Large Medium Small |
| 12Stocks.com Emerging Markets Stocks Performances & Trends Daily | |||||||||
|
|  The overall Smart Investing & Trading Score is 76 (0-bearish to 100-bullish) which puts Emerging Markets index in short term neutral to bullish trend. The Smart Investing & Trading Score from previous trading session is 100 and a deterioration of trend continues.
| ||||||||
Here are the Smart Investing & Trading Scores of the most requested Emerging Markets stocks at 12Stocks.com (click stock name for detailed review):
|


| 12Stocks.com: Top Performing Emerging Markets Index Stocks | ||||||||||||||||||||||||||||||||||||||||||||||||
 The top performing Emerging Markets Index stocks year to date are
Now, more recently, over last week, the top performing Emerging Markets Index stocks on the move are


|
||||||||||||||||||||||||||||||||||||||||||||||||
| 12Stocks.com: Investing in Emerging Markets Index with Stocks | |
|
The following table helps investors and traders sort through current performance and trends (as measured by Smart Investing & Trading Score ) of various
stocks in the Emerging Markets Index. Quick View: Move mouse or cursor over stock symbol (ticker) to view short-term technical chart and over stock name to view long term chart. Click on  to add stock symbol to your watchlist and to add stock symbol to your watchlist and  to view watchlist. Click on any ticker or stock name for detailed market intelligence report for that stock. to view watchlist. Click on any ticker or stock name for detailed market intelligence report for that stock. |
12Stocks.com Performance of Stocks in Emerging Markets Index
| Ticker | Stock Name | Watchlist | Category | Recent Price | Smart Investing & Trading Score | Change % | YTD Change% |
| LX | LexinFintech |   | Financials | 1.85 | 83 | -0.27 | 0.54% |
| NTES | NetEase | | Technology | 96.66 | 32 | -0.28 | 3.76% |
| JFIN | Jiayin | | Technology | 6.85 | 93 | -0.29 | 32.24% |
| SUZ | Suzano S.A | | Consumer Staples | 10.36 | 0 | -0.29 | -8.80% |
| HIMX | Himax | | Technology | 5.21 | 74 | -0.29 | -14.25% |
| TV | Grupo Televisa | | Services & Goods | 3.25 | 100 | -0.31 | -2.69% |
| BBD | Banco Bradesco | | Financials | 2.71 | 32 | -0.37 | -22.57% |
| FMX | Fomento Economico | | Consumer Staples | 119.39 | 42 | -0.44 | -8.41% |
| SIMO | Silicon Motion | | Technology | 78.86 | 93 | -0.47 | 28.72% |
| FENG | Phoenix New | | Technology | 2.09 | 63 | -0.48 | 53.68% |
| SOHU | Sohu.com | | Technology | 11.49 | 58 | -0.52 | 15.71% |
| JD | JD.com | | Technology | 31.95 | 68 | -0.54 | 10.61% |
| TUYA | Tuya | | Technology | 1.80 | 32 | -0.55 | -21.57% |
| IH | iHuman | | Consumer Staples | 1.76 | 54 | -0.56 | -42.30% |
| HOLI | Hollysys Automation | | Industrials | 23.52 | 18 | -0.57 | -10.76% |
| BZ | Kanzhun | | Industrials | 20.05 | 58 | -0.57 | 21.30% |
| CNF | CNFinance | | Financials | 1.66 | 0 | -0.60 | -25.23% |
| ZTO | ZTO Express | | Transports | 20.42 | 51 | -0.63 | -4.04% |
| CX | CEMEX S.A.B. | | Industrials | 7.76 | 36 | -0.64 | 0.13% |
| IBN | ICICI Bank | | Financials | 26.94 | 46 | -0.66 | 13.00% |
| TME | Tencent Music | | Technology | 13.25 | 63 | -0.67 | 47.06% |
| ZLAB | Zai Lab | | Health Care | 16.56 | 57 | -0.69 | -39.43% |
| SID | Companhia Siderurgica | | Materials | 2.75 | 17 | -0.72 | -30.03% |
| WIT | Wipro | | Technology | 5.45 | 57 | -0.73 | -2.15% |
| HTHT | Huazhu | | Services & Goods | 39.87 | 58 | -0.75 | 19.23% |
| For chart view version of above stock list: Chart View ➞ 0 - 25 , 25 - 50 , 50 - 75 , 75 - 100 , 100 - 125 , 125 - 150 , 150 - 175 , 175 - 200 | ||
 | Click To Change The Sort Order: By Market Cap or Company Size Performance: Year-to-date, Week and Day |  |
|
Get the most comprehensive stock market coverage daily at 12Stocks.com ➞ Best Stocks Today ➞ Best Stocks Weekly ➞ Best Stocks Year-to-Date ➞ Best Stocks Trends ➞  Best Stocks Today 12Stocks.com Best Nasdaq Stocks ➞ Best S&P 500 Stocks ➞ Best Tech Stocks ➞ Best Biotech Stocks ➞ |
| Detailed Overview of Emerging Markets Stocks |
| Emerging Markets Technical Overview, Leaders & Laggards, Top Emerging Markets ETF Funds & Detailed Emerging Markets Stocks List, Charts, Trends & More |
| Emerging Markets: Technical Analysis, Trends & YTD Performance | |
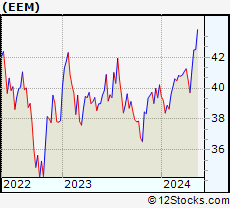
 EEM Weekly Chart |
|
| Long Term Trend: Very Good | |
| Medium Term Trend: Very Good | |
 EEM Daily Chart |
|
| Short Term Trend: Not Good | |
| Overall Trend Score: 76 | |
| YTD Performance: 5.15% | |
| **Trend Scores & Views Are Only For Educational Purposes And Not For Investing | |
| 12Stocks.com: Investing in Emerging Markets Index using Exchange Traded Funds | |
|
The following table shows list of key exchange traded funds (ETF) that
help investors play Emerging Markets stock market. For detailed view, check out our ETF Funds section of our website. Quick View: Move mouse or cursor over ETF symbol (ticker) to view short-term technical chart and over ETF name to view long term chart. Click on ticker or stock name for detailed view. Click on to add stock symbol to your watchlist and to view watchlist. |
12Stocks.com List of ETFs that track Emerging Markets Index
| Ticker | ETF Name | Watchlist | Recent Price | Smart Investing & Trading Score | Change % | Week % | Year-to-date % |
| EEM | Emerging Markets | | 42.28 | 76 | 0.02 | -0.45 | 5.15% |
| VWO | Emerging Markets | | 43.20 | 68 | -0.09 | -0.99 | 5.11% |
| SCHE | Emerging Markets Equity | | 26.12 | 61 | -0.04 | -0.87 | 5.37% |
| EWX | Emerging Markets Small | | 57.53 | 68 | -0.21 | -1.12 | 1.9% |
| EET | Emerging Markets | | 53.80 | 68 | 0.01 | -1.08 | 5.77% |
| EDC | Emrg Mkts Bull | | 32.26 | 68 | -0.15 | -1.8 | 6.01% |
| EEV | Short Emerging | | 18.14 | 25 | 0.01 | 0.23 | -8.02% |
| EUM | Short Emerging | | 13.66 | 32 | 0.22 | 0.7 | -3.46% |
| EDIV | Emerging Markets Dividend | | 34.54 | 71 | 0.17 | 0.35 | 6.21% |
| EMIF | Emerging Markets Infrastructure | | 22.59 | 88 | -0.28 | 0.65 | 5.54% |
| CEW | Emerging Currency Strat | | 17.87 | 73 | 0.06 | -0.06 | -0.75% |
| EBND | Em Mkts Lcl | | 20.17 | 33 | -0.20 | -0.15 | -5.04% |
| EMCB | Emerging Markets Corp | | 64.22 | 63 | -0.47 | 0.04 | 0.51% |
| VWOB | Emerging Mkts Govt | | 63.07 | 63 | -0.36 | 0.13 | -1.07% |
| EEMA | Emerging Markets Asia | | 70.36 | 68 | -0.35 | -1.04 | 6.43% |
| EELV | Em Mkts Low | | 24.04 | 63 | 0.08 | -0.25 | 0% |
| DVYE | Emerging Markets Dividend | | 28.02 | 76 | -0.16 | 0.23 | 5.76% |
| SDEM | SuperDividend Em Mkts | | 26.10 | 58 | -0.11 | 0.29 | 5.25% |
| DBEM | Em Mkts Hdgd | | 24.41 | 76 | 0.02 | -0.35 | 5.83% |
| PCY | Emerging Markets Sov | | 20.16 | 63 | -0.42 | 0.17 | -2.21% |
| QEMM | Emerging Mkts StratcFacts | | 58.75 | 76 | -0.05 | -0.05 | 2.79% |
| 12Stocks.com: Charts, Trends, Fundamental Data and Performances of Emerging Markets Stocks | |
|
We now take in-depth look at all Emerging Markets stocks including charts, multi-period performances and overall trends (as measured by Smart Investing & Trading Score ). One can sort Emerging Markets stocks (click link to choose) by Daily, Weekly and by Year-to-Date performances. Also, one can sort by size of the company or by market capitalization. |
| Select Your Default Chart Type: | |||||
| |||||
| Click on stock symbol or name for detailed view. Click on to add stock symbol to your watchlist and to view watchlist. Quick View: Move mouse or cursor over "Daily" to quickly view daily technical stock chart and over "Weekly" to view weekly technical stock chart. | |||||

 | LX LexinFintech Holdings Ltd. |
| Sector: Financials | |
| SubSector: Credit Services | |
| MarketCap: 1674.18 Millions | |
| Recent Price: 1.85 Smart Investing & Trading Score : 83 | |
| Day Percent Change: -0.27% Day Change: 0.00 | |
| Week Change: 1.65% Year-to-date Change: 0.5% | |
| LX Links: Profile News Message Board | |
| Charts:- Daily , Weekly | |
| Add LX to Watchlist: View: Get Complete LX Trend Analysis ➞ | |
 | NTES NetEase, Inc. |
| Sector: Technology | |
| SubSector: Internet Software & Services | |
| MarketCap: 40105.1 Millions | |
| Recent Price: 96.66 Smart Investing & Trading Score : 32 | |
| Day Percent Change: -0.28% Day Change: -0.27 | |
| Week Change: -6.17% Year-to-date Change: 3.8% | |
| NTES Links: Profile News Message Board | |
| Charts:- Daily , Weekly | |
| Add NTES to Watchlist: View: Get Complete NTES Trend Analysis ➞ | |
 | JFIN Jiayin Group Inc. |
| Sector: Technology | |
| SubSector: Internet Information Providers | |
| MarketCap: 131.48 Millions | |
| Recent Price: 6.85 Smart Investing & Trading Score : 93 | |
| Day Percent Change: -0.29% Day Change: -0.02 | |
| Week Change: 8.21% Year-to-date Change: 32.2% | |
| JFIN Links: Profile News Message Board | |
| Charts:- Daily , Weekly | |
| Add JFIN to Watchlist: View: Get Complete JFIN Trend Analysis ➞ | |
 | SUZ Suzano S.A. |
| Sector: Consumer Staples | |
| SubSector: Paper & Paper Products | |
| MarketCap: 7042.93 Millions | |
| Recent Price: 10.36 Smart Investing & Trading Score : 0 | |
| Day Percent Change: -0.29% Day Change: -0.03 | |
| Week Change: -11.15% Year-to-date Change: -8.8% | |
| SUZ Links: Profile News Message Board | |
| Charts:- Daily , Weekly | |
| Add SUZ to Watchlist: View: Get Complete SUZ Trend Analysis ➞ | |
 | HIMX Himax Technologies, Inc. |
| Sector: Technology | |
| SubSector: Semiconductor - Specialized | |
| MarketCap: 496.16 Millions | |
| Recent Price: 5.21 Smart Investing & Trading Score : 74 | |
| Day Percent Change: -0.29% Day Change: -0.01 | |
| Week Change: 0.87% Year-to-date Change: -14.3% | |
| HIMX Links: Profile News Message Board | |
| Charts:- Daily , Weekly | |
| Add HIMX to Watchlist: View: Get Complete HIMX Trend Analysis ➞ | |
 | TV Grupo Televisa, S.A.B. |
| Sector: Services & Goods | |
| SubSector: Broadcasting - TV | |
| MarketCap: 3740.43 Millions | |
| Recent Price: 3.25 Smart Investing & Trading Score : 100 | |
| Day Percent Change: -0.31% Day Change: -0.01 | |
| Week Change: 2.52% Year-to-date Change: -2.7% | |
| TV Links: Profile News Message Board | |
| Charts:- Daily , Weekly | |
| Add TV to Watchlist: View: Get Complete TV Trend Analysis ➞ | |
 | BBD Banco Bradesco S.A. |
| Sector: Financials | |
| SubSector: Foreign Regional Banks | |
| MarketCap: 30281.7 Millions | |
| Recent Price: 2.71 Smart Investing & Trading Score : 32 | |
| Day Percent Change: -0.37% Day Change: -0.01 | |
| Week Change: -0.37% Year-to-date Change: -22.6% | |
| BBD Links: Profile News Message Board | |
| Charts:- Daily , Weekly | |
| Add BBD to Watchlist: View: Get Complete BBD Trend Analysis ➞ | |
 | FMX Fomento Economico Mexicano, S.A.B. de C.V. |
| Sector: Consumer Staples | |
| SubSector: Beverages - Brewers | |
| MarketCap: 22018.7 Millions | |
| Recent Price: 119.39 Smart Investing & Trading Score : 42 | |
| Day Percent Change: -0.44% Day Change: -0.53 | |
| Week Change: 0.6% Year-to-date Change: -8.4% | |
| FMX Links: Profile News Message Board | |
| Charts:- Daily , Weekly | |
| Add FMX to Watchlist: View: Get Complete FMX Trend Analysis ➞ | |
 | SIMO Silicon Motion Technology Corporation |
| Sector: Technology | |
| SubSector: Diversified Electronics | |
| MarketCap: 1186.66 Millions | |
| Recent Price: 78.86 Smart Investing & Trading Score : 93 | |
| Day Percent Change: -0.47% Day Change: -0.38 | |
| Week Change: 6.64% Year-to-date Change: 28.7% | |
| SIMO Links: Profile News Message Board | |
| Charts:- Daily , Weekly | |
| Add SIMO to Watchlist: View: Get Complete SIMO Trend Analysis ➞ | |
 | FENG Phoenix New Media Limited |
| Sector: Technology | |
| SubSector: Internet Information Providers | |
| MarketCap: 107.08 Millions | |
| Recent Price: 2.09 Smart Investing & Trading Score : 63 | |
| Day Percent Change: -0.48% Day Change: -0.01 | |
| Week Change: -0.95% Year-to-date Change: 53.7% | |
| FENG Links: Profile News Message Board | |
| Charts:- Daily , Weekly | |
| Add FENG to Watchlist: View: Get Complete FENG Trend Analysis ➞ | |
 | SOHU Sohu.com Limited |
| Sector: Technology | |
| SubSector: Internet Information Providers | |
| MarketCap: 243.48 Millions | |
| Recent Price: 11.49 Smart Investing & Trading Score : 58 | |
| Day Percent Change: -0.52% Day Change: -0.06 | |
| Week Change: -3.93% Year-to-date Change: 15.7% | |
| SOHU Links: Profile News Message Board | |
| Charts:- Daily , Weekly | |
| Add SOHU to Watchlist: View: Get Complete SOHU Trend Analysis ➞ | |
 | JD JD.com, Inc. |
| Sector: Technology | |
| SubSector: Internet Information Providers | |
| MarketCap: 59907.3 Millions | |
| Recent Price: 31.95 Smart Investing & Trading Score : 68 | |
| Day Percent Change: -0.54% Day Change: -0.18 | |
| Week Change: -2.78% Year-to-date Change: 10.6% | |
| JD Links: Profile News Message Board | |
| Charts:- Daily , Weekly | |
| Add JD to Watchlist: View: Get Complete JD Trend Analysis ➞ | |
 | TUYA Tuya Inc. |
| Sector: Technology | |
| SubSector: Software - Infrastructure | |
| MarketCap: 1050 Millions | |
| Recent Price: 1.80 Smart Investing & Trading Score : 32 | |
| Day Percent Change: -0.55% Day Change: -0.01 | |
| Week Change: -1.1% Year-to-date Change: -21.6% | |
| TUYA Links: Profile News Message Board | |
| Charts:- Daily , Weekly | |
| Add TUYA to Watchlist: View: Get Complete TUYA Trend Analysis ➞ | |
 | IH iHuman Inc. |
| Sector: Consumer Staples | |
| SubSector: Education & Training Services | |
| MarketCap: 12247 Millions | |
| Recent Price: 1.76 Smart Investing & Trading Score : 54 | |
| Day Percent Change: -0.56% Day Change: -0.01 | |
| Week Change: 1.15% Year-to-date Change: -42.3% | |
| IH Links: Profile News Message Board | |
| Charts:- Daily , Weekly | |
| Add IH to Watchlist: View: Get Complete IH Trend Analysis ➞ | |
 | HOLI Hollysys Automation Technologies Ltd. |
| Sector: Industrials | |
| SubSector: Industrial Electrical Equipment | |
| MarketCap: 668.379 Millions | |
| Recent Price: 23.52 Smart Investing & Trading Score : 18 | |
| Day Percent Change: -0.57% Day Change: -0.13 | |
| Week Change: -0.49% Year-to-date Change: -10.8% | |
| HOLI Links: Profile News Message Board | |
| Charts:- Daily , Weekly | |
| Add HOLI to Watchlist: View: Get Complete HOLI Trend Analysis ➞ | |
 | BZ Kanzhun Limited |
| Sector: Industrials | |
| SubSector: Staffing & Employment Services | |
| MarketCap: 6680 Millions | |
| Recent Price: 20.05 Smart Investing & Trading Score : 58 | |
| Day Percent Change: -0.57% Day Change: -0.11 | |
| Week Change: -1.72% Year-to-date Change: 21.3% | |
| BZ Links: Profile News Message Board | |
| Charts:- Daily , Weekly | |
| Add BZ to Watchlist: View: Get Complete BZ Trend Analysis ➞ | |
 | CNF CNFinance Holdings Limited |
| Sector: Financials | |
| SubSector: Credit Services | |
| MarketCap: 277.408 Millions | |
| Recent Price: 1.66 Smart Investing & Trading Score : 0 | |
| Day Percent Change: -0.60% Day Change: -0.01 | |
| Week Change: -6.74% Year-to-date Change: -25.2% | |
| CNF Links: Profile News Message Board | |
| Charts:- Daily , Weekly | |
| Add CNF to Watchlist: View: Get Complete CNF Trend Analysis ➞ | |
 | ZTO ZTO Express (Cayman) Inc. |
| Sector: Transports | |
| SubSector: Air Delivery & Freight Services | |
| MarketCap: 20507 Millions | |
| Recent Price: 20.42 Smart Investing & Trading Score : 51 | |
| Day Percent Change: -0.63% Day Change: -0.13 | |
| Week Change: -4.93% Year-to-date Change: -4.0% | |
| ZTO Links: Profile News Message Board | |
| Charts:- Daily , Weekly | |
| Add ZTO to Watchlist: View: Get Complete ZTO Trend Analysis ➞ | |
 | CX CEMEX, S.A.B. de C.V. |
| Sector: Industrials | |
| SubSector: Cement | |
| MarketCap: 2948.23 Millions | |
| Recent Price: 7.76 Smart Investing & Trading Score : 36 | |
| Day Percent Change: -0.64% Day Change: -0.05 | |
| Week Change: -3% Year-to-date Change: 0.1% | |
| CX Links: Profile News Message Board | |
| Charts:- Daily , Weekly | |
| Add CX to Watchlist: View: Get Complete CX Trend Analysis ➞ | |
 | IBN ICICI Bank Limited |
| Sector: Financials | |
| SubSector: Money Center Banks | |
| MarketCap: 31194.1 Millions | |
| Recent Price: 26.94 Smart Investing & Trading Score : 46 | |
| Day Percent Change: -0.66% Day Change: -0.18 | |
| Week Change: -1.46% Year-to-date Change: 13.0% | |
| IBN Links: Profile News Message Board | |
| Charts:- Daily , Weekly | |
| Add IBN to Watchlist: View: Get Complete IBN Trend Analysis ➞ | |
 | TME Tencent Music Entertainment Group |
| Sector: Technology | |
| SubSector: Internet Information Providers | |
| MarketCap: 16195 Millions | |
| Recent Price: 13.25 Smart Investing & Trading Score : 63 | |
| Day Percent Change: -0.67% Day Change: -0.09 | |
| Week Change: -1.85% Year-to-date Change: 47.1% | |
| TME Links: Profile News Message Board | |
| Charts:- Daily , Weekly | |
| Add TME to Watchlist: View: Get Complete TME Trend Analysis ➞ | |
 | ZLAB Zai Lab Limited |
| Sector: Health Care | |
| SubSector: Biotechnology | |
| MarketCap: 3970.35 Millions | |
| Recent Price: 16.56 Smart Investing & Trading Score : 57 | |
| Day Percent Change: -0.69% Day Change: -0.12 | |
| Week Change: 1.88% Year-to-date Change: -39.4% | |
| ZLAB Links: Profile News Message Board | |
| Charts:- Daily , Weekly | |
| Add ZLAB to Watchlist: View: Get Complete ZLAB Trend Analysis ➞ | |
 | SID Companhia Siderurgica Nacional |
| Sector: Materials | |
| SubSector: Steel & Iron | |
| MarketCap: 2087.58 Millions | |
| Recent Price: 2.75 Smart Investing & Trading Score : 17 | |
| Day Percent Change: -0.72% Day Change: -0.02 | |
| Week Change: -2.83% Year-to-date Change: -30.0% | |
| SID Links: Profile News Message Board | |
| Charts:- Daily , Weekly | |
| Add SID to Watchlist: View: Get Complete SID Trend Analysis ➞ | |
 | WIT Wipro Limited |
| Sector: Technology | |
| SubSector: Information Technology Services | |
| MarketCap: 15101.3 Millions | |
| Recent Price: 5.45 Smart Investing & Trading Score : 57 | |
| Day Percent Change: -0.73% Day Change: -0.04 | |
| Week Change: 0.93% Year-to-date Change: -2.2% | |
| WIT Links: Profile News Message Board | |
| Charts:- Daily , Weekly | |
| Add WIT to Watchlist: View: Get Complete WIT Trend Analysis ➞ | |
 | HTHT Huazhu Group Limited |
| Sector: Services & Goods | |
| SubSector: Lodging | |
| MarketCap: 9164.46 Millions | |
| Recent Price: 39.87 Smart Investing & Trading Score : 58 | |
| Day Percent Change: -0.75% Day Change: -0.30 | |
| Week Change: -2.71% Year-to-date Change: 19.2% | |
| HTHT Links: Profile News Message Board | |
| Charts:- Daily , Weekly | |
| Add HTHT to Watchlist: View: Get Complete HTHT Trend Analysis ➞ | |
| For tabular summary view of above stock list: Summary View ➞ 0 - 25 , 25 - 50 , 50 - 75 , 75 - 100 , 100 - 125 , 125 - 150 , 150 - 175 , 175 - 200 | ||
| Click To Change The Sort Order: By Market Cap or Company Size Performance: Year-to-date, Week and Day | |
| Select Chart Type: | ||
|
Best Stocks Today 12Stocks.com |
© 2024 12Stocks.com Terms & Conditions Privacy Contact Us
All Information Provided Only For Education And Not To Be Used For Investing or Trading. See Terms & Conditions


One More Thing ... Get Best Stocks Delivered Daily!
Never Ever Miss A Move With Our Top Ten Stocks Lists
Find Best Stocks In Any Market - Bull or Bear Market
Take A Peek At Our Top Ten Stocks Lists: Daily, Weekly, Year-to-Date & Top Trends
Find Best Stocks In Any Market - Bull or Bear Market
Take A Peek At Our Top Ten Stocks Lists: Daily, Weekly, Year-to-Date & Top Trends
Emerging Markets Stocks With Best Up Trends [0-bearish to 100-bullish]: BRF S.A[100], Hesai [100], Boqii Holding[100], Autohome [100], Melco Resorts[100], Taiwan Semiconductor[100], Noah [100], Chunghwa Telecom[100], Grupo Televisa[100], Vi Partners[95], Dingdong (Cayman)[95]
Best Emerging Markets Stocks Year-to-Date:
U Power[3100.33%], DouYu [925.26%], China Liberal[554.36%], Yatsen Holding[493.22%], MicroCloud Hologram[455.4%], Zhongchao [297.15%], Uxin [235.24%], GigaCloud [113.84%], Smart Share[89.3%], QuantaSing [88.27%], Cheetah Mobile[76.32%] Best Emerging Markets Stocks This Week:
Uxin [16.34%], Boqii Holding[14.64%], ATRenew [13.92%], Regencell Bioscience[12.2%], Smart Share[12.06%], BRF S.A[11.71%], Gogoro [9.09%], MOGU [8.74%], GigaCloud [8.49%], Melco Resorts[8.29%], Huize Holding[7.46%] Best Emerging Markets Stocks Daily:
Hywin [11.14%], Uxin [10.85%], BRF S.A[10.71%], 36Kr [9.82%], MOGU [8.74%], Aurora Mobile[7.46%], Hesai [6.76%], Boqii Holding[6.36%], Huize Holding[6.04%], Xiao-I [5.79%], Autohome [5.37%]