
 Login Sign Up


| |||||
 |  | ||||

| 12Stocks.com Market Intelligence |
Best Emerging Markets Stocks
| In a hurry? Emerging Markets Stocks Lists: Trends Table, Stock Charts
Sort Emerging Markets stocks: Daily, Weekly, Year-to-Date, Market Cap & Trends. Filter Emerging Markets stocks list by sector: Show all, Tech, Finance, Energy, Staples, Retail, Industrial, Materials, Utilities and HealthCare Filter Emerging Markets stocks list by size:All Large Medium Small |
| 12Stocks.com Emerging Markets Stocks Performances & Trends Daily | |||||||||
|
|  The overall Smart Investing & Trading Score is 68 (0-bearish to 100-bullish) which puts Emerging Markets index in short term neutral to bullish trend. The Smart Investing & Trading Score from previous trading session is 63 and hence an improvement of trend.
| ||||||||
Here are the Smart Investing & Trading Scores of the most requested Emerging Markets stocks at 12Stocks.com (click stock name for detailed review):
|


| 12Stocks.com: Top Performing Emerging Markets Index Stocks | ||||||||||||||||||||||||||||||||||||||||||||||||
 The top performing Emerging Markets Index stocks year to date are
Now, more recently, over last week, the top performing Emerging Markets Index stocks on the move are


|
||||||||||||||||||||||||||||||||||||||||||||||||
| 12Stocks.com: Investing in Emerging Markets Index with Stocks | |
|
The following table helps investors and traders sort through current performance and trends (as measured by Smart Investing & Trading Score ) of various
stocks in the Emerging Markets Index. Quick View: Move mouse or cursor over stock symbol (ticker) to view short-term technical chart and over stock name to view long term chart. Click on  to add stock symbol to your watchlist and to add stock symbol to your watchlist and  to view watchlist. Click on any ticker or stock name for detailed market intelligence report for that stock. to view watchlist. Click on any ticker or stock name for detailed market intelligence report for that stock. |
12Stocks.com Performance of Stocks in Emerging Markets Index
| Ticker | Stock Name | Watchlist | Category | Recent Price | Smart Investing & Trading Score | Change % | YTD Change% |
| PBR | Petroleo Brasileiro |   | Energy | 16.96 | 87 | 0.12 | 6.20% |
| CSAN | Cosan S.A | | Energy | 11.25 | 42 | 0.09 | -28.59% |
| SUZ | Suzano S.A | | Consumer Staples | 11.74 | 51 | 0.09 | 3.35% |
| VALE | Vale S.A | | Materials | 12.21 | 64 | 0.08 | -23.01% |
| SMI | Semiconductor | | Technology | 45.73 | 43 | 0.01 | -1.56% |
| HYW | Hywin | | Financials | 0.87 | 35 | 0.00 | -52.92% |
| LVRO | Lavoro | | Materials | 6.07 | 50 | 0.00 | -31.64% |
| LANV | Lanvin | | Services & Goods | 1.60 | 67 | 0.00 | -47.71% |
| WDH | Waterdrop | | Financials | 1.19 | 53 | 0.00 | 13.66% |
| VSTA | Vasta Platform | | Consumer Staples | 3.80 | 35 | 0.00 | -13.64% |
| MOGU | MOGU | | Services & Goods | 2.08 | 93 | 0.00 | 8.90% |
| NIU | Niu | | Consumer Staples | 2.06 | 83 | 0.00 | -5.94% |
| IMAB | I Mab | | Health Care | 1.80 | 63 | 0.00 | -5.26% |
| ABEV | Ambev S.A | | Consumer Staples | 2.30 | 27 | 0.00 | -17.86% |
| SVA | Sinovac Biotech | | Health Care | 6.47 | 27 | 0.00 | 0.00% |
| CIG | Companhia Energetica | | Utilities | 2.47 | 61 | 0.00 | 6.47% |
| BNR | Burning Rock | | Health Care | 0.86 | 52 | -0.12 | -10.98% |
| WIT | Wipro | | Technology | 5.51 | 49 | -0.18 | -1.08% |
| VIV | Telefonica Brasil | | Technology | 9.39 | 42 | -0.21 | -14.17% |
| DRD | DRDGOLD | | Materials | 7.89 | 36 | -0.25 | -0.75% |
| GCT | GigaCloud | | Technology | 36.99 | 74 | -0.27 | 102.02% |
| HUIZ | Huize Holding | | Financials | 0.63 | 35 | -0.35 | -30.28% |
| HOLI | Hollysys Automation | | Industrials | 24.40 | 18 | -0.39 | -7.40% |
| LI | Li Auto | | Services & Goods | 24.81 | 7 | -0.40 | -33.73% |
| SIFY | Sify | | Technology | 1.19 | 10 | -0.42 | -36.19% |
| For chart view version of above stock list: Chart View ➞ 0 - 25 , 25 - 50 , 50 - 75 , 75 - 100 , 100 - 125 , 125 - 150 , 150 - 175 , 175 - 200 | ||
 | Click To Change The Sort Order: By Market Cap or Company Size Performance: Year-to-date, Week and Day |  |
|
Get the most comprehensive stock market coverage daily at 12Stocks.com ➞ Best Stocks Today ➞ Best Stocks Weekly ➞ Best Stocks Year-to-Date ➞ Best Stocks Trends ➞  Best Stocks Today 12Stocks.com Best Nasdaq Stocks ➞ Best S&P 500 Stocks ➞ Best Tech Stocks ➞ Best Biotech Stocks ➞ |
| Detailed Overview of Emerging Markets Stocks |
| Emerging Markets Technical Overview, Leaders & Laggards, Top Emerging Markets ETF Funds & Detailed Emerging Markets Stocks List, Charts, Trends & More |
| Emerging Markets: Technical Analysis, Trends & YTD Performance | |
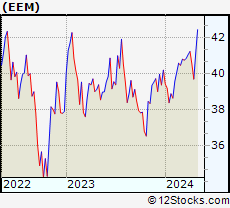
 EEM Weekly Chart |
|
| Long Term Trend: Very Good | |
| Medium Term Trend: Not Good | |
 EEM Daily Chart |
|
| Short Term Trend: Very Good | |
| Overall Trend Score: 68 | |
| YTD Performance: 0.65% | |
| **Trend Scores & Views Are Only For Educational Purposes And Not For Investing | |
| 12Stocks.com: Investing in Emerging Markets Index using Exchange Traded Funds | |
|
The following table shows list of key exchange traded funds (ETF) that
help investors play Emerging Markets stock market. For detailed view, check out our ETF Funds section of our website. Quick View: Move mouse or cursor over ETF symbol (ticker) to view short-term technical chart and over ETF name to view long term chart. Click on ticker or stock name for detailed view. Click on to add stock symbol to your watchlist and to view watchlist. |
12Stocks.com List of ETFs that track Emerging Markets Index
| Ticker | ETF Name | Watchlist | Recent Price | Smart Investing & Trading Score | Change % | Week % | Year-to-date % |
| EEM | Emerging Markets | | 40.47 | 68 | 0.82 | 1.91 | 0.65% |
| VWO | Emerging Markets | | 41.58 | 68 | 0.82 | 1.69 | 1.17% |
| SCHE | Emerging Markets Equity | | 25.10 | 68 | 0.76 | 1.66 | 1.25% |
| EWX | Emerging Markets Small | | 55.67 | 51 | 0.61 | 0.91 | -1.4% |
| EET | Emerging Markets | | 49.32 | 68 | 0.84 | 3.36 | -3.03% |
| EDC | Emrg Mkts Bull | | 28.67 | 63 | 2.47 | 5.91 | -5.78% |
| EEV | Short Emerging | | 19.76 | 32 | -1.69 | -3.69 | 0.19% |
| EUM | Short Emerging | | 14.22 | 32 | -0.82 | -1.86 | 0.51% |
| EDIV | Emerging Markets Dividend | | 33.01 | 51 | 0.12 | 0 | 1.51% |
| EMIF | Emerging Markets Infrastructure | | 21.62 | 68 | 0.23 | 1.12 | 1.03% |
| CEW | Emerging Currency Strat | | 17.61 | 38 | 0.03 | 0.06 | -2.17% |
| EBND | Em Mkts Lcl | | 20.02 | 35 | 0.40 | 0.45 | -5.74% |
| EMCB | Emerging Markets Corp | | 64.12 | 38 | 0.50 | 0.83 | 0.34% |
| VWOB | Emerging Mkts Govt | | 62.72 | 57 | 0.10 | 0.63 | -1.62% |
| EEMA | Emerging Markets Asia | | 67.48 | 75 | 1.09 | 2.11 | 2.08% |
| EELV | Em Mkts Low | | 23.46 | 45 | 0.51 | 1.31 | -2.4% |
| DVYE | Emerging Markets Dividend | | 26.56 | 81 | 0.15 | 0.3 | 0.26% |
| SDEM | SuperDividend Em Mkts | | 25.30 | 26 | -0.98 | -2.17 | 2.03% |
| DBEM | Em Mkts Hdgd | | 23.54 | 68 | 0.73 | 1.9 | 2.04% |
| PCY | Emerging Markets Sov | | 19.88 | 39 | 0.10 | 0.35 | -3.59% |
| QEMM | Emerging Mkts StratcFacts | | 56.93 | 56 | 0.90 | 1.37 | -0.39% |
| 12Stocks.com: Charts, Trends, Fundamental Data and Performances of Emerging Markets Stocks | |
|
We now take in-depth look at all Emerging Markets stocks including charts, multi-period performances and overall trends (as measured by Smart Investing & Trading Score ). One can sort Emerging Markets stocks (click link to choose) by Daily, Weekly and by Year-to-Date performances. Also, one can sort by size of the company or by market capitalization. |
| Select Your Default Chart Type: | |||||
| |||||
| Click on stock symbol or name for detailed view. Click on to add stock symbol to your watchlist and to view watchlist. Quick View: Move mouse or cursor over "Daily" to quickly view daily technical stock chart and over "Weekly" to view weekly technical stock chart. | |||||

 | PBR Petroleo Brasileiro S.A. - Petrobras |
| Sector: Energy | |
| SubSector: Oil & Gas Drilling & Exploration | |
| MarketCap: 38939.2 Millions | |
| Recent Price: 16.96 Smart Investing & Trading Score : 87 | |
| Day Percent Change: 0.12% Day Change: 0.02 | |
| Week Change: 2.98% Year-to-date Change: 6.2% | |
| PBR Links: Profile News Message Board | |
| Charts:- Daily , Weekly | |
| Add PBR to Watchlist: View: Get Complete PBR Trend Analysis ➞ | |
 | CSAN Cosan S.A. |
| Sector: Energy | |
| SubSector: Oil & Gas Refining & Marketing | |
| MarketCap: 6890 Millions | |
| Recent Price: 11.25 Smart Investing & Trading Score : 42 | |
| Day Percent Change: 0.09% Day Change: 0.01 | |
| Week Change: 1.53% Year-to-date Change: -28.6% | |
| CSAN Links: Profile News Message Board | |
| Charts:- Daily , Weekly | |
| Add CSAN to Watchlist: View: Get Complete CSAN Trend Analysis ➞ | |
 | SUZ Suzano S.A. |
| Sector: Consumer Staples | |
| SubSector: Paper & Paper Products | |
| MarketCap: 7042.93 Millions | |
| Recent Price: 11.74 Smart Investing & Trading Score : 51 | |
| Day Percent Change: 0.09% Day Change: 0.01 | |
| Week Change: -0.42% Year-to-date Change: 3.4% | |
| SUZ Links: Profile News Message Board | |
| Charts:- Daily , Weekly | |
| Add SUZ to Watchlist: View: Get Complete SUZ Trend Analysis ➞ | |
 | VALE Vale S.A. |
| Sector: Materials | |
| SubSector: Industrial Metals & Minerals | |
| MarketCap: 43601 Millions | |
| Recent Price: 12.21 Smart Investing & Trading Score : 64 | |
| Day Percent Change: 0.08% Day Change: 0.01 | |
| Week Change: 0.25% Year-to-date Change: -23.0% | |
| VALE Links: Profile News Message Board | |
| Charts:- Daily , Weekly | |
| Add VALE to Watchlist: View: Get Complete VALE Trend Analysis ➞ | |
 | SMI Semiconductor Manufacturing International Corporation |
| Sector: Technology | |
| SubSector: Semiconductor - Integrated Circuits | |
| MarketCap: 6287.56 Millions | |
| Recent Price: 45.73 Smart Investing & Trading Score : 43 | |
| Day Percent Change: 0.01% Day Change: 0.00 | |
| Week Change: 0.01% Year-to-date Change: -1.6% | |
| SMI Links: Profile News Message Board | |
| Charts:- Daily , Weekly | |
| Add SMI to Watchlist: View: Get Complete SMI Trend Analysis ➞ | |
 | HYW Hywin Holdings Ltd. |
| Sector: Financials | |
| SubSector: Asset Management | |
| MarketCap: 161 Millions | |
| Recent Price: 0.87 Smart Investing & Trading Score : 35 | |
| Day Percent Change: 0.00% Day Change: 0.00 | |
| Week Change: 8.88% Year-to-date Change: -52.9% | |
| HYW Links: Profile News Message Board | |
| Charts:- Daily , Weekly | |
| Add HYW to Watchlist: View: Get Complete HYW Trend Analysis ➞ | |
 | LVRO Lavoro Limited |
| Sector: Materials | |
| SubSector: Agricultural Inputs | |
| MarketCap: 686 Millions | |
| Recent Price: 6.07 Smart Investing & Trading Score : 50 | |
| Day Percent Change: 0.00% Day Change: 0.00 | |
| Week Change: 3.23% Year-to-date Change: -31.6% | |
| LVRO Links: Profile News Message Board | |
| Charts:- Daily , Weekly | |
| Add LVRO to Watchlist: View: Get Complete LVRO Trend Analysis ➞ | |
 | LANV Lanvin Group Holdings Limited |
| Sector: Services & Goods | |
| SubSector: Luxury Goods | |
| MarketCap: 712 Millions | |
| Recent Price: 1.60 Smart Investing & Trading Score : 67 | |
| Day Percent Change: 0.00% Day Change: 0.00 | |
| Week Change: 0.63% Year-to-date Change: -47.7% | |
| LANV Links: Profile News Message Board | |
| Charts:- Daily , Weekly | |
| Add LANV to Watchlist: View: Get Complete LANV Trend Analysis ➞ | |
 | WDH Waterdrop Inc. |
| Sector: Financials | |
| SubSector: Insurance - Diversified | |
| MarketCap: 874 Millions | |
| Recent Price: 1.19 Smart Investing & Trading Score : 53 | |
| Day Percent Change: 0.00% Day Change: 0.00 | |
| Week Change: -2.46% Year-to-date Change: 13.7% | |
| WDH Links: Profile News Message Board | |
| Charts:- Daily , Weekly | |
| Add WDH to Watchlist: View: Get Complete WDH Trend Analysis ➞ | |
 | VSTA Vasta Platform Limited |
| Sector: Consumer Staples | |
| SubSector: Education & Training Services | |
| MarketCap: 12747 Millions | |
| Recent Price: 3.80 Smart Investing & Trading Score : 35 | |
| Day Percent Change: 0.00% Day Change: 0.00 | |
| Week Change: 1.33% Year-to-date Change: -13.6% | |
| VSTA Links: Profile News Message Board | |
| Charts:- Daily , Weekly | |
| Add VSTA to Watchlist: View: Get Complete VSTA Trend Analysis ➞ | |
 | MOGU MOGU Inc. |
| Sector: Services & Goods | |
| SubSector: Specialty Retail, Other | |
| MarketCap: 168.844 Millions | |
| Recent Price: 2.08 Smart Investing & Trading Score : 93 | |
| Day Percent Change: 0.00% Day Change: 0.00 | |
| Week Change: 4.52% Year-to-date Change: 8.9% | |
| MOGU Links: Profile News Message Board | |
| Charts:- Daily , Weekly | |
| Add MOGU to Watchlist: View: Get Complete MOGU Trend Analysis ➞ | |
 | NIU Niu Technologies |
| Sector: Consumer Staples | |
| SubSector: Auto Manufacturers - Major | |
| MarketCap: 543.271 Millions | |
| Recent Price: 2.06 Smart Investing & Trading Score : 83 | |
| Day Percent Change: 0.00% Day Change: 0.00 | |
| Week Change: 6.46% Year-to-date Change: -5.9% | |
| NIU Links: Profile News Message Board | |
| Charts:- Daily , Weekly | |
| Add NIU to Watchlist: View: Get Complete NIU Trend Analysis ➞ | |
 | IMAB I Mab |
| Sector: Health Care | |
| SubSector: Biotechnology | |
| MarketCap: 26187 Millions | |
| Recent Price: 1.80 Smart Investing & Trading Score : 63 | |
| Day Percent Change: 0.00% Day Change: 0.00 | |
| Week Change: -0.55% Year-to-date Change: -5.3% | |
| IMAB Links: Profile News Message Board | |
| Charts:- Daily , Weekly | |
| Add IMAB to Watchlist: View: Get Complete IMAB Trend Analysis ➞ | |
 | ABEV Ambev S.A. |
| Sector: Consumer Staples | |
| SubSector: Beverages - Brewers | |
| MarketCap: 37753.5 Millions | |
| Recent Price: 2.30 Smart Investing & Trading Score : 27 | |
| Day Percent Change: 0.00% Day Change: 0.00 | |
| Week Change: 0.44% Year-to-date Change: -17.9% | |
| ABEV Links: Profile News Message Board | |
| Charts:- Daily , Weekly | |
| Add ABEV to Watchlist: View: Get Complete ABEV Trend Analysis ➞ | |
 | SVA Sinovac Biotech Ltd. |
| Sector: Health Care | |
| SubSector: Biotechnology | |
| MarketCap: 336.88 Millions | |
| Recent Price: 6.47 Smart Investing & Trading Score : 27 | |
| Day Percent Change: 0.00% Day Change: 0.00 | |
| Week Change: 0% Year-to-date Change: 0.0% | |
| SVA Links: Profile News Message Board | |
| Charts:- Daily , Weekly | |
| Add SVA to Watchlist: View: Get Complete SVA Trend Analysis ➞ | |
 | CIG Companhia Energetica de Minas Gerais |
| Sector: Utilities | |
| SubSector: Electric Utilities | |
| MarketCap: 3203.54 Millions | |
| Recent Price: 2.47 Smart Investing & Trading Score : 61 | |
| Day Percent Change: 0.00% Day Change: 0.00 | |
| Week Change: -0.4% Year-to-date Change: 6.5% | |
| CIG Links: Profile News Message Board | |
| Charts:- Daily , Weekly | |
| Add CIG to Watchlist: View: Get Complete CIG Trend Analysis ➞ | |
 | BNR Burning Rock Biotech Limited |
| Sector: Health Care | |
| SubSector: Diagnostics & Research | |
| MarketCap: 27887 Millions | |
| Recent Price: 0.86 Smart Investing & Trading Score : 52 | |
| Day Percent Change: -0.12% Day Change: 0.00 | |
| Week Change: 7.38% Year-to-date Change: -11.0% | |
| BNR Links: Profile News Message Board | |
| Charts:- Daily , Weekly | |
| Add BNR to Watchlist: View: Get Complete BNR Trend Analysis ➞ | |
 | WIT Wipro Limited |
| Sector: Technology | |
| SubSector: Information Technology Services | |
| MarketCap: 15101.3 Millions | |
| Recent Price: 5.51 Smart Investing & Trading Score : 49 | |
| Day Percent Change: -0.18% Day Change: -0.01 | |
| Week Change: 4.95% Year-to-date Change: -1.1% | |
| WIT Links: Profile News Message Board | |
| Charts:- Daily , Weekly | |
| Add WIT to Watchlist: View: Get Complete WIT Trend Analysis ➞ | |
 | VIV Telefonica Brasil S.A. |
| Sector: Technology | |
| SubSector: Wireless Communications | |
| MarketCap: 19611.1 Millions | |
| Recent Price: 9.39 Smart Investing & Trading Score : 42 | |
| Day Percent Change: -0.21% Day Change: -0.02 | |
| Week Change: 0.43% Year-to-date Change: -14.2% | |
| VIV Links: Profile News Message Board | |
| Charts:- Daily , Weekly | |
| Add VIV to Watchlist: View: Get Complete VIV Trend Analysis ➞ | |
 | DRD DRDGOLD Limited |
| Sector: Materials | |
| SubSector: Gold | |
| MarketCap: 556.919 Millions | |
| Recent Price: 7.89 Smart Investing & Trading Score : 36 | |
| Day Percent Change: -0.25% Day Change: -0.02 | |
| Week Change: -7.72% Year-to-date Change: -0.8% | |
| DRD Links: Profile News Message Board | |
| Charts:- Daily , Weekly | |
| Add DRD to Watchlist: View: Get Complete DRD Trend Analysis ➞ | |
 | GCT GigaCloud Technology Inc. |
| Sector: Technology | |
| SubSector: Software - Infrastructure | |
| MarketCap: 240 Millions | |
| Recent Price: 36.99 Smart Investing & Trading Score : 74 | |
| Day Percent Change: -0.27% Day Change: -0.10 | |
| Week Change: 6.63% Year-to-date Change: 102.0% | |
| GCT Links: Profile News Message Board | |
| Charts:- Daily , Weekly | |
| Add GCT to Watchlist: View: Get Complete GCT Trend Analysis ➞ | |
 | HUIZ Huize Holding Limited |
| Sector: Financials | |
| SubSector: Insurance Brokers | |
| MarketCap: 37157 Millions | |
| Recent Price: 0.63 Smart Investing & Trading Score : 35 | |
| Day Percent Change: -0.35% Day Change: 0.00 | |
| Week Change: 1.7% Year-to-date Change: -30.3% | |
| HUIZ Links: Profile News Message Board | |
| Charts:- Daily , Weekly | |
| Add HUIZ to Watchlist: View: Get Complete HUIZ Trend Analysis ➞ | |
 | HOLI Hollysys Automation Technologies Ltd. |
| Sector: Industrials | |
| SubSector: Industrial Electrical Equipment | |
| MarketCap: 668.379 Millions | |
| Recent Price: 24.40 Smart Investing & Trading Score : 18 | |
| Day Percent Change: -0.39% Day Change: -0.10 | |
| Week Change: -0.61% Year-to-date Change: -7.4% | |
| HOLI Links: Profile News Message Board | |
| Charts:- Daily , Weekly | |
| Add HOLI to Watchlist: View: Get Complete HOLI Trend Analysis ➞ | |
 | LI Li Auto Inc. |
| Sector: Services & Goods | |
| SubSector: Auto Manufacturers | |
| MarketCap: 29167 Millions | |
| Recent Price: 24.81 Smart Investing & Trading Score : 7 | |
| Day Percent Change: -0.40% Day Change: -0.10 | |
| Week Change: -8.82% Year-to-date Change: -33.7% | |
| LI Links: Profile News Message Board | |
| Charts:- Daily , Weekly | |
| Add LI to Watchlist: View: Get Complete LI Trend Analysis ➞ | |
 | SIFY Sify Technologies Limited |
| Sector: Technology | |
| SubSector: Internet Service Providers | |
| MarketCap: 159.38 Millions | |
| Recent Price: 1.19 Smart Investing & Trading Score : 10 | |
| Day Percent Change: -0.42% Day Change: -0.01 | |
| Week Change: -3.25% Year-to-date Change: -36.2% | |
| SIFY Links: Profile News Message Board | |
| Charts:- Daily , Weekly | |
| Add SIFY to Watchlist: View: Get Complete SIFY Trend Analysis ➞ | |
| For tabular summary view of above stock list: Summary View ➞ 0 - 25 , 25 - 50 , 50 - 75 , 75 - 100 , 100 - 125 , 125 - 150 , 150 - 175 , 175 - 200 | ||
| Click To Change The Sort Order: By Market Cap or Company Size Performance: Year-to-date, Week and Day | |
| Select Chart Type: | ||
|
Best Stocks Today 12Stocks.com |
© 2024 12Stocks.com Terms & Conditions Privacy Contact Us
All Information Provided Only For Education And Not To Be Used For Investing or Trading. See Terms & Conditions


One More Thing ... Get Best Stocks Delivered Daily!
Never Ever Miss A Move With Our Top Ten Stocks Lists
Find Best Stocks In Any Market - Bull or Bear Market
Take A Peek At Our Top Ten Stocks Lists: Daily, Weekly, Year-to-Date & Top Trends
Find Best Stocks In Any Market - Bull or Bear Market
Take A Peek At Our Top Ten Stocks Lists: Daily, Weekly, Year-to-Date & Top Trends
Emerging Markets Stocks With Best Up Trends [0-bearish to 100-bullish]: Grupo Aeroportuario[100], Hutchison China[100], Grupo Aeroportuario[100], iQIYI [100], Controladora Vuela[100], Xunlei [100], Tencent Music[100], MINISO [100], Full Truck[100], BRF S.A[100], JD.com [100]
Best Emerging Markets Stocks Year-to-Date:
U Power[2801.79%], DouYu [783.16%], MicroCloud Hologram[642.45%], China Liberal[498.43%], Yatsen Holding[437.18%], Zhongchao [369.73%], Uxin [136.8%], QuantaSing [105.86%], GigaCloud [102.02%], Cheetah Mobile[78.07%], Bright Scholar[64.8%] Best Emerging Markets Stocks This Week:
Cheetah Mobile[14.69%], Grupo Aeroportuario[14.29%], Pinduoduo [12.8%], iQIYI [12.12%], China Online[11.9%], Hutchison China[10.67%], Tuya [10.19%], Baozun [9.91%], Grupo Aeroportuario[9.79%], Hywin [8.88%], Controladora Vuela[8.72%] Best Emerging Markets Stocks Daily:
Golden Heaven[11.75%], Grupo Aeroportuario[11.24%], 17 Education[10.07%], China Online[9.37%], Uxin [9.21%], Ebang [9.17%], Cheetah Mobile[8.85%], Aesthetic Medical[8.02%], Zhongchao [7.86%], Hutchison China[7.73%], Grupo Aeroportuario[7.33%]