
 Login Sign Up


| |||||
 |  | ||||

| 12Stocks.com Market Intelligence |
Best Emerging Markets Stocks
| In a hurry? Emerging Markets Stocks Lists: Trends Table, Stock Charts
Sort Emerging Markets stocks: Daily, Weekly, Year-to-Date, Market Cap & Trends. Filter Emerging Markets stocks list by sector: Show all, Tech, Finance, Energy, Staples, Retail, Industrial, Materials, Utilities and HealthCare Filter Emerging Markets stocks list by size:All Large Medium Small |
| 12Stocks.com Emerging Markets Stocks Performances & Trends Daily | |||||||||
|
|  The overall Smart Investing & Trading Score is 100 (0-bearish to 100-bullish) which puts Emerging Markets index in short term bullish trend. The Smart Investing & Trading Score from previous trading session is 78 and an improvement of trend continues.
| ||||||||
Here are the Smart Investing & Trading Scores of the most requested Emerging Markets stocks at 12Stocks.com (click stock name for detailed review):
|


| 12Stocks.com: Top Performing Emerging Markets Index Stocks | ||||||||||||||||||||||||||||||||||||||||||||||||
 The top performing Emerging Markets Index stocks year to date are
Now, more recently, over last week, the top performing Emerging Markets Index stocks on the move are


|
||||||||||||||||||||||||||||||||||||||||||||||||
| 12Stocks.com: Investing in Emerging Markets Index with Stocks | |
|
The following table helps investors and traders sort through current performance and trends (as measured by Smart Investing & Trading Score ) of various
stocks in the Emerging Markets Index. Quick View: Move mouse or cursor over stock symbol (ticker) to view short-term technical chart and over stock name to view long term chart. Click on  to add stock symbol to your watchlist and to add stock symbol to your watchlist and  to view watchlist. Click on any ticker or stock name for detailed market intelligence report for that stock. to view watchlist. Click on any ticker or stock name for detailed market intelligence report for that stock. |
12Stocks.com Performance of Stocks in Emerging Markets Index
| Ticker | Stock Name | Watchlist | Category | Recent Price | Smart Investing & Trading Score | Change % | YTD Change% |
| ZTO | ZTO Express |   | Transports | 21.48 | 88 | -0.65 | 0.94% |
| YQ | 17 Education | | Consumer Staples | 2.83 | 73 | -0.70 | 38.73% |
| MNSO | MINISO | | Services & Goods | 24.02 | 100 | -0.74 | 17.75% |
| CINT | CI&T | | Technology | 3.83 | 20 | -0.78 | -28.08% |
| SIFY | Sify | | Technology | 1.21 | 30 | -0.82 | -35.12% |
| IBN | ICICI Bank | | Financials | 27.34 | 76 | -0.83 | 14.68% |
| TOUR | Tuniu | | Consumer Staples | 0.92 | 68 | -1.11 | 37.79% |
| XIN | Xinyuan Real | | Financials | 2.65 | 17 | -1.12 | -2.57% |
| OMAB | Grupo Aeroportuario | | Transports | 86.69 | 75 | -1.13 | 2.43% |
| DQ | Daqo New | | Technology | 18.91 | 20 | -1.20 | -28.91% |
| BQ | Boqii Holding | | Services & Goods | 0.32 | 95 | -1.23 | -29.14% |
| GDS | GDS | | Technology | 8.74 | 95 | -1.24 | -4.17% |
| YJ | Yunji | | Services & Goods | 0.78 | 36 | -1.27 | 9.72% |
| IMOS | ChipMOS | | Technology | 28.21 | 52 | -1.33 | 3.68% |
| JFIN | Jiayin | | Technology | 6.33 | 58 | -1.86 | 22.20% |
| QFIN | 360 Finance | | Financials | 19.50 | 95 | -1.91 | 23.26% |
| ZLAB | Zai Lab | | Health Care | 16.25 | 57 | -2.05 | -40.54% |
| HCM | Hutchison China | | Health Care | 19.15 | 83 | -2.10 | 5.74% |
| XYF | X Financial | | Financials | 3.82 | 32 | -2.30 | 4.37% |
| KC | Kingsoft Cloud | | Technology | 3.39 | 90 | -2.87 | -10.44% |
| WDH | Waterdrop | | Financials | 1.15 | 10 | -2.95 | 9.84% |
| QSG | QuantaSing | | Consumer Staples | 3.16 | 35 | -3.07 | 95.06% |
| LI | Li Auto | | Services & Goods | 27.99 | 42 | -3.42 | -25.24% |
| VIOT | Viomi | | Technology | 0.67 | 70 | -3.51 | -32.65% |
| LANV | Lanvin | | Services & Goods | 1.60 | 27 | -3.61 | -47.71% |
| For chart view version of above stock list: Chart View ➞ 0 - 25 , 25 - 50 , 50 - 75 , 75 - 100 , 100 - 125 , 125 - 150 , 150 - 175 , 175 - 200 | ||
 | Click To Change The Sort Order: By Market Cap or Company Size Performance: Year-to-date, Week and Day |  |
|
Get the most comprehensive stock market coverage daily at 12Stocks.com ➞ Best Stocks Today ➞ Best Stocks Weekly ➞ Best Stocks Year-to-Date ➞ Best Stocks Trends ➞  Best Stocks Today 12Stocks.com Best Nasdaq Stocks ➞ Best S&P 500 Stocks ➞ Best Tech Stocks ➞ Best Biotech Stocks ➞ |
| Detailed Overview of Emerging Markets Stocks |
| Emerging Markets Technical Overview, Leaders & Laggards, Top Emerging Markets ETF Funds & Detailed Emerging Markets Stocks List, Charts, Trends & More |
| Emerging Markets: Technical Analysis, Trends & YTD Performance | |
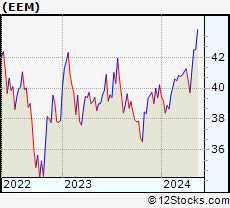
 EEM Weekly Chart |
|
| Long Term Trend: Very Good | |
| Medium Term Trend: Very Good | |
 EEM Daily Chart |
|
| Short Term Trend: Very Good | |
| Overall Trend Score: 100 | |
| YTD Performance: 5.62% | |
| **Trend Scores & Views Are Only For Educational Purposes And Not For Investing | |
| 12Stocks.com: Investing in Emerging Markets Index using Exchange Traded Funds | |
|
The following table shows list of key exchange traded funds (ETF) that
help investors play Emerging Markets stock market. For detailed view, check out our ETF Funds section of our website. Quick View: Move mouse or cursor over ETF symbol (ticker) to view short-term technical chart and over ETF name to view long term chart. Click on ticker or stock name for detailed view. Click on to add stock symbol to your watchlist and to view watchlist. |
12Stocks.com List of ETFs that track Emerging Markets Index
| Ticker | ETF Name | Watchlist | Recent Price | Smart Investing & Trading Score | Change % | Week % | Year-to-date % |
| EEM | Emerging Markets | | 42.47 | 100 | 0.90 | 3.16 | 5.62% |
| VWO | Emerging Markets | | 43.63 | 100 | 0.88 | 3.1 | 6.16% |
| SCHE | Emerging Markets Equity | | 26.35 | 100 | 0.73 | 3.05 | 6.29% |
| EWX | Emerging Markets Small | | 58.18 | 100 | 0.48 | 2.74 | 3.05% |
| EET | Emerging Markets | | 54.38 | 100 | 1.75 | 6.15 | 6.93% |
| EDC | Emrg Mkts Bull | | 32.85 | 100 | 2.82 | 9.46 | 7.95% |
| EEV | Short Emerging | | 18.10 | 0 | -0.39 | -5.85 | -8.23% |
| EUM | Short Emerging | | 13.57 | 0 | -0.84 | -3 | -4.13% |
| EDIV | Emerging Markets Dividend | | 34.42 | 95 | 0.00 | 2.41 | 5.84% |
| EMIF | Emerging Markets Infrastructure | | 22.44 | 100 | 1.77 | 1.45 | 4.86% |
| CEW | Emerging Currency Strat | | 17.88 | 90 | 0.56 | 1.13 | -0.69% |
| EBND | Em Mkts Lcl | | 20.20 | 50 | 0.75 | 1.25 | -4.9% |
| EMCB | Emerging Markets Corp | | 64.20 | 67 | 0.38 | 0.76 | 0.47% |
| VWOB | Emerging Mkts Govt | | 62.99 | 75 | 0.69 | 0.95 | -1.19% |
| EEMA | Emerging Markets Asia | | 71.10 | 100 | 1.08 | 3.42 | 7.55% |
| EELV | Em Mkts Low | | 24.10 | 100 | 0.67 | 2.95 | 0.25% |
| DVYE | Emerging Markets Dividend | | 27.95 | 100 | 1.12 | 3.63 | 5.51% |
| SDEM | SuperDividend Em Mkts | | 26.02 | 77 | 0.13 | 1.98 | 4.95% |
| DBEM | Em Mkts Hdgd | | 24.50 | 100 | 0.57 | 2.25 | 6.2% |
| PCY | Emerging Markets Sov | | 20.13 | 75 | 1.21 | 1.98 | -2.38% |
| QEMM | Emerging Mkts StratcFacts | | 58.78 | 100 | 0.62 | 2.51 | 2.84% |
| 12Stocks.com: Charts, Trends, Fundamental Data and Performances of Emerging Markets Stocks | |
|
We now take in-depth look at all Emerging Markets stocks including charts, multi-period performances and overall trends (as measured by Smart Investing & Trading Score ). One can sort Emerging Markets stocks (click link to choose) by Daily, Weekly and by Year-to-Date performances. Also, one can sort by size of the company or by market capitalization. |
| Select Your Default Chart Type: | |||||
| |||||
| Click on stock symbol or name for detailed view. Click on to add stock symbol to your watchlist and to view watchlist. Quick View: Move mouse or cursor over "Daily" to quickly view daily technical stock chart and over "Weekly" to view weekly technical stock chart. | |||||

 | ZTO ZTO Express (Cayman) Inc. |
| Sector: Transports | |
| SubSector: Air Delivery & Freight Services | |
| MarketCap: 20507 Millions | |
| Recent Price: 21.48 Smart Investing & Trading Score : 88 | |
| Day Percent Change: -0.65% Day Change: -0.14 | |
| Week Change: -0.6% Year-to-date Change: 0.9% | |
| ZTO Links: Profile News Message Board | |
| Charts:- Daily , Weekly | |
| Add ZTO to Watchlist: View: Get Complete ZTO Trend Analysis ➞ | |
 | YQ 17 Education & Technology Group Inc. |
| Sector: Consumer Staples | |
| SubSector: Education & Training Services | |
| MarketCap: 32347 Millions | |
| Recent Price: 2.83 Smart Investing & Trading Score : 73 | |
| Day Percent Change: -0.70% Day Change: -0.02 | |
| Week Change: -2.08% Year-to-date Change: 38.7% | |
| YQ Links: Profile News Message Board | |
| Charts:- Daily , Weekly | |
| Add YQ to Watchlist: View: Get Complete YQ Trend Analysis ➞ | |
 | MNSO MINISO Group Holding Limited |
| Sector: Services & Goods | |
| SubSector: Specialty Retail | |
| MarketCap: 69427 Millions | |
| Recent Price: 24.02 Smart Investing & Trading Score : 100 | |
| Day Percent Change: -0.74% Day Change: -0.18 | |
| Week Change: 1.65% Year-to-date Change: 17.8% | |
| MNSO Links: Profile News Message Board | |
| Charts:- Daily , Weekly | |
| Add MNSO to Watchlist: View: Get Complete MNSO Trend Analysis ➞ | |
 | CINT CI&T Inc |
| Sector: Technology | |
| SubSector: Software - Infrastructure | |
| MarketCap: 806 Millions | |
| Recent Price: 3.83 Smart Investing & Trading Score : 20 | |
| Day Percent Change: -0.78% Day Change: -0.03 | |
| Week Change: -1.79% Year-to-date Change: -28.1% | |
| CINT Links: Profile News Message Board | |
| Charts:- Daily , Weekly | |
| Add CINT to Watchlist: View: Get Complete CINT Trend Analysis ➞ | |
 | SIFY Sify Technologies Limited |
| Sector: Technology | |
| SubSector: Internet Service Providers | |
| MarketCap: 159.38 Millions | |
| Recent Price: 1.21 Smart Investing & Trading Score : 30 | |
| Day Percent Change: -0.82% Day Change: -0.01 | |
| Week Change: 1.68% Year-to-date Change: -35.1% | |
| SIFY Links: Profile News Message Board | |
| Charts:- Daily , Weekly | |
| Add SIFY to Watchlist: View: Get Complete SIFY Trend Analysis ➞ | |
 | IBN ICICI Bank Limited |
| Sector: Financials | |
| SubSector: Money Center Banks | |
| MarketCap: 31194.1 Millions | |
| Recent Price: 27.34 Smart Investing & Trading Score : 76 | |
| Day Percent Change: -0.83% Day Change: -0.23 | |
| Week Change: 3.05% Year-to-date Change: 14.7% | |
| IBN Links: Profile News Message Board | |
| Charts:- Daily , Weekly | |
| Add IBN to Watchlist: View: Get Complete IBN Trend Analysis ➞ | |
 | TOUR Tuniu Corporation |
| Sector: Consumer Staples | |
| SubSector: Recreational Goods, Other | |
| MarketCap: 124.459 Millions | |
| Recent Price: 0.92 Smart Investing & Trading Score : 68 | |
| Day Percent Change: -1.11% Day Change: -0.01 | |
| Week Change: 9.08% Year-to-date Change: 37.8% | |
| TOUR Links: Profile News Message Board | |
| Charts:- Daily , Weekly | |
| Add TOUR to Watchlist: View: Get Complete TOUR Trend Analysis ➞ | |
 | XIN Xinyuan Real Estate Co., Ltd. |
| Sector: Financials | |
| SubSector: Real Estate Development | |
| MarketCap: 136.119 Millions | |
| Recent Price: 2.65 Smart Investing & Trading Score : 17 | |
| Day Percent Change: -1.12% Day Change: -0.03 | |
| Week Change: -2.57% Year-to-date Change: -2.6% | |
| XIN Links: Profile News Message Board | |
| Charts:- Daily , Weekly | |
| Add XIN to Watchlist: View: Get Complete XIN Trend Analysis ➞ | |
 | OMAB Grupo Aeroportuario del Centro Norte, S.A.B. de C.V. |
| Sector: Transports | |
| SubSector: Air Services, Other | |
| MarketCap: 1196.38 Millions | |
| Recent Price: 86.69 Smart Investing & Trading Score : 75 | |
| Day Percent Change: -1.13% Day Change: -0.99 | |
| Week Change: -1.62% Year-to-date Change: 2.4% | |
| OMAB Links: Profile News Message Board | |
| Charts:- Daily , Weekly | |
| Add OMAB to Watchlist: View: Get Complete OMAB Trend Analysis ➞ | |
 | DQ Daqo New Energy Corp. |
| Sector: Technology | |
| SubSector: Semiconductor Equipment & Materials | |
| MarketCap: 660.918 Millions | |
| Recent Price: 18.91 Smart Investing & Trading Score : 20 | |
| Day Percent Change: -1.20% Day Change: -0.23 | |
| Week Change: -20.35% Year-to-date Change: -28.9% | |
| DQ Links: Profile News Message Board | |
| Charts:- Daily , Weekly | |
| Add DQ to Watchlist: View: Get Complete DQ Trend Analysis ➞ | |
 | BQ Boqii Holding Limited |
| Sector: Services & Goods | |
| SubSector: Specialty Retail | |
| MarketCap: 33027 Millions | |
| Recent Price: 0.32 Smart Investing & Trading Score : 95 | |
| Day Percent Change: -1.23% Day Change: 0.00 | |
| Week Change: 5.94% Year-to-date Change: -29.1% | |
| BQ Links: Profile News Message Board | |
| Charts:- Daily , Weekly | |
| Add BQ to Watchlist: View: Get Complete BQ Trend Analysis ➞ | |
 | GDS GDS Holdings Limited |
| Sector: Technology | |
| SubSector: Data Storage Devices | |
| MarketCap: 8597.99 Millions | |
| Recent Price: 8.74 Smart Investing & Trading Score : 95 | |
| Day Percent Change: -1.24% Day Change: -0.11 | |
| Week Change: 12.63% Year-to-date Change: -4.2% | |
| GDS Links: Profile News Message Board | |
| Charts:- Daily , Weekly | |
| Add GDS to Watchlist: View: Get Complete GDS Trend Analysis ➞ | |
 | YJ Yunji Inc. |
| Sector: Services & Goods | |
| SubSector: Specialty Retail, Other | |
| MarketCap: 770.644 Millions | |
| Recent Price: 0.78 Smart Investing & Trading Score : 36 | |
| Day Percent Change: -1.27% Day Change: -0.01 | |
| Week Change: 0.58% Year-to-date Change: 9.7% | |
| YJ Links: Profile News Message Board | |
| Charts:- Daily , Weekly | |
| Add YJ to Watchlist: View: Get Complete YJ Trend Analysis ➞ | |
 | IMOS ChipMOS TECHNOLOGIES INC. |
| Sector: Technology | |
| SubSector: Semiconductor Equipment & Materials | |
| MarketCap: 658.918 Millions | |
| Recent Price: 28.21 Smart Investing & Trading Score : 52 | |
| Day Percent Change: -1.33% Day Change: -0.38 | |
| Week Change: -0.77% Year-to-date Change: 3.7% | |
| IMOS Links: Profile News Message Board | |
| Charts:- Daily , Weekly | |
| Add IMOS to Watchlist: View: Get Complete IMOS Trend Analysis ➞ | |
 | JFIN Jiayin Group Inc. |
| Sector: Technology | |
| SubSector: Internet Information Providers | |
| MarketCap: 131.48 Millions | |
| Recent Price: 6.33 Smart Investing & Trading Score : 58 | |
| Day Percent Change: -1.86% Day Change: -0.12 | |
| Week Change: -4.67% Year-to-date Change: 22.2% | |
| JFIN Links: Profile News Message Board | |
| Charts:- Daily , Weekly | |
| Add JFIN to Watchlist: View: Get Complete JFIN Trend Analysis ➞ | |
 | QFIN 360 Finance, Inc. |
| Sector: Financials | |
| SubSector: Credit Services | |
| MarketCap: 956.208 Millions | |
| Recent Price: 19.50 Smart Investing & Trading Score : 95 | |
| Day Percent Change: -1.91% Day Change: -0.38 | |
| Week Change: 5.29% Year-to-date Change: 23.3% | |
| QFIN Links: Profile News Message Board | |
| Charts:- Daily , Weekly | |
| Add QFIN to Watchlist: View: Get Complete QFIN Trend Analysis ➞ | |
 | ZLAB Zai Lab Limited |
| Sector: Health Care | |
| SubSector: Biotechnology | |
| MarketCap: 3970.35 Millions | |
| Recent Price: 16.25 Smart Investing & Trading Score : 57 | |
| Day Percent Change: -2.05% Day Change: -0.34 | |
| Week Change: 2.14% Year-to-date Change: -40.5% | |
| ZLAB Links: Profile News Message Board | |
| Charts:- Daily , Weekly | |
| Add ZLAB to Watchlist: View: Get Complete ZLAB Trend Analysis ➞ | |
 | HCM Hutchison China MediTech Limited |
| Sector: Health Care | |
| SubSector: Drug Manufacturers - Major | |
| MarketCap: 2324.43 Millions | |
| Recent Price: 19.15 Smart Investing & Trading Score : 83 | |
| Day Percent Change: -2.10% Day Change: -0.41 | |
| Week Change: 5.45% Year-to-date Change: 5.7% | |
| HCM Links: Profile News Message Board | |
| Charts:- Daily , Weekly | |
| Add HCM to Watchlist: View: Get Complete HCM Trend Analysis ➞ | |
 | XYF X Financial |
| Sector: Financials | |
| SubSector: Credit Services | |
| MarketCap: 168.008 Millions | |
| Recent Price: 3.82 Smart Investing & Trading Score : 32 | |
| Day Percent Change: -2.30% Day Change: -0.09 | |
| Week Change: -0.68% Year-to-date Change: 4.4% | |
| XYF Links: Profile News Message Board | |
| Charts:- Daily , Weekly | |
| Add XYF to Watchlist: View: Get Complete XYF Trend Analysis ➞ | |
 | KC Kingsoft Cloud Holdings Limited |
| Sector: Technology | |
| SubSector: Software Application | |
| MarketCap: 98487 Millions | |
| Recent Price: 3.39 Smart Investing & Trading Score : 90 | |
| Day Percent Change: -2.87% Day Change: -0.10 | |
| Week Change: 7.28% Year-to-date Change: -10.4% | |
| KC Links: Profile News Message Board | |
| Charts:- Daily , Weekly | |
| Add KC to Watchlist: View: Get Complete KC Trend Analysis ➞ | |
 | WDH Waterdrop Inc. |
| Sector: Financials | |
| SubSector: Insurance - Diversified | |
| MarketCap: 874 Millions | |
| Recent Price: 1.15 Smart Investing & Trading Score : 10 | |
| Day Percent Change: -2.95% Day Change: -0.04 | |
| Week Change: -4.17% Year-to-date Change: 9.8% | |
| WDH Links: Profile News Message Board | |
| Charts:- Daily , Weekly | |
| Add WDH to Watchlist: View: Get Complete WDH Trend Analysis ➞ | |
 | QSG QuantaSing Group Limited |
| Sector: Consumer Staples | |
| SubSector: Education & Training Services | |
| MarketCap: 433 Millions | |
| Recent Price: 3.16 Smart Investing & Trading Score : 35 | |
| Day Percent Change: -3.07% Day Change: -0.10 | |
| Week Change: -7.87% Year-to-date Change: 95.1% | |
| QSG Links: Profile News Message Board | |
| Charts:- Daily , Weekly | |
| Add QSG to Watchlist: View: Get Complete QSG Trend Analysis ➞ | |
 | LI Li Auto Inc. |
| Sector: Services & Goods | |
| SubSector: Auto Manufacturers | |
| MarketCap: 29167 Millions | |
| Recent Price: 27.99 Smart Investing & Trading Score : 42 | |
| Day Percent Change: -3.42% Day Change: -0.99 | |
| Week Change: 11.78% Year-to-date Change: -25.2% | |
| LI Links: Profile News Message Board | |
| Charts:- Daily , Weekly | |
| Add LI to Watchlist: View: Get Complete LI Trend Analysis ➞ | |
 | VIOT Viomi Technology Co., Ltd |
| Sector: Technology | |
| SubSector: Electronic Equipment | |
| MarketCap: 357.2 Millions | |
| Recent Price: 0.67 Smart Investing & Trading Score : 70 | |
| Day Percent Change: -3.51% Day Change: -0.02 | |
| Week Change: 10.41% Year-to-date Change: -32.7% | |
| VIOT Links: Profile News Message Board | |
| Charts:- Daily , Weekly | |
| Add VIOT to Watchlist: View: Get Complete VIOT Trend Analysis ➞ | |
 | LANV Lanvin Group Holdings Limited |
| Sector: Services & Goods | |
| SubSector: Luxury Goods | |
| MarketCap: 712 Millions | |
| Recent Price: 1.60 Smart Investing & Trading Score : 27 | |
| Day Percent Change: -3.61% Day Change: -0.06 | |
| Week Change: 1.27% Year-to-date Change: -47.7% | |
| LANV Links: Profile News Message Board | |
| Charts:- Daily , Weekly | |
| Add LANV to Watchlist: View: Get Complete LANV Trend Analysis ➞ | |
| For tabular summary view of above stock list: Summary View ➞ 0 - 25 , 25 - 50 , 50 - 75 , 75 - 100 , 100 - 125 , 125 - 150 , 150 - 175 , 175 - 200 | ||
| Click To Change The Sort Order: By Market Cap or Company Size Performance: Year-to-date, Week and Day | |
| Select Chart Type: | ||
|
Best Stocks Today 12Stocks.com |
© 2024 12Stocks.com Terms & Conditions Privacy Contact Us
All Information Provided Only For Education And Not To Be Used For Investing or Trading. See Terms & Conditions


One More Thing ... Get Best Stocks Delivered Daily!
Never Ever Miss A Move With Our Top Ten Stocks Lists
Find Best Stocks In Any Market - Bull or Bear Market
Take A Peek At Our Top Ten Stocks Lists: Daily, Weekly, Year-to-Date & Top Trends
Find Best Stocks In Any Market - Bull or Bear Market
Take A Peek At Our Top Ten Stocks Lists: Daily, Weekly, Year-to-Date & Top Trends
Emerging Markets Stocks With Best Up Trends [0-bearish to 100-bullish]: SunCar [100], Hesai [100], Trip.com [100], Noah [100], Weibo [100], United Microelectronics[100], KE [100], Tencent Music[100], Huazhu [100], BrasilAgro -[100], America Movil[100]
Best Emerging Markets Stocks Year-to-Date:
U Power[3264.96%], DouYu [854.74%], MicroCloud Hologram[553.24%], China Liberal[515.21%], Yatsen Holding[493.22%], Zhongchao [338.24%], Uxin [188.16%], GigaCloud [97.11%], QuantaSing [95.06%], Cheetah Mobile[74.12%], Smart Share[68.93%] Best Emerging Markets Stocks This Week:
Smart Share[40.05%], Dingdong (Cayman)[24.6%], NIO [24.05%], OneConnect Financial[21%], 21Vianet [20.89%], KE [17.8%], U Power[17.77%], Hesai [17.05%], Lixiang Education[16.68%], AMTD Digital[16.36%], XPeng [15.56%] Best Emerging Markets Stocks Daily:
OneConnect Financial[12.04%], U Power[9.44%], SunCar [9.43%], Azul S.A[8.63%], AMTD Digital[8.33%], Burning Rock[6.51%], Nu [6.13%], Grupo Televisa[6.02%], XP [5.96%], Dingdong (Cayman)[5.72%], Studio City[5.54%]